DANGEROUS SUMMER: ESCALATING BUSHFIRE, HEAT AND DROUGHT RISK - CLIMATECOUNCIL.ORG.AU
←
→
Page content transcription
If your browser does not render page correctly, please read the page content below
DANGEROUS SUMMER:
ESCALATING BUSHFIRE,
HEAT AND DROUGHT RISK

CLIMATECOUNCIL.ORG.AU
Thank you for
supporting the
Climate Council.
The Climate Council is an independent, crowd-funded organisation
providing quality information on climate change to the Australian public.

    Published by the Climate Council of Australia Limited.
    ISBN:    978-0-6486793-8-7 (print)
             978-0-6486793-9-4 (digital)                                               Professor Will Steffen
    © Climate Council of Australia Ltd 2019.                                           Climate Councillor

    This work is copyright the Climate Council of Australia Ltd. All material
    contained in this work is copyright the Climate Council of Australia Ltd except
    where a third party source is indicated.
    Climate Council of Australia Ltd copyright material is licensed under the
                                                                                       Professor Lesley Hughes
    Creative Commons Attribution 3.0 Australia License. To view a copy of this
                                                                                       Climate Councillor
    license visit http://creativecommons.org.au.
    You are free to copy, communicate and adapt the Climate Council of Australia
    Ltd copyright material so long as you attribute the Climate Council of Australia
    Ltd and the authors in the following manner: Dangerous Summer: Escalating
    Bushfire, Heat and Drought Risk.
                                                                                       Greg Mullins
    Authors: Will Steffen, Lesley Hughes, Greg Mullins, Hilary Bambrick,
                                                                                       AO, AFSM
    Annika Dean, Martin Rice.                                                          Climate Councillor

    —
    Cover images: Top image: AAP Image/Dean Lewins. Middle image: AAP
    Image/Dan Peled. Bottom image: AAP Image/Dave Hunt.                                Professor Hilary Bambrick
                                                                                       Climate Councillor
    This report is printed on 100% recycled paper.

                                                                                       Dr Annika Dean
                                                                                       Senior Researcher

         facebook.com/climatecouncil                 info@climatecouncil.org.au

         twitter.com/climatecouncil                  climatecouncil.org.au
                                                                                       Dr Martin Rice
                                                                                       Head of Research
CLIMATE COUNCIL                       iv

Contents
Key Findings..................................................................................................................................................................................... v

1.     Introduction...............................................................................................................................................................................1

2.		Heatwaves ................................................................................................................................................................................ 9

3.     Drought......................................................................................................................................................................................14

4.     Bushfires.................................................................................................................................................................................. 19

5.     Climate Change is Adversely Affecting People............................................................................................................ 27

6.     Conclusion.............................................................................................................................................................................. 33

References....................................................................................................................................................................................... 35

Image Credits................................................................................................................................................................................. 38

v    DANGEROUS SUMMER:
     ESCALATING BUSHFIRE, HEAT AND DROUGHT RISK

    Key Findings
    1            2
    Australia is being battered by extreme                Climate change is making many extreme
    weather events, made worse by climate                 weather events in Australia worse.
    change. The summer of 2019/20 is shaping
    up as another terrible trifecta of heatwaves,         › Climate change is now making hot days hotter,
    droughts and bushfires.                                 and heatwaves longer and more frequent. This
                                                            has implications for bushfire weather, with fire
    › The projections for the summer of 2019/20             seasons starting earlier and lasting longer.
      are extremely concerning. The Bureau of
      Meteorology is forecasting above average            › Long-term heating and the reduction in cool
      maximum temperatures for most of Australia            season rainfall in mainland southern Australia
      with eastern Australia – already plagued by           are exacerbating drought conditions.
      drought – likely to be drier than average.
                                                          › The period from January 2017 to October 2019
    › The 2019/20 bushfire season in New South              has been the driest on record for the Murray-
      Wales and southeast Queensland began in               Darling Basin as a whole. Over the same period
      winter. Already six lives have been lost and more     of time, new long-term records for low soil
      than 600 homes destroyed in New South Wales,          moisture have been set, with ten of the Basin’s
      mostly in remote and rural areas and small            26 river catchments recording the lowest soil
      towns. It is now only the beginning of summer,        moisture levels on record.
      which means the hottest weather and greatest
      danger period may still be to come.

    › The bushfires have been costly for farmers.
      In Cobraball, Queensland, for example, an
      estimated 12,000 hectares of farmland have
      been destroyed, including 230 hectares of high-
      value horticultural crops, with an estimated $20
      million damage bill for farms in the region.

    › Wildlife has also been badly affected by the
      ongoing bushfires, with reports of at least 1,000
      koala deaths in important habitats in New South
      Wales, Queensland and South Australia and the
      habitats of some of the most ancient and globally
      iconic songbirds have either been burnt or are
      under threat.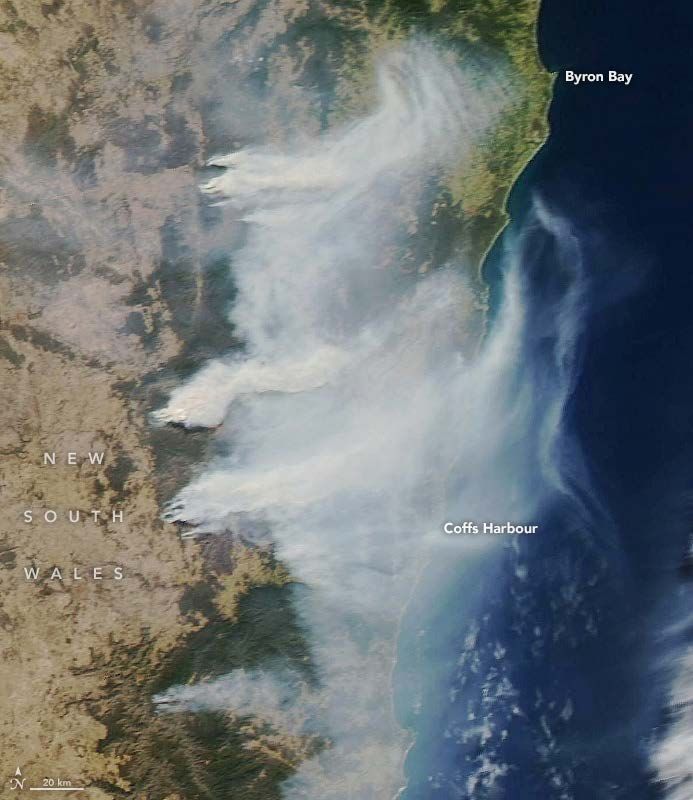
KEY FINDINGS   vi

3
Worsening extreme events, such as heatwaves,
                                                         4
                                                         The catastrophic events that are unfolding in
drought and bushfires, are affecting the health          Australia are not “normal”. Now is the time to
and well-being of Australians and important              act decisively and swiftly.
sectors such as farming.
                                                         › A long-term heating trend from the burning
› The number of heatwave days each year has been           of coal, oil and gas is supercharging extreme
  increasing in Perth, Adelaide, Melbourne, Sydney,        weather events, putting Australian lives, our
  Canberra and Hobart, and across Australia as a           economy and our environment at risk. Australia is
  whole since 1950. Heatwaves can have severe              one of the most vulnerable developed countries to
  effects on human health, including both direct           climate change.
  heat illnesses (e.g. heat exhaustion) and indirect
  impacts (e.g. cardiovascular failure).                 › If greenhouse gas emissions continue to rise, the
                                                           unusually hot weather currently experienced will
› The heatwave that occurred during the summer             become commonplace, occurring every summer
  of 2009 is estimated to have resulted in as many         across the country. Sydney and Melbourne could
  as 500 excess deaths in Melbourne and Adelaide           experience unprecedented 50°C summer days by
  (374 deaths in Melbourne and 50-150 deaths in            the end of the century.
  Adelaide).
                                                         › Australian states, territories, towns and cities
› The current prolonged drought across eastern             are leading the way on climate action. This
  Australia is threatening crops for the third year in     leadership is hugely important because the
  a row, and national summer crop production is            Federal Government has no credible pathway for
  forecast to fall by 20 percent to 2.1 million tonnes     reducing emissions.
  in 2019/20.
                                                         › Australia must contribute to the global effort
› Bushfires also cause serious health impacts,             to deeply and rapidly reduce greenhouse gas
  including direct loss of life, physical injuries and     emissions and we must prepare our fire and
  mental health issues. Large populations are also         emergency services and communities for
  at risk from the health impacts of bushfire smoke,       worsening extreme weather events.
  which contains respiratory irritants and cancer-
  causing substances.

                                                                                     climatecouncil.org.au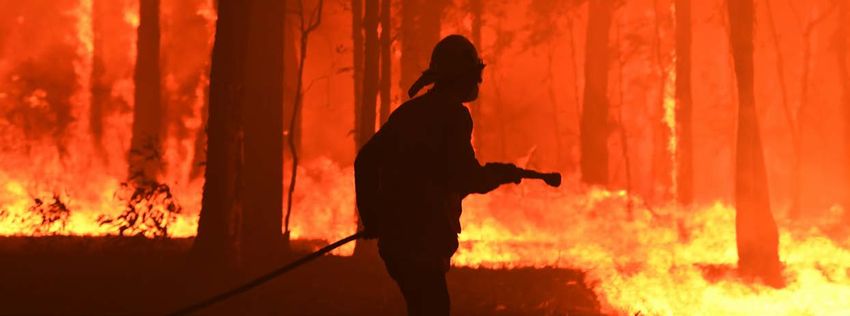
1 DANGEROUS SUMMER:
ESCALATING BUSHFIRE, HEAT AND DROUGHT RISK
1. Introduction
A long-term warming trend from Eastern Australia is currently gripped by a
the burning of coal, oil and gas is prolonged and devastating drought, with
supercharging extreme weather events, no relief in sight. Parts of northern New
putting Australian lives, our economy South Wales and southern Queensland
and our environment at risk. are currently experiencing their driest
conditions on record over certain time
periods. Some of the largest rainfall
deficiencies have occurred in the Macquarie,
Namoi–Peel, and Border Rivers catchments.
Murrurundi in the Upper Hunter in New
South Wales has run out of water and more
than a dozen large New South Wales towns
have dwindling water supplies.
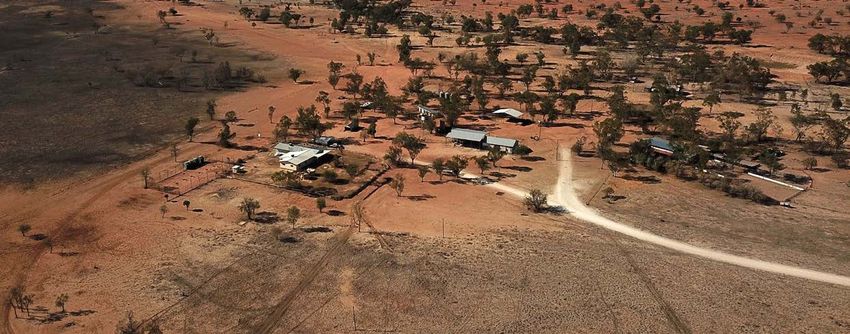
Northern New Major regional centres such as Dubbo,
Tamworth and Orange are currently facing
South Wales severe water shortages. Dubbo’s Burrendong
Dam, fed by the Macquarie River, is
and southern currently at 3 percent of its storage capacity,
and water levels are still falling (current as
Queensland are
at 22 November 2019) (WaterNSW 2019). At
current usage rates and without significant
rainfall, the Burrendong Dam is likely to
experiencing run out of water in May 2020, after which
time the town will rely predominantly on
record breaking bore water. Dubbo has just introduced Level
4 water restrictions in November and the
dry conditions. council is investigating options such as
drilling new bores, using recycled water, and
stormwater harvesting.
Armidale’s main water supply comes from
the Malpas Dam, which is currently at
36.7 percent of storage capacity (as at 25
November 2019) (Armidale Regional Council
2019). The town may have to resort to
trucking water in, if water supplies from the
Malpas Dam run out (SMH 2019).
The majority of Orange’s water comes from
the Suma Park and Spring Creek Dams,
which sit at a combined level of 26.72
percent of storage capacity (current as at
6 November 2019) (Orange City Council
CHAPTER 01   2
                                                                                                    INTRODUCTION

2019). Other sources of water come from             New South Wales and Queensland, and then
the Macquarie River to Orange pipeline,             in November in Victoria and South Australia,
underground water bores and the stormwater          have been aggravated by climate change.
harvesting schemes. Level 5 water restrictions      Bushfire risk has been exacerbated by drought
have been in place since October (Orange            conditions, very dry vegetation and soils, and
City Council 2019). Orange has been funded          record-breaking heat.
to connect to the Wyangala Dam, which
is 20 times bigger than Orange’s own dam            The 2019/20 bushfire season in New South
when full (SMH 2019). Future projections            Wales and southeast Queensland had an early
for the Central Slopes region indicate that         and devastating start in winter (August). More
winter rainfall is likely to decrease, and spring   than 100 fires burned in southeast Queensland
rainfall may also decrease, due to climate          and northeast New South Wales, including in
change. Severe water restrictions are in place      some areas of subtropical rainforest and wet
for most mid-coast New South Wales areas            eucalyptus forest that do not often experience
and Sydney is about to go to Level 2 water          fire. In November 2019, both New South Wales
restrictions due to falling water storage levels    and Queensland state governments declared
in Warragamba Dam.                                  states of emergency. Catastrophic fire danger
                                                    ratings have been experienced at locations and
Droughts also have direct and substantial           times of the year never before recorded.
impacts on agriculture with knock-on effects
to livelihoods and regional employment. The         For the first time since the catastrophic fire
current prolonged drought across eastern            danger rating was introduced in 2009, the
Australia is threatening crops for the third        rating was forecast for Greater Sydney on
year in a row, and national summer crop             12 November 2019. It is also the first time a
production is forecast to fall by 20 percent        catastrophic bushfire danger rating has been
to 2.1 million tonnes. The mental health            declared over such a densely populated area –
of people in rural areas is also affected by        covering around six million residents across
droughts, from both personal distress and           eastern New South Wales. Catastrophic fire
loss of community networks.                         conditions were also forecast in numerous
                                                    places in South Australia on 20 November
Unprecedented extreme and catastrophic fire         and parts of Victoria on 21 November 2019
danger conditions that have broken records          (catastrophic conditions are known as Code
a number of times since 6 September in both         Red in Victoria). Catastrophic is the highest fire

Queensland and New South Wales have
both lost more homes since August 2019
than in any previous year, with the hottest
months of the fire season still to come.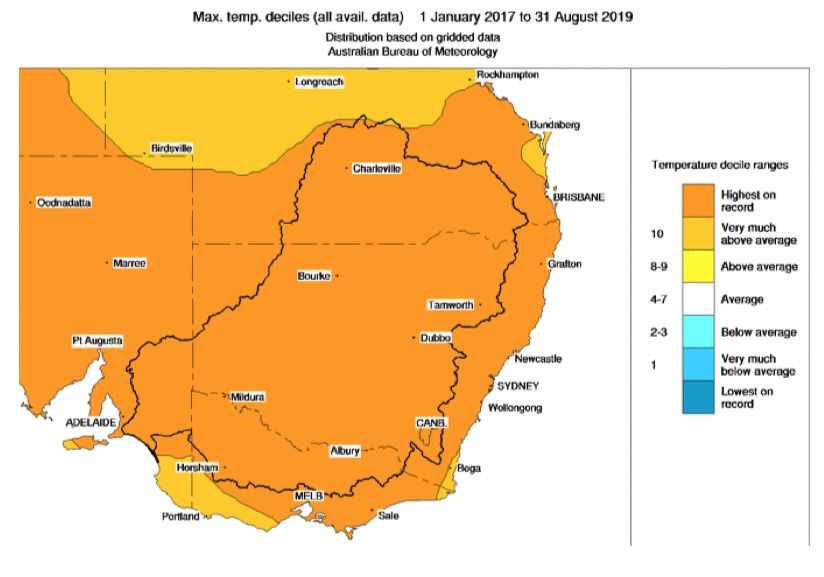
3   DANGEROUS SUMMER:
    ESCALATING BUSHFIRE, HEAT AND DROUGHT RISK

                 danger rating and was introduced after the       Climate change has influenced the pre-
                 2009 Black Saturday fires to describe “off the   conditions for this unprecedented fire season.
                 (McArthur) scale” fire danger indices. Fires     The severe weather and drought conditions
                 in catastrophic conditions cannot be fought      before the beginning of the 2019/20 summer
                 safely, homes are not built to withstand fires   continue the upward trend in the deadly
                 in these conditions, and lives can be lost.      trio of heat, drought and fire. The Australian
                                                                  summer of 2018/19 marked the return of
                 Tragically, the fires in New South Wales         the Angry Summer with record-breaking
                 have claimed the lives of six people and         heat and other destructive extreme weather
                 burnt over 1.7 million hectares of land since    events. Last summer was characterised by
                 November. Since August 9 in New South            prolonged, continental-scale heatwaves, hot
                 Wales more than 600 homes, hundreds of           days, drought conditions in eastern Australia
                 sheds and outbuildings, and many public          and bushfires throughout the country,
                 buildings have been destroyed. This is more      particularly in Queensland and Tasmania,
                 than double the previously recorded worst        parts of Western Australia, Victoria and New
                 loss of homes in New South Wales history,        South Wales. It was the hottest summer on
                 in 2013. Properties affected thus far have       record by a large margin (2.14°C above the
                 mostly been in small towns and remote rural      1961-1990 baseline) with more than 206
                 areas. Queensland has lost more homes            extreme weather records broken (Figure 1).
                 since August 2019 than in any previous year      This follows previous Angry Summers in
                 and heritage buildings such as the Binna         2012/13, 2013/14 and 2016/17.
                 Burra Lodge have been destroyed.
                                                                  While shorter-term climate drivers such
                 Agricultural lands have also been affected       as the Indian Ocean Dipole (IOD) (one
                 by the bushfires. For example, in Cobraball      of the strongest positive Indian Ocean
                 in Queensland, 12,000 hectares of farmland       Dipoles on record is still going on) and
                 have been destroyed, including 230               the Southern Annular Mode (SAM) (which
                 hectares of high-value horticultural crops.      has been in an unusually long negative
                 The damage bill for farms in this region has     phase, bringing strong westerly winds over
                 been estimated at $20 million.                   southern Australia) can influence conditions
                                                                  in individual summers, the underlying
                 The current bushfires have also badly            driver of the longer-term worsening of
                 affected wildlife, with estimates of 1,000       extreme summer weather is climate change.
                 koala deaths in important habitats in            Australia’s climate has warmed by about
                 New South Wales, Queensland and                  1°C from 1910, with most heating occurring
                 South Australia. There are also many rare        since 1950. The number of record hot days
                 species whose lives and habitat have been        has doubled since 1960 and nine of the
                 destroyed, or remain threatened, including       ten hottest years on record have occurred
                 some of the most ancient songbirds on the        since 2005. Bushfire seasons are starting
                 planet (e.g. the Albert’s Lyre Bird, the Tree    much earlier and lasting longer, there are
                 Creeper and the Cat Bird).                       more days with fire danger ratings of very
                                                                  high or above, and fires are now burning in
                 It is likely that the bushfire seasons in New    vegetation that normally does not burn.
                 South Wales and possibly also Queensland
                 have several more months to run with the
                 hottest weather still to come. Property losses
                 have also already occurred in both Western
                 Australia and South Australia with the worst
                 fire danger months expected in early 2020.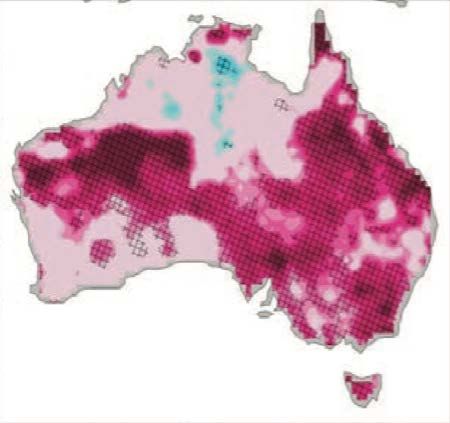
CHAPTER 01           4
                                                                                                                                 INTRODUCTION

                                                                                         IN JUST 90 DAYS, OVER 206 RECORDS

                               ANGRY
                                                                                         BROKEN, INCLUDING:
       2018/19

     SUMMER
                                                                                          ›   Record-highest summer temperature: 87 locations
                                                                                          ›   Record-lowest summer total rainfall: 96 locations
                                                                                          ›   Record highest summer total rainfall: 15 locations
                                                                                          ›   Record number of days 35°C or above: 2 locations
                                                                                          ›   National or state/territory hottest on record:
                                                                                              5 states/territories and (1) Australia.

NORTHERN TERRITORY
                                                                                                        QUEENSLAND
›   Hottest summer on record (2.67°C above average).
                                                                                                        › Cloncurry: 43 consecutive days of
›   Rabbit Flat: 34 consecutive days of 40°C or above.                                                    40°C or above (State record).
                                                                                                        ›   Townsville received more than annual
                                                                                                            average rainfall in 10 days (1,257 mm).

WESTERN AUSTRALIA
› Hottest summer on
  record (1.73°C above                                                                                             NEW SOUTH WALES
  average).
› Marble Bar: 45°C or                                                                                              ›       Hottest summer on record
  higher on 32 days                                                                                                        (3.41°C above average).
  during the summer.
                                                                                                                   ›       Bourke: 21 consecutive days
                                                                                                                           above 40°C (State record).

                                                                                                                       CANBERRA
                                                                                                                       ›    Hottest summer on record.
                                                                                                                       ›    35°C or above on 24 days,
                                                                                                                            five times the summer
SOUTH AUSTRALIA                                                                                                             average.

›   Port Augusta: Hottest temperature this
    summer - 49.5°C on January 24.
›   Adelaide: Hottest temperature for January
    or any month – 46.6°C on January 24.
                                                           VICTORIA                                            TASMANIA
                                                           ›   Hottest summer on record                        ›   Driest January on record.
                                                               (2.54°C above average).
                                                                                                               ›   Bushfires burned ~ 200,000
                                                                                                                   hectares of vegetation.

    Note: For all statistics, the average is calculated over the period between 1961 and 1990.
    Records are for seasonal or monthly mean temperature unless otherwise specified.

    Figure 1: Climate change is increasing the frequency and/or severity of extreme weather in Australia.
    During the 2018/19 Angry Summer over 206 extreme weather records were broken.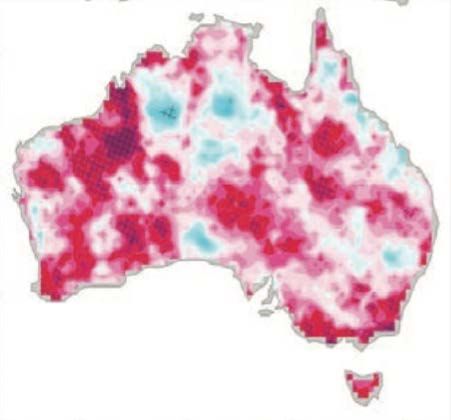
5   DANGEROUS SUMMER:
    ESCALATING BUSHFIRE, HEAT AND DROUGHT RISK

                 The rate of heating is increasing, leading     Worsening extreme weather events are
                 to temperature records being broken in         already exacting a heavy toll on the health
                 close succession. Over recent decades there    and well-being of Australians, damaging
                 has been a strong upswing in summer            livelihoods and economic assets, and
                 temperatures in Australia, with above          threatening many of our most iconic
                 average temperatures recorded for most         ecosystems. For more details on climate
                 summers since the late 1970s (compared to a    impacts on ecosystems, see “This is What
                 1961-1990 baseline).                           Climate Change Looks Like” (Climate
                                                                Council 2019a), and for a more detailed
                 Climate change is making many types            account of the economic impacts of climate
                 of extreme weather worse, especially           change, see “Compound Costs: How Climate
                 heatwaves. Heatwaves are lasting longer,       Change is Damaging Australia’s Economy”
                 reaching higher maximum temperatures           (Climate Council 2019b).
                 and are occurring more frequently over
                 many regions of Australia. During the          The impacts that we are experiencing now
                 2018/2019 summer, exceptional heatwaves        at around a 1.1°C rise in global average
                 occurred, which were notable for their         temperature are the forerunners of rapidly
                 continental-wide scale, as well as for         escalating risks as the temperature rises
                 breaking records for duration and individual   towards 2°C and beyond, compared to pre-
                 daily extremes. During the spring just past    industrial levels. All Australian states and
                 (2019) a heatwave traversed the continent      territories are already affected by climate
                 from Western Australia, across Southern        change in different ways (Figure 2). The
                 Australia to the eastern states. Perth had     severity of future extreme weather events in
                 its hottest November day on record (40.4˚C     Australia depends on how fast and deeply
                 on 16 November), while Melbourne and           greenhouse gas emissions can be reduced,
                 Hobart both equalled their spring maximum      here in Australia and around the world.
                 temperature records (40.9˚C and 36.8˚C,
                 respectively on 21 November).

    The impacts Australians are
    experiencing now at around a 1.1°C
    rise in global average temperature are a
    prelude to the rapidly growing risks as
    the temperature rises towards 2°C and
    above compared to pre-industrial levels.
CHAPTER 01 6
INTRODUCTION
HOW WILL CLIMATE CHANGE
AFFECT AUSTRALIA?
Cyclones are likely to Heatwaves will Potential severe
become more intense, become even thunderstorm days
but less frequent. longer and hotter. are expected to increase.
Extreme rainfall events Higher sea levels Droughts are likely
are expected to become will increase to happen even
more intense. flooding in coastal more often.
cities and towns.
Hotter and drier
conditions will lead
to harsher bushfire
weather.
Figure 2: Impacts of climate change on extreme weather events across the Australian continent. Nowhere in Australia is
immune to the impacts of climate change.7 DANGEROUS SUMMER:
ESCALATING BUSHFIRE, HEAT AND DROUGHT RISK
CHANCE OF EXCEEDING THE MEDIAN MAXIMUM TEMPERATURE
FOR DECEMBER 2019 TO FEBRUARY 2020
80
Chance of exceeding median max. temp. (%)
75
70
65
60
55
50
45
40
35
30
25
20
Figure 3: Most of Australia is forecast to experience above average maximum temperatures over summer 2019/20.
Source: BoM 2019a.
The projections for the rest of the summer
are extremely concerning. The Bureau of
Meteorology forecasts hot conditions for
most of Australia (Figure 3) with eastern
Australia likely to be drier than average
(Figure 4).CHAPTER 01 8
INTRODUCTION
CHANCE OF EXCEEDING THE MEDIAN RAINFALL
FOR DECEMBER 2019 TO FEBRUARY 2020
80
75
Chance of exceeding median rainfall (%)
70
65
60
55
50
45
40
35
30
25
20
Figure 4: Dry conditions set to prevail over the summer 2019/20, particularly in eastern Australia. Source: BoM 2019a.
For more details, access BoM’s website:
http://www.bom.gov.au/climate/outlooks/#/
overview/summary.
With Australia already reeling from the
impacts of extreme weather and more
likely to be on the way, we describe here
the influence of climate change on these
extreme events and their effects on human
health and well-being.9 DANGEROUS SUMMER:
ESCALATING BUSHFIRE, HEAT AND DROUGHT RISK
2. Heatwaves
Heatwaves are one of the most serious higher maximum temperatures and are
climate-related risks for Australians, occurring more frequently over many
and the link between climate change regions of Australia (for the time period
and more extreme heatwaves is clear. 1971-2008) (Perkins and Alexander 2013;
Heatwaves are lasting longer, reaching Perkins-Kirkpatrick et al. 2016).
BOX 1: WHAT IS A HEATWAVE?
In Australia, a heatwave is defined operationally the hottest day of a heatwave; and (iv) timing
as a period of at least three days where the characteristics, including the occurrence of the
combined effect of high temperatures and first heatwave event in a season (Figure 5).
excess heat is unusual within the local climate
(BoM 2012; Nairn and Fawcett 2013). Two As greenhouse gases continue to accumulate in
aspects of this definition are important. First, the atmosphere from the burning of coal, oil and
a heatwave is defined relative to the local gas, more heat is trapped in the lower atmosphere.
climate. That is, a heatwave for Hobart will Australia’s climate has warmed by just over 1°C
occur at lower temperatures than one for Alice since 1910, with most of the warming occurring
Springs. Second, the concept of excess heat since 1950. This long-term warming trend has led
is also important. Excess heat occurs when to an increase in the frequency of extreme heat
unusually high overnight temperatures do not events (CSIRO and BoM 2018). Since 1960, the
provide relief from daytime heat. Heatwaves annual number of record hot days across Australia
have several significant characteristics. These has more than doubled (CSIRO and BoM 2012).
include (i) frequency characteristics, such as
the number of heatwave days and the annual While hot weather is a pre-requisite for heatwaves,
number of summer heatwave events; (ii) it is important to remember that heatwaves are
duration characteristics, such as the length of more than just stand-alone hot days. At least three
the longest heatwave in a season; (iii) intensity excessively hot days must occur in a row for a
characteristics, such as the average excess heatwave to form, according to the Australian
temperature expected during a heatwave and definition (BoM 2012; Nairn and Fawcett 2013).CHAPTER 02 10
HEATWAVES
A
10°S
THE NUMBER OF HEATWAVE
15°S DAYS IS INCREASING
20°S Red shows an increase in the number of heatwave
days. Figure A clearly shows that the number
25°S of heatwave days has increased over much of
Australia, particularly the eastern half.
30°S
35°S
40°S
45°S
120°E 130°E 140°E 150°E
-2 -1.2 -0.4 0.4 1.2 2
Heatwave days expressed as a percentage
of all summer days per summer.
B
10°S
HEATWAVES ARE OCCURING
15°S MORE FREQUENTLY
20°S Red indicates an increase in the number of
heatwave events per summer.
25°S
An increase in the number of heatwave days in
30°S turn influences the number of heatwave events
and/or their duration, and although smaller,
areas of increasing trends in heatwave frequency
35°S (Figure B) and duration of the longest yearly event
(Figure C) are consistent with that of heatwave
40°S days. Note that changes in heatwave events and
duration will generally lag behind that of heatwave
45°S days— while an increase in the number of days is
120°E 130°E 140°E 150°E required to increase the duration and frequency,
both cannot occur at the same time. That is, for
each extra heatwave day that is gained, the new
-1 -0.6 -0.2 0.2 0.6 1 day can only contribute to heatwave duration or
frequency.
Number of heatwave events per summer.
C
10°S
THE DURATION OF THE LONGEST
15°S YEARLY HEATWAVE IS INCREASING
20°S Red indicates an increase in the number of days of
the longest heatwave of a summer.
25°S
30°S
35°S
40°S
45°S
120°E 130°E 140°E 150°E
-1 -0.6 -0.2 0.2 0.6 1
The length in days of the longest
event per summer11 DANGEROUS SUMMER:
ESCALATING BUSHFIRE, HEAT AND DROUGHT RISK
D
10°S
THE FIRST HEATWAVE OF THE
15°S SEASON IS OCCURING EARLIER
20°S Red indicates a heatwave occurring earlier relative
to the long- term average. Since 1950, almost
25°S all of Australia has experienced a lengthening
of the heatwave season, where the first event is
30°S occurring much earlier (Figure D).
35°S
40°S
45°S
120°E 130°E 140°E 150°E
-10 -8 -6 -4 -2 0 2 4 6 8 10
Start day of the first event per summer.
E
10°S
THE HOTTEST DAY OF A HEATWAVE
15°S IS BECOMING HOTTER
20°S Red shows increasing temperatures. Figure E
shows that the hottest day of a heatwave, i.e.
25°S its peak, has a detectable increase for almost all
of Australia below the Tropics. Such trends are
30°S consistent with, and continue on from those
reported by (Perkins et al. 2012), since they include
35°S the latest complete Australian summer data.
40°S
45°S
120°E 130°E 140°E 150°E
-5 -4 -3 -2 1 0 1 2 3 4 5
Extreme Heat Factor units (°C2).
Figure 5: A through E depict changes in five heatwave characteristics across the continent from 1950–2013. All heatwave
metrics are calculated relative to a 1961–1990 base period, using the heatwave definition from the Australian Bureau of
Meteorology (Nairn and Fawcett 2013). Source: Climate Council 2014, modified from Perkins and Alexander (2013) using
AWAP (Australian Water Availability Project) data from the Bureau of Meteorology.
Heatwaves have been worsening in during the period 1981-2011 compared to
Australia’s cities. The number of heatwave 1950-1980 (see Table 1). The intensity of the
days each year has been increasing in Perth, hottest day in a heatwave has increased in
Adelaide, Melbourne, Sydney, Canberra and all cities. Most dramatically, the peak day in
Hobart, and across Australia as a whole since Adelaide is, on average, now 4.3°C higher in
1950. Heatwaves now start earlier – by 19 1981-2011 than it was in 1950–1980.
days in Sydney and by 17 days in MelbourneCHAPTER 02 12
HEATWAVES
Number of Number of
heatwave heatwave Length of
Changes Changes Changes
days (events) longest event
in average in average in timing
intensity of intensity of of first
1950- 1981- 1950- 1981- 1950- 1981- the heatwave the peak day event
City 1980 2011 1980 2011 1980 2011 (°C) (°C) (days)
Sydney 6 9 1-2 2-3 4 5 1.5 1.5 -19
Melbourne 5 6 1-2 1-2 4 4 1.5 2 -17
Brisbane 10 10 2-3 2-3 6 6 1 1.5 -8
Perth 6 9 1-2 2-3 4 5 1.5 1.5 +3
Adelaide 5 9 1-2 1-2 4 6 2.5 4.3 -2
Hobart 4 5 1 1-2 4 4 -1.5 1.7 -12
Darwin 3 7 1 1-2 4 5 0 1 -7
Canberra 6 13 1-2 2-3 5 7 0 1.5 -3
Table 1: The average number of heatwave days, number of events, length of the longest event, average heatwave intensity,
average intensity of the peak heatwave day, and change in the timing of the first summer heatwave for Australia’s capital
cities (Perkins and Alexander 2013). Statistics were calculated from the high-quality ACORN-SAT temperature dataset for
the period 1951-2011 (Trewin 2013), using the Excess Heat Factor heatwave definition (Nairn and Fawcett 2013; Perkins and
Alexander 2013). All statistics are rounded to the nearest integer. The first column for each characteristic is for the 1950–
1980 period and the second is for the 1981–2011 period. Changes in average intensity and peak intensity are calculated by
comparing the respective averages for the periods 1950–1980 and 1981–2011. Changes in timing are calculated by subtracting
the average start date during 1981–2011 from that of 1950–1980. Source: Climate Council 2014.
Climate change has increased the risk of Australia, exceptionally severe heatwaves
severe heatwaves by two- and three-fold occurred, notable for their continental-wide
in terms of their frequency and intensity scale as well as for breaking records for both
respectively (Perkins et al. 2014), a trend duration and individual daily extremes (BoM
that is reflected in recent observations of 2019b). The widespread heatwave conditions
individual heatwave events. Over the past occurred throughout most of December and
decade a remarkably large number of record- January but peaked in late December and in
breaking and devastating heatwaves have mid-January. The latter heatwave was the
occurred in Australia and in many other most significant heatwave on record at the
parts of the world (Coumou and Rahmstorf national scale (Figure 6).
2012). During the 2018/19 summer in13 DANGEROUS SUMMER:
ESCALATING BUSHFIRE, HEAT AND DROUGHT RISK
HIGHEST THREE-DAY HEATWAVE CATEGORY 11 - 26 JANUARY 2019
Heatwave Status
Extreme heatwave
Severe heatwave
Low-intensity heatwave
No heatwave
Figure 6: Highest three-day heatwave category reached in different areas between January 11 - 26 2019. Large areas of
Western Australia, South Australia, New South Wales and Victoria were affected by either severe or locally extreme heatwaves
during this period. Source: BoM 2019b.
Climate change is making heatwaves
worse. The 2018/19 summer heatwaves
were unprecedented.
If greenhouse gas emissions continue to unprecedented 50°C summer days by the
rise, the unusually hot weather currently end of the century — even if global warming
experienced will become commonplace, is limited to 2°C above pre-industrial levels
occurring every summer across the country. (Lewis et al. 2017).
Sydney and Melbourne could experienceCHAPTER 03 14
DROUGHT
3. Drought
RAINFALL This decline has been most apparent in
April and May (see Figure 7) (CSIRO and
Rainfall is the main variable that influences BoM 2016; CSIRO and BoM 2018).
droughts. How climate change is influencing
droughts around the world largely depends The reduction in cool season rainfall
on how it is affecting total rainfall and in these regions is having significant
rainfall patterns. In Australia, rainfall impacts, as the majority of annual rainfall
is highly variable and is significantly in these regions typically falls during the
influenced by climate drivers such as the cool season. Over the past 200 years or
El Niño Southern Oscillation (ENSO) and so, cool season rainfall in this region has
the Indian Ocean Dipole (IOD) phenomena, been relatively stable, supporting some of
especially in eastern Australia. This natural the nation’s most productive agricultural
climate variability can make it more difficult areas. Major cities such as Perth, Adelaide
to extract and identify the climate change and Melbourne have also traditionally
signal in changes to rainfall. Despite this been dependent on cool season rainfall to
variability, some trends in rainfall have fill dams.
emerged in recent decades.
Although changes to several influences
Northern Australia has become wetter, on annual (seasonal) and interannual
particularly in the northwest. Rainfall across rainfall variability seemingly play a role
most of northern Australia has been very in the observed rainfall declines, climate
much above average in the northern wet change has likely exacerbated certain
season (the monsoon). In northwest Western aspects of these declines through links
Australia, rainfall has also been above to the poleward shift in storm tracks,
average in the dry season (CSIRO and BoM positive trends in the Southern Annular
2015; CSIRO and BoM 2018). Mode, an increase in pressure in the sub-
tropics and the expansion of the Hadley
At the same time, rainfall in the mainland Cell (CSIRO and BoM 2015).
southeast and southwest corners of the
continent has been declining during the cool In recent decades, the subtropical ridge
season (April – October) in recent decades that extends across the southern part of
(CSIRO and BoM 2018). The cool months the continent has intensified, blocking
of the year also coincide with the typical more cool-season rain bearing systems
growing season in these regions. from reaching southern Australia. The
increased intensity of the subtropical
Southwest Western Australia has ridge, related to the rising global average
experienced a pronounced decline in cool temperature, is able to explain up to
season rainfall, with particularly strong two thirds of the decline in rainfall
drying from May through July when rainfall across mainland southeast Australia
has reduced by around 20 percent since between 1997 and 2009 (associated
1970 (CSIRO and BoM 2018). Since the mid- with the Millennium Drought) (Timbal
1990s, mainland southeast Australia has and Drosdowsky 2013). The World War
experienced an 11 percent reduction in April- II drought is the first dry decade of the
October rainfall (CSIRO and BoM 2018). 20th century in southeast Australia that15 DANGEROUS SUMMER:
ESCALATING BUSHFIRE, HEAT AND DROUGHT RISK
RAINFALL DECILE RANGES
Highest on record
10 Very much above average
8-9 Above average
4-7 Average
2-3 Below average
1 Very much below average
Lowest on record
Rainfall has been very low over
parts of southern Australia during
April to October in recent decades.
Figure 7: Cool season (April – October) rainfall has been below average across Australia over the past 20 years compared to
the entire rainfall record from 1900. Source: CSIRO and BoM (2018).
may have been influenced by climate SAM shows an increasing tendency to
change through the intensification of the remain in a positive phase, with westerly
subtropical ridge (Drosdowsky 2005; Timbal winds contracting towards the south pole.
and Drosdowsky 2013; Gergis 2018, p.102). Paleoclimatic evidence indicates that
the SAM index is now at its highest level
Some studies have also suggested (indicating increased occurrence of positive
that climate change may increase the phases) for at least the past 1,000 years
occurrence of positive phases of the IOD, (Abram et al. 2014; Dätwyler et al. 2018). The
which are associated with decreased SAM may also be affected by the expansion
rainfall in the southeast during the cool of the Hadley Cell as the climate warms and
season (on interannual timescales) (Cai the tropics expand, ‘pushing’ temperate
et al. 2009a; Ummenhofer et al. 2009; regions poleward. The expansion of the
Ummenhofer et al. 2011). Hadley Cell is effectively a change in the
position and strength of the temperature
The behaviour of the Southern Annular gradient between the equatorial regions
Mode (SAM) also appears to have changed and the polar regions. As the temperature
in recent decades, but the extent to gradient influences mid-latitude storms, the
which climate change is responsible is change in position of this gradient also leads
equivocal. During the summer and autumn to a change in the mean position of mid-
months (December through to May), the latitude storms.CHAPTER 03 16
DROUGHT
TEMPERATURES AND EVAPORATION Nevertheless, some studies have found that
the severity of the Millennium Drought was
Droughts are usually accompanied by an exacerbated by increased temperatures
increase in temperature. This is because due to climate change (Cai et al. 2009b;
evaporation tends to be limited by the total Ummenhofer et al. 2009). Research has
water availability during droughts, so rainfall also found that the influence of rising
deficiencies are generally associated with temperatures due to climate change reduced
reduced evaporative cooling, which raises streamflow during the Millennium Drought
local temperatures (Lockart et al., 2009). (Cai and Cowan 2008). A 1˚C rise in annual
average temperature was found to lead to a
As well as the natural increases in local 15 percent reduction in annual streamflow
temperature that occur during drought over the southern MDB in winter and spring
periods, there has also been a greenhouse- (Cai and Cowan 2008).
induced rise in global and regional
temperatures. For example, the average Increased temperatures have also been
temperature across Australia has risen by found to worsen the impacts of droughts.
about 1˚C since 1910, leading to an increase For example, higher air temperatures,
in extreme heat events (see Section 2) (CSIRO combined with lower streamflow,
and BoM 2018). This means that when can enhance the production of toxic
local temperature rises in association with cyanobacterial blooms, leading to lower
drought conditions, it occurs on top of a dissolved oxygen concentrations in lakes
warmer baseline. and streams (Mosley 2015). Observed tree
die-off events across Australia have also
Increased temperatures have the effect been found to increase when water deficits
of increasing evaporative demand (the coincide with high maximum temperatures.
extent to which the environment is ‘trying’ Higher temperatures are also associated
to evaporate water – actual evaporation with increased demand for water by
depends on the supply of water as well as humans and animals.
evaporative demand). Other variables that
increase evaporative demand include more
sunlight, more wind, and lower atmospheric CURRENT DROUGHT CONDITIONS
humidity. These latter factors have a
relatively larger influence than temperature. The Murray-Darling Basin (MDB) has been
Nevertheless, sustained increases in one of the most severely affected regions in
temperature can further reduce the amount the current drought (BoM 2019c). Rainfall
of water available during droughts, for deficiencies have affected most of the
example, for plant growth or runoff to rivers New South Wales, Queensland and South
by contributing to increased evaporative Australian parts of the MDB since the start of
demand, assuming other factors are stable. 2017. In New South Wales, long-term rainfall
For example, if the temperature increases deficiencies have also extended towards the
by 1˚C, daily evaporation should increase coast in the Illawarra and Hunter districts,
by roughly 0.08 mm per day, or 1 mm over and have affected most of the eastern
12 days (ARC COE for Climate Extremes half of South Australia. Long-term rainfall
2019). Changes to other variables can either deficiencies are also affecting Gippsland
strengthen or weaken this influence. in eastern Victoria and the east coast of
Tasmania, as well as the northern half of
The extent to which higher temperatures due New South Wales and southern Queensland.
to climate change worsen droughts is still (BoM 2019c).
an active area of research (Kiem et al. 2016).17 DANGEROUS SUMMER:
ESCALATING BUSHFIRE, HEAT AND DROUGHT RISK
RAINFALL DEFICIENCIES: 36 MONTHS
1 NOVEMBER 2016 TO 31 OCTOBER 2019
Rainfall Percentile Ranking
10
Serious Deficiency
5
Severe Deficiency
Lowest on Record
Figure 8: For the past three years rainfall across most of New South Wales, the southern half of Queensland, the eastern half
of South Australia, parts of Victoria and southwest Western Australia has been either seriously deficient (above the lowest 5
percent of observations but below the lowest 10 percent of observations), severely deficient (below the lowest 5 percent of
observations) or the lowest on record. Source: BoM 2019c.
Northern New The 34 months from January 2017 to
October 2019 have been the driest on record
South Wales for the MDB as a whole, particularly in the
northern MDB and for New South Wales.
and southern
Both east and west Gippsland districts
have also had their driest 34 months on
record since January 2017 (BoM 2019c). In
Queensland are the MDB, new long-term records for low
soil moisture have been set, with ten of the
experiencing their Basin’s 26 river catchments recording the
lowest soil moisture on record for the 34
driest conditions months from January 2017 (BoM 2019c).
on record. In each of the past three years, rainfall
deficiencies have been particularly acuteCHAPTER 03 18
DROUGHT
during the cool season. In 12 of the 30 The New South Wales and Queensland
rainfall districts in New South Wales, rainfall Governments produce their own drought
was at least 50 percent below average in maps (NSW: https://edis.dpi.nsw.gov.au and
2017, 2018 and 2019. The cool season is Queensland: https://www.longpaddock.qld.
particularly important for generating runoff gov.au/drought/archive/). The New South
to fill rivers, streams and reservoirs in time Wales government measures drought using a
for the summer, which is generally when combined drought indicator, which accounts
water demand increases (BoM 2019c). Figure for rainfall, soil moisture and pasture/
8 shows rainfall deciles for the three-year crop growth indices. An area is declared in
period commencing 1 November 2016. It drought if at least one indicator (rainfall, soil
shows the areas with severe and serious water, plant growth) falls below 5 percent
rainfall deficiencies, as well as the lowest when compared to historical records. Intense
rainfall on record over this period. drought is recorded when all three indicators
fall below 5 percent when compared to
The impacts of the dry conditions have been historical records, and an area is recorded as
exacerbated by record high temperatures. drought affected if any one of these indices
Temperatures have been particularly warm falls below 30 percent when compared to
over the most drought affected regions. For historical records. By this measure, more
example, the mean annual temperature than 99 percent of New South Wales is
averaged over the MDB in 2017 was the currently either drought declared, in intense
highest on record (+1.53˚C above the drought or drought affected. Only 0.2 percent
1961-1990 average), but this record was of New South Wales is not in drought, while
broken again in 2018 with a mean annual 0.2 percent of the state is recovering (up to
temperature +1.66˚C above the 1961-1990 date as at 20 November 2019).
average. While droughts are often associated
with above average temperatures as The Queensland Government has its own
described above, these conditions are 1˚C classification system. The responsibility for
or higher than comparably dry years that declaring or revoking a regional council,
occurred in the past (BoM 2019d). shire or property as drought affected
rests with the Minister for Agricultural
The summer of 2018/19 was the hottest on Development and Fisheries, who makes
record for Australia at +2.14˚C above the this decision based on advice from Local
1961-1990 average. Daytime temperatures Drought Committees, and information
were +2.6˚C above the long-term average about the previous twelve months of rainfall
(BoM 2019e). January 2019 was the hottest compared to historical records (which must
on record for every state and territory except meet the definition of experiencing a one
South Australia and Western Australia. in ten-to-fifteen-year rainfall deficiency)
Conditions were particularly extreme in (Queensland Government 2019). According
New South Wales, where monthly mean to this classification system, more than
temperatures were 5.86 °C above average, 66 percent of the land area of Queensland
breaking the state’s hottest month on record is currently in drought, covering 33 local
by more than 2°C (BoM 2019d). March was government areas and partially covering a
also the warmest on record over Australia further four local government areas. There
(BoM 2019e). Overall, the year to date has are also an additional 23 Individual Drought
been the second-warmest January–October Affected Properties across an additional eight
on record for Australia (spanning 110 years), Local Government Areas (up to date as at 1
with rainfall the second lowest on record for September 2019).
Australia as a whole (spanning 120 years)
(BoM 2019f).19 DANGEROUS SUMMER:
ESCALATING BUSHFIRE, HEAT AND DROUGHT RISK
4. Bushfires
Climate change is escalating the In 2019 there was an early start to the
bushfire risk, with an increase across bushfire season when many major fires
southeast Australia in the number broke out under Very High fire danger
of days of Very High fire danger and conditions on 9 August through the
above over the last 30 years. Bushfire Clarence and Richmond Valleys in northern
seasons are starting earlier and lasting New South Wales. With the absence of rain
longer. For example, in New South most of these fires continued to escalate
Wales the statutory bushfire danger and by 24 November 2019 more than 600
period established in the Rural Fires homes and public buildings had been
Act runs from 1 October to 31 March. destroyed in New South Wales. This is
In 2018, after homes were destroyed at notable as apart from the October 2013 Blue
Tathra on the New South Wales South Mountains and Central Coast bushfires, all
Coast in March, a major fire threatened previous significant property losses due
hundreds of homes from Holsworthy to fires in New South Wales had occurred
to Sutherland in Sydney’s south in from late November through to February.
April. Fires continued in July, then It is also notable as the losses thus far have
homes were lost to fires on the South occurred in remote rural areas and small
Coast with major fires breaking out in towns, not urban / bushland interface areas
several areas including Port Stephens where most previous significant losses
on 15 August. have occurred. Both New South Wales and
Queensland have exceeded the previous
record for property losses in a fire season,
with perhaps months of serious fire weather
still to come.
A fire needs to be started (ignition), it
needs something to burn (fuel), and it
needs conditions that are conducive to its
spread (suitable weather) (Figure 9). Climate
change, primarily driven by the burning of
fossil fuels – coal, oil and gas – can affect
all of these factors in both straightforward
and more complex ways. The actions of
people, both positive (hazard reduction,
firefighting), and negative (arson) can also
affect where and when a fire is started, and
how it is controlled.CHAPTER 04 20
BUSHFIRES
MAIN FACTORS AFFECTING BUSHFIRES
1 | Ignition
3 | People
Fires can be started by
Fires may be deliberately started
lightning or people, either
(arson) or be started by accident
deliberately or accidentally.
(e.g. by powerline fault). Human
activities can also reduce fire,
either by direct suppression
or by reducing fuel load by
prescribed burning.
2 | Fuel 4 | Weather
Fires need fuel of sufficient quantity Fires are more likely to spread on
and dryness. A wet year creates favourable hot, dry, windy days. Hot weather
conditions for vegetation growth. If this is also dries out fuel, favouring fire
followed by a dry season or year, fires are spread and intensity.
more likely to spread and become intense.
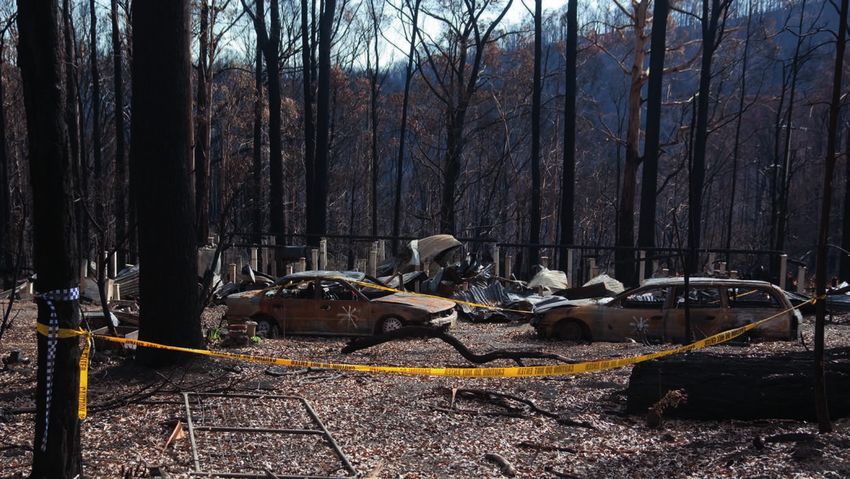
Figure 9: Main factors affecting bushfires: ignition, fuel, people and weather.Figure 10: An example from Kinglake in Victoria of the disturbing impacts of bushfires in Australia. The unprecedented
ferocity of the Black Saturday bushfires in Victoria claimed 173 lives.
HOT DAYS AND HEATWAVES 1978). The Bureau of Meteorology (BoM) and
fire management agencies use the indices
The most direct link between bushfires to assess fire risk and issue warnings. The
and climate change comes from the FFDI was originally designed on a scale from
long-term trend towards a hotter climate. 0 to 100, with 50 to 100 being categorised as
Climate change is now making hot days Extreme. After the unprecedented ferocity of
hotter, and heatwaves longer and more the 2009 Black Saturday bushfires in Victoria
frequent (Section 2). This has implications and “off the scale” readings, the ratings
for bushfire weather. For example, the 2009 were revised to Severe (50-75), Extreme
Black Saturday fires in Victoria (Figure 10) (75-100), and a new category for conditions
were preceded by a decade-long drought exceeding the existing scale: Catastrophic
with a string of record hot years, coupled (100 +) (known as Code Red in Victoria). Fire
with a severe heatwave in the preceding authorities now warn that on Catastrophic
week. The weather conditions on 7 February days, even well-prepared homes may not be
broke temperature records, with maximum saveable, and people can lose their lives.
temperatures up to 23°C above the February
average in Victoria and record high In 2019, New South Wales and Queensland
temperatures for February set in over 87 had an early and devastating start to the
percent of the state (BoM 2009a; BoM 2009b). bushfire season with hot temperatures
Over this period, the Forest Fire Danger throughout the year making many districts
Index (FFDI) ranged from 120 to 190, the primed for serious bushfire risk. In 2019,
highest values ever recorded (Karoly 2009). New South Wales had its warmest January
to August period on record with an overall
In Australia, the Forest Fire Danger Index mean temperature 1.85°C above average.
(FFDI) and Grass Fire Danger Index (GFDI) Australia as a whole had its warmest such
are used to measure the degree of risk of period on record for maximum (daytime)
bush and grass fires (Luke and Macarthur temperature (1.71°C above average) and wasCHAPTER 04 22
BUSHFIRES
second-warmest for mean temperature Maximum temperature deciles for the
(1.30°C above average, behind 2016). January to August period from 2017 to 2019
Maximum temperatures on the 5th and 6th are shown in Figure 11, with virtually the
September were more than 10°C above whole of the Murray–Darling Basin showing
average in some areas (BoM 2019g). The warmest on record. These high temperatures
serious fire danger weather in September contribute to higher values of the drought
2019 included northern areas of the Murray– factor and lower values of relative humidity,
Darling Basin; for the Basin as a whole, the as well as directly raising FFDI, which
four overall warmest January to August increases with temperature (BoM 2019h).
periods on record since 1910, in order, have
been in 2019, 2016, 2018, and 2017.
Figure 11: Map of the Murray–Darling Basin (black outline) showing the mean maximum temperature deciles for the period
January to August in 2017, 2018, and 2019 (based on all years since 1910). Source: BoM 2019h.
MEAN MAXIMUM TEMPERATURE DECILES
1 JANUARY 2017 TO 31 AUGUST 2019
Temperature decile ranges
Highest on record
10 Very much above average
8-9 Above average
4-7 Average
2-3 Below average
1 Very much below average
Lowest on Record23 DANGEROUS SUMMER:
ESCALATING BUSHFIRE, HEAT AND DROUGHT RISK
LOW RAINFALL dryness factors for fuels. Rainfall for January
to August 2019 was lowest on record in the
Declining cool season rainfall has had a Southern Downs (Queensland) and Northern
significant impact on increasing bushfire Tablelands (New South Wales). For example,
risk. Since the mid-1990s, mainland Tenterfield and Stanthorpe were each more
southeast Australia has experienced a 15 than 20 percent below their previous record
percent decline in late autumn and early low January–August rainfall, and 77 percent
winter rainfall and a 25 percent decline in below the long-term average. (BoM 2019h).
average rainfall in April and May. Climate
change is influencing this drying trend. The soils were also very dry. The top 100 cm
of the soil profile was below average to driest
The 2019/20 bushfire season in New South on record for the first week of September
Wales and southeast Queensland had 2019 over most of southeast Queensland
an early and devastating start in August and northeast New South Wales. The low soil
2019. From 9 August, bushfire risk in moisture is symptomatic of both the recent
parts of northeast New South Wales and intense dry conditions, as well as longer-term
southeast Queensland was exacerbated below average rainfall since 2017. Low soil
by below-average rainfall on a range of moisture means high stress in vegetation and
timescales from months to years, leading to fuels that might not normally burn, making
a prolonged, severe drought and very high them more prone to bushfires (BoM 2019h).
Fuelled by a long and deepening drought,
Figure 12: Drought exacerbates New South Wales bushfires in
more than 100 fires burned in forest and
September 2019. Strong winds fanned the flames and carried
smoke more than 100 kilometres. Source: NASA 2019. bush areas in southeast Queensland and
northeast New South Wales, including
some areas of subtropical rainforest
and wet eucalyptus forests that do not
often experience fire, let alone intense
fire (NASA 2019; Figure 12). The drought
makes vegetation more flammable, and
therefore more likely to support extreme fire
behaviour. It also makes vegetation more
susceptible to spot fires ahead of the main
fires when weather conditions deteriorate
(high temperatures, low relative humidity,
strong winds).CHAPTER 04 24
BUSHFIRES
INCREASED IGNITION SOURCES LENGTHENING SEASONS
It is likely that the potential for lightning- Since the 1970s, there has been an increase
ignited bushfires will increase in the in extreme fire weather and a lengthening of
future, as lightning is expected to occur fire seasons across large parts of Australia,
more frequently under warmer conditions particularly in southern and eastern
(Williams, 2005; Romps et al. 2014; regions, due to increases in extreme hot
Abatzoglou et al., 2016). There is a strong days and to the cool season drying trend.
positive association between temperatures The lengthening seasons are reducing
and fire occurrence in the southern opportunities for fuel reduction burning
hemisphere, with a tight coupling between (Matthews et al. 2012; Ximenes et al. 2017)
lightning-ignited fire occurrences and the and increasing the resource needs of
upward trend in the Southern Annular Mode firefighting services.
(Mariani et al. 2018).
Resource sharing arrangements are
Fires ignited by lightning can be difficult to becoming increasingly challenging as
suppress as they often occur in inaccessible climate change causes the overlap of fire
remote areas. Lightning storms also often seasons in states and territories within
result in multiple simultaneous ignitions. Australia, and in the northern and southern
In 2016, thousands of dry lightning strikes hemispheres. As a result, governments are
caused multiple intense bushfires in becoming constrained in their ability to
Tasmania, burning over 120,000 hectares, share resources and deal with larger, more
including nearly 20,000 hectares in the destructive bushfires.
Tasmanian Wilderness World Heritage Area
(Styger et al 2018; Earl et al 2019).
The likelihood of sustained ignition of
vegetation following a lightning strike
is largely dependent on fuel moisture
content (Dowdy, 2015). Continuing rainfall
deficiencies, hotter temperatures, increased
evaporation and drought all increase the
likelihood of drier fuels and the likelihood of
increased lightning ignitions.You can also read