Data visualization library - Deliverable D4.2 - Cultural-E
←
→
Page content transcription
If your browser does not render page correctly, please read the page content below

Ref. Ares(2021)3011524 - 05/05/2021

           Climate and cultural based design and market valuable
                technology solutions for Plus Energy Houses

             Data visualization library
                            Deliverable D4.2

  Dissemination Level: Public
  Lead Partner: EURAC
  Due date: Month 18
  Type of deliverable: Other
  Status: Final version

Published in the framework of:
Cultural-E - Climate and cultural based design and market valuable technology
solutions for Plus Energy Houses

            This project has received funding from the European Union’s Horizon 2020
            research and innovation programme under grant agreement No 870072
Deliverable n. D4.2
                                                             Data visualization library

Authors:
Francesca Avella, Eurac
Manuel Mauro, Eurac

Contributors:
Annamaria Belleri, Eurac

Revision and history chart:
 Version      Date            Editors                       Comment
                                           First draft created and sent to the reviewer
 0.1                       Francesca
           25.02.2021                      (first draft included the descriptive part of
                           Avella
                                           the deliverable).

                           Abed Al         First draft reviewed and sent back to
 0.2       02.03.2021
                           Waheed Hawila   deliverable leader.

                      Francesca            Integration of comments from the reviewer
 0.3       05.03.2021 Avella               and creation of the Python script.
                      Manuel Mauro         Documents sent to the second reviewer.

                                           Review of the descriptive part of the
 0.4       15.03.2021 Eleni Goni
                                           deliverable.

                      Francesca
 0.5       01.04.2021 Avella               Integration of comments from the reviewer.
                      Manuel Mauro

                           Francesca
 0.6       05.05.2021                      Delivery of the data visualisation library.
                           Avella

Disclaimer:
The project has received funding from the European Union’s Horizon 2020 research and
innovation program under grant agreement No 870072.
The content of this report does not reflect the official opinion of the European Union.
Responsibility for the information and views expressed therein lies entirely with the
author(s).

                                                                                         2
Deliverable n. D4.2
                                                                                           Data visualization library

Table of contents

1    Executive summary .................................................................................................5
2    Introduction ..............................................................................................................7
    2.1    Main settings of the data visualisation library ...................................................7
    2.2    How to use the tool ...........................................................................................9
    2.3    Summary of the process ................................................................................. 11
3    Input....................................................................................................................... 13
    3.1    General data of the building ........................................................................... 13
    3.2    Thermal zones ................................................................................................ 14
    3.3    Building envelope ........................................................................................... 17
     3.3.1        Opaque envelope components ................................................................ 17
     3.3.2        Glazed envelope components.................................................................. 18
    3.4    Climate Data ................................................................................................... 20
     3.4.1        Dry Bulb temperature ............................................................................... 20
     3.4.2        Global Horizontal Irradiance .................................................................... 21
     3.4.3        Relative humidity...................................................................................... 22
4    Output .................................................................................................................... 23
    4.1    Energy Output ................................................................................................ 23
     4.1.1        Monthly energy balance for a single zone ................................................ 23
     4.1.2        Annual energy balance for all zones ........................................................ 26
     4.1.3        Monthly energy consumption ................................................................... 28
     4.1.4        Self-consumption and Self-sufficiency ..................................................... 29
     4.1.5        Cumulative ideal loads Heating Rate ....................................................... 30
     4.1.6        Cumulative ideal loads Cooling Rate ....................................................... 31
    4.2    Comfort Output ............................................................................................... 32
     4.2.1        Thermal comfort ....................................................................................... 32
     4.2.2        Indoor air quality ...................................................................................... 34
     4.2.3        Visual comfort .......................................................................................... 38
5    Conclusion ............................................................................................................. 39

                                                                                                                                  3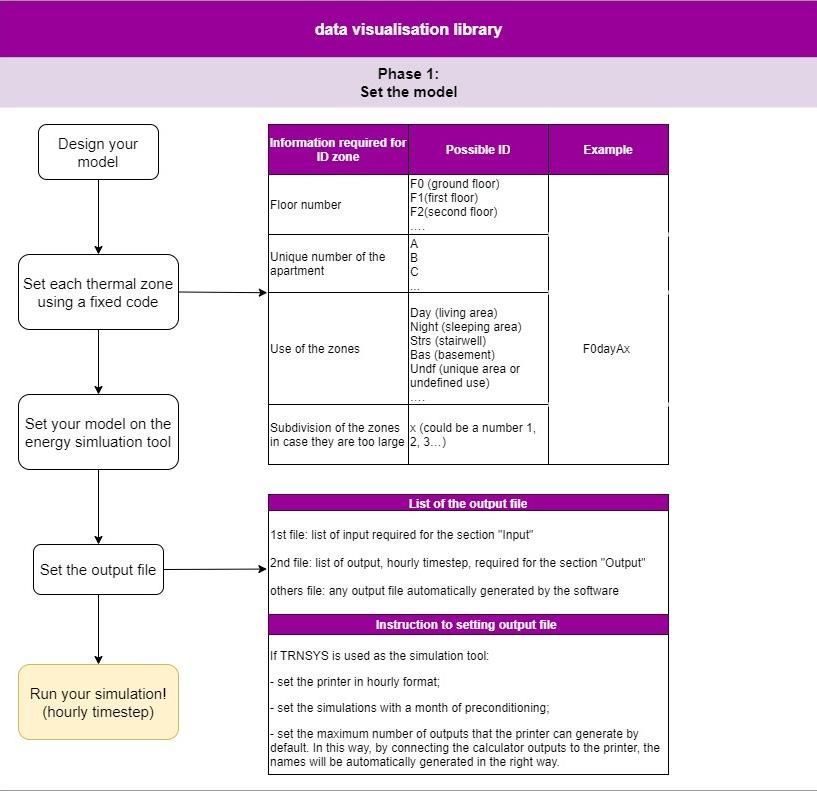
Deliverable n. D4.2
                                                                                    Data visualization library

List of figures

FIGURE 1 EXPLANATION OF THE FIRST PHASE OF THE WHOLE PROCESS OF THE DATA
VISUALIZATION PROCESS ................................................................................................. 11
FIGURE 2 EXPLANATION OF THE SECOND PHASE OF THE WHOLE PROCESS OF THE DATA
VISUALISATION PROCESS ................................................................................................ 12
FIGURE 3 3D MODEL OF THE BUILDING.............................................................................. 13
FIGURE 4 HEATING SETPOINT SCHEDULE APPLIED IN THE SIMULATIONS. .............................. 16
FIGURE 5 COOLING SETPOINT SCHEDULE APPLIED IN THE SIMULATIONS. ............................. 16
FIGURE 6 OCCUPANCY SCHEDULE APPLIED IN THE SIMULATIONS. ....................................... 16
FIGURE 7 LIGHTING SCHEDULE APPLIED IN THE SIMULATIONS. ............................................ 16
FIGURE 8 APPLIANCES SCHEDULE APPLIED IN THE SIMULATIONS......................................... 16

List of tables

TABLE 1 EXAMPLE OF OUTPUT CARD. .................................................................................6
TABLE 2: INFORMATION REQUIRED TO FILL IN THE ID ZONE...................................................7
TABLE 3 GENERAL BUILDING INPUTS ................................................................................ 13
TABLE 4 THERMAL ZONE INPUTS ...................................................................................... 14
TABLE 5 INTERNAL GAINS ................................................................................................ 15
TABLE 6 OPAQUE ENVELOPE INPUTS ................................................................................ 17
TABLE 7 GLAZED ENVELOPE INPUTS. ............................................................................... 18
TABLE 8 VENTILATION STRATEGY .................................................................................... 19
TABLE 9 SHADING STRATEGY. ......................................................................................... 19

                                                                                                                        4
Deliverable n. D4.2
                                                                         Data visualization library

1 Executive summary
One of the objectives of the Cultural-E project is the development of data post-
processing and visualization methodologies for simulation aided design.

Supporting designers in the early stages of designing Plus Energy Buildings, in fact, is
strategic to ensure load reduction while still considering the household practices and
enhancing the indoor environmental quality. To achieve this target, it is necessary to
make use of effective building energy modelling with a clear view of the simulation
results, thus allowing effective communication between the design team and the
involved disciplines/stakeholders.

As a first step, a survey was disseminated among European designers1. It aimed to
identify the performance indicators that are meaningful to designers and stakeholders,
also trying to identify which aspects of building performance evaluation need to be
investigated the most.
The main findings of the investigation in terms of performance indicators highlight that
the annual final energy consumption is the most preferred energy indicator, possibly
because it portrays an overall picture of the total consumption by the end users. Among
the indicators of indoor environmental quality, indoor temperature related aspects (the
number of overheating hours and the number of comfort hours without any energy input)
are considered the most important. With regards to the field of renewable energy,
designers care more about the percentage share of renewable energy sources over total
energy use, rather than the ability of the building to match its own load by on-site
generation while contributing to the needs of the local grids. Finally, the received
feedback indicates that more attention is paid to the energy aspects of the building,
giving less importance to the indoor air quality and comfort in terms of daylighting level.
Based on the feedback received from targeted questions, informative data visualization
charts and ready-made scripting, have been defined.

Data visualizations are automated by a script that generates interactive charts and
produces an output report with clear interpretation keys starting from basic hourly output
data series (air temperature, operative temperature, heating/cooling demand etc.); The
tool makes use of a standard structure for data science projects, that aims at correctness
and reproducibility. The results are multiple and comprise: an installable Python library,
Jupyter notebooks and HTML reports, data clean-up scripts for the standard input data,
and an effective development environment.
A Jupyter Notebook is an industry standard for data analysis and visualization, and as
described on the home page of the project:

1For more information on the main findings of the data visualization library survey, please refers to the
article “How to support the design of Plus Energy Buildings: survey results” in the 2 nd newsletter of the
Cultural-E project. https://www.cultural-e.eu/design-pebs-survey-results/

                                                                                                        5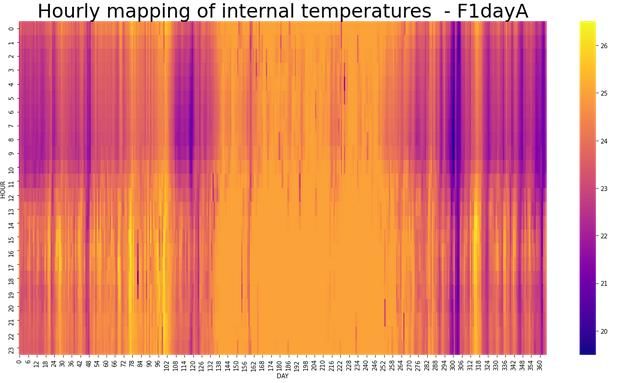
Deliverable n. D4.2
                                                                      Data visualization library

“The Jupyter Notebook is an open-source web application that allows you to create and share
documents that contain live code, equations, visualizations and narrative text. Uses include: data
cleaning and transformation, numerical simulation, statistical modelling, data visualization, machine
learning, and much more.”

The report is mainly composed by two core sections:
The first one, called Input, is related to the introduction of the inputs needed for setting
up and understanding the model. This part is also organized to offer a complete overview
of the model with detailed specifications of building components and systems. Standard
input data sets include meaningful summary visualization on climate data, building
geometry (Area, S/V, WWR etc.), internal gains, solar gains, building construction (U-
value, thermal mass etc.) and glazing system properties (U-value, g-value etc.),
infiltration and ventilation losses etc.
The second section, called Output, has been organized in two parts presenting the main
results deriving from the building performance simulations in terms of energy and
comfort.
With the aim to standardize as much as possible the way to present the output, the
sections have been organized in "cards" which summarize their most important aspects.
In Table 1 you can find an example of a “card”.
Table 1 Example of output card.

  Information required                                        Data
 Output                           Presentation of the output shown by the graph in the final
                                  unit of measurement
 Output format                    Graphic format in which the results are presented (for
                                  example hourly, monthly, annual, etc.)
 Input needed                     Input lists necessary for the creation of the graph:
                                  Complete input name             Input ID
 Input source                     Output file, deriving from the simulation, that contains all
                                  the inputs or outputs necessary for the presentation of the
                                  result
 File format                      The file format required for the output file (it can be
                                  required: .epw, .out, .BAL). In case of other format, it is
                                  necessary to change this information directly in the script
                                  code.
 Script                           Script that generates the chart
                                                 Chart

 Description of the graph Standard description of the chart
 Interpretation of results Interpretations deriving from the results analysis

                                                                                                   6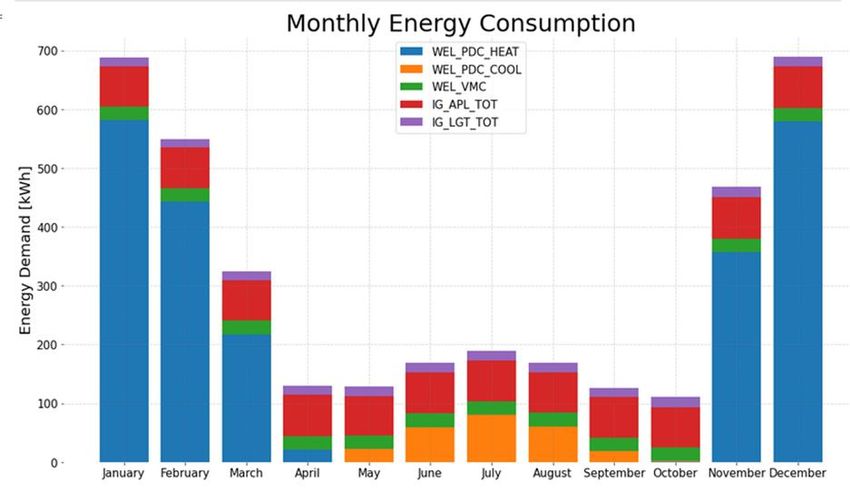
Deliverable n. D4.2
                                                                    Data visualization library

At the end of the compilation of the report, the designer can have clear indications of
the performance of his building. Thanks to the standardized and automated aspect of
the library, it will be possible not only to simplify the building analysis process but also
to carry out comparative assessments between multiple buildings, making this process
more streamlined.

2 Introduction
The aim of the data visualization library is to collect custom and ready-made scripting
for simulation input report and output post-processing. The data visualization should
also be easy to understand and provide the right level of information needed to design
PEB.

2.1    Main settings of the data visualisation library

In this perspective, to represent the simulation results as standardized as possible, the
first step is to set each thermal zone (during the design of the 3d model) using a fixed
code, as shown in Table 2 (it will be used also in association with the name of the
input/output).
Table 2: Information required to fill in the ID zone.

 Information required for ID                     Possible ID                Example
            zone
 Floor number                          F0 (ground floor)
                                       F1 (first floor)
                                       F2 (second floor)
                                       ….
 Use of the zones                      Day (living area)
                                       Night (sleeping area)
                                       Strs (stairwell)
                                                                    F0dayAx (as an example,
                                       Bas (basement)
                                                                      you will find this code
                                       Undf (unique area or
                                                                      always in the report)
                                       undefined use)
                                       ….
 Unique number of the                  A
 apartment                             B
                                       C
                                       …
 Subdivision of the zones              x (could be a number 1, 2,
 in case they are too large            3…)

                                                                                                7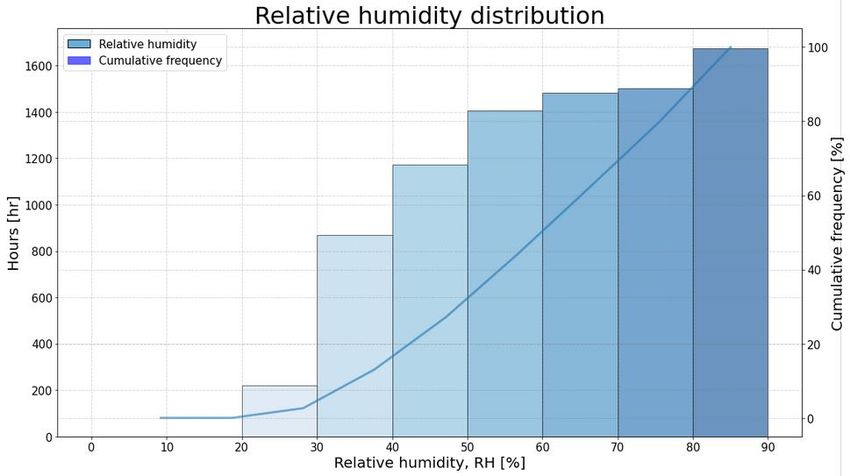
Deliverable n. D4.2
                                                                       Data visualization library

Once the model has been set on the simulation software, it is time to set the output files
that will be used in the data visualization library to generate input and output results.
To avoid the possibility of running into errors resulting from the use of an excessive
number of output files, it is required to reduce their amount. It is advisable to set only
two output files deriving from the simulation2:

    -   The first output file will include all the inputs required for the first section of the
        report, called Input. To set the inputs in an automated way, it is suggested to print
        them as “output” of the model. How to rename the input, is indicated in Table 3,
        Error! Reference source not found., Error! Reference source not found.,
        Table 6, Error! Reference source not found., Error! Reference source not
        found., Table 9. Please note that each input will be preceded by [IN] and not all
        of them have their own ID as it is only needed for the results that will be generated
        automatically.
    -   The second output file will contain all the output in hourly timestep, necessary to
        create the related graphs in the section Output. In addition to this single output
        file, those produced automatically by the simulator are also considered3.
        If TRNSYS4 is used as the simulation tool, it is necessary to set the printer in
        hourly format, with a month of preconditioning and by setting the maximum
        number of outputs that the printer can generate by default. In this way, by
        connecting the calculator outputs to the printer, the names will be automatically
        generated in the right way.

During the compilation of the data visualization library, you will be asked to manually
enter some parts, and some will be automatically generated by the script.
To standardize the library as much as possible, the person responsible for the simulation
is asked to set the simulation with a timestep of one hour, so in a second moment the
script can use it to generate the graphs in the necessary output format (hourly, monthly,
annual). Also, the data visualization library will perform most of the calculations outside
the simulation software using the script (for example, calculations related to the
conversion of units of measurement).
Thanks to the data visualization library, it is possible to generate all the graphs for the
total number of thermal zones that may sometimes be useless for your purpose. For this
reason, it is advisable to focus only on the thermal zones that are worth investigating.
Of course, feel free to focus on all your model.

2 Please note that the generated output files must have the first row corresponding to the ID and
subsequent rows containing the values.
The first column always corresponds to the timestep.
3 Please note that you cannot control the name of the outputs generated automatically by the simulation

tool so, they will not contain the thermal zone code.
4 http://www.trnsys.com/

                                                                                                     8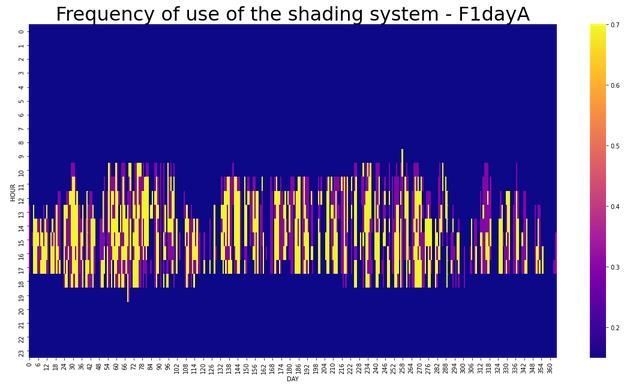
Deliverable n. D4.2
                                                               Data visualization library

2.2   How to use the tool

As previously mentioned, the tool makes use of a standard structure for data science
projects, that aims at correctness and reproducibility. The results are multiple and
comprise: an installable Python library, data clean-up scripts for the standard input data,
and an effective development environment.
For more information, please refer to the homepage of the project on which this work is
based: Cookiecutter Data Science.

The tool is available at this link: https://github.com/EURAC-EEBgroup/CULTURAL-E-
Data-Visualization-Library

The tool requires Python version 3.5 or above, thus you need to install it on your
machine together with its package manager pip, then you can proceed to the installation
of the requirements in requirements.txt with:

pip install -r requirements.txt

Consider using a virtualenv before doing this (strongly recommended).

The /data/raw folder contains some example data from a simulation respecting the
naming conventions. This is where you will have to move your simulation’s output files.
Once you added your files to the folder head to the /src/data/make_dataset.py script
and adapt it to the names of the new files if different. You can clean-up the data, and
have it ready for the analysis, by running the following command in a terminal:

make data

Finally, head to the /notebooks folder and open the file 1.0-report.ipynb in your Jupyter
Notebook editor. Running this notebook will output a standardized set of graphs
describing the main results of the simulation in the data folder.

Feel free to modify the notebook at your convenience to tailor the analysis to your needs.

                                                                                         9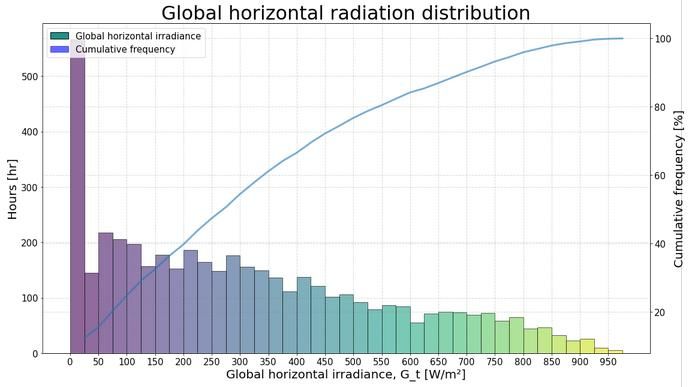
Deliverable n. D4.2
Data visualization library

                       10
Deliverable n. D4.2
Data visualization library
2.3 Summary of the process
Figure 1 and Figure 2 show a summary of the process related to using the data
visualization library.
Please note that more detailed information is contained in the previous paragraphs.
FIGURE 1 EXPLANATION OF THE FIRST PHASE OF THE WHOLE PROCESS OF THE DATA VISUALIZATION PROCESS
11Deliverable n. D4.2
Data visualization library
FIGURE 2 EXPLANATION OF THE SECOND PHASE OF THE WHOLE PROCESS OF THE DATA VISUALISATION PROCESS
12Deliverable n. D4.2
Data visualization library
3 Input
[Please enter with a picture of the 3d model].
FIGURE 3 3D MODEL OF THE BUILDING
[please enter manually a brief description of the model, considering that more detailed
information will be entered in the following sections]
3.1 General data of the building
Please enter the following general information related to the building.
Table 3 General building inputs
Information required ID Data
Type of building - [please enter manually]
Location - [please enter manually]
Gross floor area [m2] IN_GFA [automatically generated]
Net floor area [m2] IN_NIA [automatically generated]
S/V ratio IN_SV [automatically generated]
No. of floor - [please enter manually]
Number of thermal zones - [please enter manually]
Photovoltaic system - [please enter manually
Yes/No]
PV capacity [kWp] IN_PV_kWp [automatically generated]
13Deliverable n. D4.2
Data visualization library
PV area [m2] IN_A_PV [automatically generated]
Battery capacity [kWh] IN_PV_bat [automatically generated]
Technology installed - [please enter manually]
Position [façade or roof] - [please enter manually]
Tilt angle [°] IN_PV_Tilt [automatically generated]
Azimuth [°] - [please enter manually
with the value and the
reference.
E.g., Azimuth=90° where:
Nord=0°, East=90°,
South=180°, West=270°]
Space for additional - [please enter manually]
information/system
3.2 Thermal zones
Please fill in this table for the information related to the thermal zones. This information
must be provided for each thermal zone.
Table 4 Thermal zone inputs
Information required ID Data
Thermal zone - [please enter manually]
Main exposure - [please enter manually]
Floor area [m2] IN_A_F0dayAx [automatically generated]
Volume [m3] IN_V_F0dayAx [automatically generated]
Glazed area [m2] IN_WinA_F0dayAx [automatically generated]
WWR [%] IN_WWR_F0dayAx [automatically generated]
Presence of ceiling fan - [please enter manually]
(yes/no)
People density [pers/m²] - [please enter manually the
reference]
Lighting density [W/m²] - [please enter manually the
reference]
Electric equipment [W/m²] - [please enter manually the
reference]
Heating setpoint - [please enter manually the
temperature [°C] reference]
Heating system limited or - [please enter manually if
unlimited limited or unlimited]
14Deliverable n. D4.2
Data visualization library
Heating system power (in IN_QHEAT_F0dayAx [automatically generated]
case of limited) [kW]
Cooling setpoint - [please enter manually the
temperature [°C] reference]
Cooling system (limited or - [automatically generated]
unlimited)
Cooling system power (in IN_QCOOL_F0dayAx [automatically generated]
case of limited) [kW]
Natural ventilation rates - [please refer to Error!
[ACH] Reference source not
found.]
Infiltration rates [ACH] - [please enter manually the
reference]
Mechanical ventilation - [please enter manually]
typology
(centralized/decentralized)
Mechanical ventilation - [please enter manually the
[ACH] reference]
Heat recovery efficiency - [please enter manually the
[%] reference]
HVAC system - [please enter manually]
Space for additional - [please enter manually]
information/system
Please fill in this table with the general information required on the internal gains.
Table 5 Internal gains
Information required ID Data
Convective fraction of IN_IG_CONVPER [automatically generated]
sensible heat gains from
persons.
Convective fraction of IN_IG_CONVAPL [automatically generated]
sensible heat gains from
electric equipment.
Convective fraction of IN_IG_CONVLGT [automatically generated]
sensible heat gains from
lighting.
Sensible heat gain per IN_IG_PER_S1 [automatically generated]
person (active) [W/pers]
Sensible heat gain per IN_IG_PER_S0 [automatically generated]
person (sleeping) [W/pers]
15Deliverable n. D4.2
Data visualization library
Latent heat gain per IN_IG_LATPER_S1 [automatically generated]
person (active) [kg/s/pers]
Latent heat gain per IN_IG_LATPER_S0 [automatically generated]
person (sleeping)
[kg/s/pers]
Appliances consumption IN_IG_APL_S1 [automatically generated]
(in use) [W/m²]
Appliances consumption IN_IG_APL_S0 [automatically generated]
(standby) [W/m²]
Lighting consumption IN_IG_LGT [automatically generated]
[W/m²]
Space for additional - [please enter manually]
information/system
[Please enter manually the heating setpoint schedule chart if you think it might be
interesting].
FIGURE 4 HEATING SETPOINT SCHEDULE APPLIED IN THE SIMULATIONS.
[Please enter manually the cooling setpoint schedule chart if you think it might be
interesting].
FIGURE 5 COOLING SETPOINT SCHEDULE APPLIED IN THE SIMULATIONS.
[Please enter manually the occupancy schedule chart if you think it might be
interesting].
FIGURE 6 OCCUPANCY SCHEDULE APPLIED IN THE SIMULATIONS.
[Please enter manually the lighting schedule chart if you think it might be
interesting].
FIGURE 7 LIGHTING SCHEDULE APPLIED IN THE SIMULATIONS.
[Please enter manually the appliances schedule chart if you think it might be
interesting].
FIGURE 8 APPLIANCES SCHEDULE APPLIED IN THE SIMULATIONS.
16Deliverable n. D4.2
Data visualization library
3.3 Building envelope
3.3.1 Opaque envelope components
Please fill in the following table with the information related to the opaque envelope
components. Please enter manually the entire table except for the section “U-value
[W/m²K]” which will be generated automatically.
Table 6 Opaque envelope inputs
Density Thermal
BuildingLayer Thickne Thermal
ss Conductivity [kg/m3] Capacity U-value [W/m²K]
element (I – O) [m] [W/mK] [J/kgK]
1.
[automatically
External 2.
generated]
wall 3.
IN_U_EXT_WALL
…
1.
[automatically
Adjacent 2.
generated]
wall 3.
IN_U_ADJ_WALL
…
1.
[automatically
Boundary 2.
generated]
wall 3.
IN_U_BND_WALL
…
1.
[automatically
2.
Roof generated]
3.
IN_U_ROOF
…
1.
Ceiling/ [automatically
2.
Interior generated]
3.
floor IN_U_FLOOR
…
1.
[automatically
Ground 2.
generated]
floor 3.
IN_U_GDFLOOR
…
[please enter
Space for additional information/system
manually]
17Deliverable n. D4.2
Data visualization library
3.3.2 Glazed envelope components
For each thermal zone, please fill in the following tables with the information related to
the glazed envelope components. In addition, if there are different windows in your
thermal zone, please fill in for each window typology.5
Table 7 Glazed envelope inputs.
Information required ID Data
Reference thermal zone - [please enter manually]
[ID]
Typology and layer - [please enter manually]
description
Orientation - [please enter manually]
Manual or automated - [please enter manually]
windows
If automated windows - [please enter the strategy]
Window area [m2] IN_WinAx_F0dayAx [automatically generated]
Ug [W/m²K] IN_Ugx_F0dayAx [automatically generated]
G-value IN_Gx_value_F0dayAx [automatically generated]
Uf [W/m²K] IN_Ux_F0dayAx [automatically generated]
Frame dimensions [m x m] - [please enter manually]
Space for additional - [please enter manually]
information
Information required ID Data
Presence of shading - [please enter manually]
(yes/no)
Typology of shading - [please enter manually]
Application of shading - [please enter manually]
(external or internal)
Slat angle - [please enter manually]
Solar reflectance IN_SRIx_F0dayAx [automatically generated]
Manual or automated - [please enter manually]
shading
5Please note that in Error! Reference source not found., Error! Reference source not found., Table
9, the symbol [x] near the first part of the ID (e.g., IN_WinAx, IN_WIN_OFx, IN_SHDx etc.) indicates the
number of that specific window (e.g., IN_WinA01, IN_WIN_OF01, IN_SHD01 etc.), in case you are
considering different windows in your thermal zone.
18Deliverable n. D4.2
Data visualization library
Additional shading - [please enter manually]
elements (balcony…)
Space for additional - [please enter manually]
information
For automated windows, please enter the table with the strategy.
Table 8 Ventilation strategy
Opening factor Natural
No.
Signal/parameter Logic function (0-close, ventilation rates
strategy
1-open) [ACH]
[please enter [please enter
manually] manually]
IN_WIN_OFx_F IN_WIN_OFx_A
1 [please enter [please enter
0dayAx CH_F0dayAx
manually] manually]
[please enter [please enter
manually] manually]
No. [please enter [please enter IN_WIN_OFx_F IN_WIN_OFx_
manually] manually] 0dayAx ACH_F0dayAx
For automated shadings, please enter the table with the strategy.
Table 9 Shading strategy.
No. Shading factor
Signal/parameter Logic function
strategy (0-open, 1-close)
[please enter manually] [please enter manually]
1 [please enter manually] [please enter manually] IN_SHDx_F0dayAx
[please enter manually] [please enter manually]
No. [please enter manually] [please enter manually] IN_SHDx_F0dayAx
19Deliverable n. D4.2
Data visualization library
3.4 Climate Data
The weather conditions of a location play an important role in the energy performance
of a building. In the next subsections, some results in terms of outdoor air temperature,
global horizontal irradiance, and relative humidity, are presented.
3.4.1 Dry Bulb temperature
Information required Data
Output Dry Bulb temperature distribution [C°]
Output format Hourly
Input needed Dry Bulb temperature [C°] Dry Bulb temperature
Input source Weather file
File format .epw
Script [automatically generated]
Description of the graph Hourly dry-bulb temperature distribution and the cumulative
frequency of a standard year.
Interpretation of results [Please enter manually this field]
20Deliverable n. D4.2
Data visualization library
3.4.2 Global Horizontal Irradiance
Information required Data
Output Global horizontal radiation distribution
Output format Hourly
Input needed Global horizontal radiation Global horizontal radiation
[W/m2]
Input source Weather file
File format .epw
Script [automatically generated]
Description of the graph Hourly global horizontal radiation distributions and the
cumulative frequency of a standard year.
Interpretation of results [Please enter manually this field]
21Deliverable n. D4.2
Data visualization library
3.4.3 Relative humidity
Information required Data
Output Relative humidity distribution
Output format Hourly
Input needed Relative humidity [%] Relative humidity
Input source Weather file
File format .epw
Script [automatically generated]
Description of the graph Hourly relative humidity distribution of a standard year
Interpretation of results [Please enter manually this field]
22Deliverable n. D4.2
Data visualization library
4 Output
This section presents the main results in terms of energy and comfort necessary to
evaluate the performance of the building. As mentioned in the introduction, all the
significant graphs have been organized by card.
4.1 Energy Output
This section shows the main results in terms of energy balance of the building, energy
consumption considering the total energy use of the house and overall heating load
considering an ideal heating and/or cooling system. It also gives information on the use
of renewable energy in case a photovoltaic system has been installed in the building.
4.1.1 Monthly energy balance for a single zone
It generates as many graphs as the number of thermal zones.
Information required Data
Output Monthly energy balance of the thermal zone [kWh]
Output format Monthly
Input needed *in this case the first number of the ID indicates the zone (it
is not possible to set the standard index for the thermal
zone because it is an automatic output of the software).
Power of ideal heating [kJ/h] 1_B4_QHEAT-
Power of ideal cooling [kJ/h] 1_B4_QCOOL+
Infiltration gains [kJ/h] 1_B4_QINF+
Ventilation gains [kJ/h] 1_B4_QVENT+
Coupling gains [kJ/h] 1B4_QCOUP+
Transmission into the wall 1_B4_QTRANS+
from inner surface node
[kJ/h]
Internal gains 1_B4_QGINT+
(convective+radiative) [kJ/h]
Wall gains [kJ/h] 1_B4_QWGAIN+
Absorbed solar gains on all 1_B4_QSOL+
inside surface of zone [kJ/h]
Convective energy gain of 1_B4_QSOLAIR+
zone due transmitted solar
radiation through external
windows which is
transformed immediately
into a con. heat flow to
internal air [kJ/h]
23Deliverable n. D4.2
Data visualization library
Input source Energy_zone.BAL
File format .BAL
Script [automatically generated]
24Deliverable n. D4.2
Data visualization library
25Deliverable n. D4.2
Data visualization library
Description of the graph Monthly energy balance of each thermal zone. The heat
balance of the building consists of all sources and sinks of
energy inside a building and the energy flows through its
envelope. It should be always close to 0 since the building
is losing as much heat as it gains.
Interpretation of results [Please enter manually this field]
4.1.2 Annual energy balance for all zones
Information required Data
Output Thermal balance split for all zones [kWh]
Output format Annual
Input needed *in this case the first number of the ID indicates the zone (it
is not possible to set the standard index for the thermal
zone because it is an automatic output of the software).
Power of ideal heating [kJ] =+QHEAT
Power of ideal cooling [kJ] =-QCOOL
Infiltration gains [kJ] =+QINF
Ventilation gains [kJ] =+QVENT
Coupling gains [kJ] =+QCOUPL
Transmission into the wall =+QTRANS
from inner surface node [kJ]
Internal gains =+QGAININT
(convective+radiative) [kJ]
Wall gains [kJ] =+QWGAIN
Absorbed solar gains on all =+QSOLGAIN
inside surface of zone [kJ]
Convective energy gain of =+QSOLAIR
zone due to transmitted
solar radiation through
external windows which is
transformed immediately
into a con. heat flow to
internal air [kJ]
Input source SUMMARY.BAL
File format .BAL
Script [automatically generated]
26Deliverable n. D4.2
Data visualization library
Description of the graph Annual thermal balance split for all zones. The heat
balance of the building consists of all sources and sinks of
energy inside a building and the energy flows through its
envelope. It should be always close to 0 since the building
is losing as much heat as it gains.
Interpretation of results [Please enter manually this field]
27Deliverable n. D4.2
Data visualization library
4.1.3 Monthly energy consumption
Information required Data
Output Monthly energy consumption estimation considering the
total energy use of the house. [kWh]
Output format Monthly
Input needed Main power products for each type of end-use. Example:
Heating power [kJ/h] QHEAT_TOT
Cooling power [kJ/h] QCOOL_TOT
Ventilation power [kJ/h] QVMC_TOT
Lighting power [kJ/h] QLGT_TOT
Appliances power [kJ/h] QAPL_TOT
[Space for additional [Space for additional
information] information]
Input source Simulation output file
File format .out
Script [automatically generated]
Description of the graph Monthly building energy consumption
Interpretation of results [Please enter manually this field]
28Deliverable n. D4.2
Data visualization library
4.1.4 Self-consumption and Self-sufficiency
Information required Data
Output Percentage of renewable energy [%]
Output format Monthly
Input needed Whole building electricity [W] QEL_TOT
PV self-consumption [W] PV_selfC
PV production [W] PV_P
Input source Simulation output file
File format .out
Script [automatically generated]
Description of the graph Self-consumption and self-sufficiency indictors. While the
self-consumption is the share of the total produced
electricity that is self-consumed by the building owner, self-
sufficiency represent the share of the building electric
demand, covered by electricity that is produced by PV and
self-consumed.
Interpretation of results [Please enter manually this field]
29Deliverable n. D4.2
Data visualization library
4.1.5 Cumulative ideal loads Heating Rate
Information required Data
Output Power of total ideal heating (sum of power of ideal heating
of all zones) [kW]
Output format Hourly
Input needed *in this case the number 1 is auotmaically generated by the
simuation tool.
Heating demand [kJ/h] SQHEAT_1
Input source Simulation output file
File format .out
Script [automatically generated]
Description of the graph Cumulative curve of the heating power of the entire
building. The heating system is modelled as an ideal
system with infinite heating capacity that supplies
conditioned air to the zone meeting all the load
requirements and consuming no energy. This allows to
calculate overall heating load.
Interpretation of results [Please enter manually this field]
30Deliverable n. D4.2
Data visualization library
4.1.6 Cumulative ideal loads Cooling Rate
Information required Data
Output Power of total ideal cooling (sum of power of ideal cooling
of all zones) [kW]
Output format Monthly
Input needed *in this case the number 1 is auotmaically generated by the
simuation tool.
Cooling demand [kJ/h] SQCOOL_1
Input source Simulation output file
Source format .out
Script [automatically generated]
Description of the graph Cumulative curve of the cooling power of the entire
building. The cooling system is modelled as an ideal
system with infinite cooling capacity that supplies
conditioned air to the zone meeting all the load
requirements and consuming no energy. This allows to
calculate overall heating load.
Interpretation of results [Please enter manually this field]
31Deliverable n. D4.2
Data visualization library
4.2 Comfort Output
This section has been organized to show the main results in terms of thermal comfort,
visual comfort and IAQ. For each group of output, you will be asked to enter the results
for each thermal zone. If you think it is useful to assess the comfort in only some areas
of the building or only in one, enter the results only for those useful for your evaluation.
4.2.1 Thermal comfort
4.2.1.1 Mean indoor temperature
Information required Data
ID zone [Please enter manually this field]
Output Indoor temperature mapping [C°]
Output format Hourly
Input needed Indoor air temperature [C°] TAIR_ F0dayAx
Input source Simulation output file
File format .out
Script [automatically generated]
Description of the graph Hourly mapping of internal temperatures. It could be useful
to know any areas of thermal discomfort.
Interpretation of results [Please enter manually this field]
32Deliverable n. D4.2
Data visualization library
4.2.1.2 Psychrometric graph
Information required Data
ID zone [Please enter manually this field]
Output Distribution of the simulated/monitored indoor temperature
and relative humidity on the psychrometric graph.
Output format Hourly
Input needed Dry bulb temperature [C°] Dry bulb temperature
Relative humidity [%] Relative humidity
Indoor air temperature of the TAIR_F0dayAx
zone [C°]
Relative humidity of the RELHUM_F0dayAx
zone [kg/kg]
Input source Simulation output file
File format .out
Script [automatically generated]
Description of the graph The graph illustrates the distribution of simulated indoor
temperature and relative humidity with respect to the two
internal thermal condition comfort zones, one for the
summer season (in light yellow) and one for the winter
season (in light blue). The graph also highlights the outdoor
temperature and humidity limits for which the application of
some passive control systems can ensure summer comfort
conditions without applying air conditioning systems.
Interpretation of results [Please enter manually this field]
33Deliverable n. D4.2
Data visualization library
4.2.2 Indoor air quality
In order to assess the air quality of the building during the occupied time, considering
the occupants as one of the main pollution sources, the level of the CO 2 concentration
generated by the occupants, need to be calculated. The limits for indoor CO2
concentrations leading to the four IAQ categories have been calculated in accordance
with the standard EN 16798-1: 20196.
4.2.2.1 IAQ categories for non-adapted persons
Information required Data
Output Percentage of time in which CO2 ppm concentration within
occupied time is in the four categories for each thermal
zone [%]
Output format Annual
Input needed *fill in the follow rows with the CO2 concentration for all your
thermal zones
CO2 ppm concentration CO2_F0dayAx
within occupied time in the
living area [ppm]
CO2 ppm concentration CO2_F0nightAx
within occupied time in the
sleeping area [ppm]
[Space for additional [Space for additional
information] information]
Input source Simulation output file
File format .out
Script [automatically generated]
6 EN 16798-1, Energy Performance of Buildings - Ventilation for Buildings - Part 1: Indoor Environmental
Input Parameters for Design and Assessment of Energy Performance of Buildings Addressing Indoor Air
Quality, Thermal Environment, Lighting and Acoustic, 2019.
34Deliverable n. D4.2
Data visualization library
Description of the graph Comparison of the zones in terms of indoor air quality. The
graph indicates the percentage of hours in which the CO2
concentration is in the four categories in accordance with
EN 16798-1: 2019.
Interpretation of results [Please enter manually this field]
4.2.2.2 Indoor relative humidity categories (EN 16798-1: 2019)
Another necessary parameter to evaluate the internal comfort of a building is the indoor
relative humidity. This is important because high or low percentages lead to humid or
dry environment, respectively, which has a direct effect on human well-being. An
effective way to evaluate this data is to classify the number of hours in which the relative
humidity of a thermal zone falls within the categories for humidification and
dehumidification, identified in standard EN 16798-1: 2019.
Information required Data
Output Percentage of time in which indoor relative humidity within
occupied time is in the four categories for each thermal
zone [%].
Output format Annual
Input needed *fill in the following rows with the % of relative humidity for
all your thermal zones
Relative humidity for the RELHUM_F0dayAx
living area [%]
Relative humidity for the RELHUM_F0nightAx
sleeping area [%]
35Deliverable n. D4.2
Data visualization library
schedule occupancy for the
living area
schedule occupancy for the
sleeping area
[Space for additional [Space for additional
information] information]
Input source Simulation output file
File format .out
Script [automatically generated]
Description of the graph Number of hours within occupied time, when indoor relative
humidity of the thermal zones, is within the categories for
humidification and dehumidification, identified in standard
EN 16798-1: 2019.
Interpretation of results [Please enter manually this field]
36Deliverable n. D4.2
Data visualization library
4.2.2.3 Natural ventilation
The frequency of opening the windows can be considered an interesting indicator in the
evaluation of some aspects related to the performance of a building. Thanks to these
parameters it is possible to evaluate, for example, whether the action of natural
ventilation alone can guarantee an acceptable level of internal comfort, whether it affects
the energy consumption of the building as well as giving indications on how the
occupants interact with the building.
Information required Data
ID zone [Please enter manually this field]
Output Number of hours in which the windows are opened
Output format Hourly
Input needed Window opening factor WIN_OF_F0dayAx
Input source Simulation output file
File format .out
Script [automatically generated]
Description of the graph Numbers of hours in which natural ventilation is used.
Interpretation of results [Please enter manually this field]
37Deliverable n. D4.2
Data visualization library
4.2.3 Visual comfort
4.2.3.1 Activation of the shadings
Please fill in this table for the significant thermal zone.
Information required Data
ID zone [Please enter manually this field]
Output Number of hours in which the shadings are activated
Output format Hourly
Input needed Window shading factor SHD_F0dayAx
Input source Simulation output file
File format .out
Script [automatically generated]
Description of the graph Numbers of hours in which the shadings are used.
Interpretation of results [Please enter manually this field]
38Deliverable n. D4.2
Data visualization library
5 Conclusion
In this deliverable a data visualization library has been developed. The aim of this library
is to collect custom and ready-made scripting for simulation input report and output post-
processing, providing the right level of information needed to address design phase of
PEB buildings.
A set of scripts elaborates basic hourly output data series (output from an energy
simulation software) to generate interactive charts and a report with clear interpretation
keys tailored to PEB. Scripts are grouped into an installable Python library, which is
complemented by Jupyter notebooks, HTML template reports, data clean-up scripts for
parsing input data.
The report is composed of two main sections: in the first section, the user will enter all
the inputs needed to set the model in a proper way and the second part will generate all
the meaningful graphs necessary to evaluate the building performance.
By the standardized report, the designer can get a brief overview on PEB building, then
review specifications of the components, systems, boundary conditions and in-depth
performance assessment.
The library can operate directly on specific input and output file, generated by TRNSYS
energy simulation tool, and thus formatted accordingly. TRNSYS energy simulation tool
is one of most popular software available for this purpose, but alternative software
exists. Designers may decide to use different software tools, and in this case a proper
software interface should be developed to adapt file format.
Also, some of the settings presented in the first part of the report are specific to TRNSYS
energy simulation tool, but equivalent can be found in alternative software.
Further developments may be:
- To calculate and render PEB KPIs (key performance indicators), currently being
defined in D4.1.
- To improve standardization in the report.
- To add automation and ergonomics to the tool.
- To optimize charts.
39You can also read