Dating tectonic activity in the Lepontine Dome and Rhone-Simplon Fault regions through hydrothermal monazite-(Ce) - Solid Earth
←
→
Page content transcription
If your browser does not render page correctly, please read the page content below
Solid Earth, 11, 199–222, 2020
https://doi.org/10.5194/se-11-199-2020
© Author(s) 2020. This work is distributed under
the Creative Commons Attribution 4.0 License.

Dating tectonic activity in the Lepontine Dome and Rhone-Simplon
Fault regions through hydrothermal monazite-(Ce)
Christian A. Bergemann1,2,a , Edwin Gnos1 , Alfons Berger3 , Emilie Janots4 , and Martin J. Whitehouse5
1 Natural  History Museum of Geneva, Geneva, Switzerland
2 Department    of Earth Sciences, University of Geneva, Geneva, Switzerland
3 Institute of Geological Sciences, University of Bern, Bern, Switzerland
4 ISTerre, University of Grenoble, Grenoble, France
5 Swedish Museum of Natural History, Stockholm, Sweden
a currently at: Institute of Earth Sciences, Heidelberg University, Heidelberg, Germany

Correspondence: Christian A. Bergemann (christian.bergemann@unige.ch)

Received: 21 January 2019 – Discussion started: 5 February 2019
Revised: 10 January 2020 – Accepted: 20 January 2020 – Published: 21 February 2020

Abstract. Zoned hydrothermal monazite-(Ce) from Alpine-           data suggest that hydrothermal monazite-(Ce) dating may al-
type fissures and clefts is used to gain new insights into        low us to identify areas of slow exhumation or cooling rates
the tectonic history of the Lepontine Dome in the Cen-            during ongoing tectonic activity.
tral Alps and the timing of deformation along the Rhone-
Simplon Fault zone on the dome’s western end. Hydrother-
mal monazites-(Ce) (re)crystallization ages directly date de-
formation that induces changes in physicochemical condi-          1   Introduction
tions of the fissure or cleft fluid. A total of 480 secondary
ion mass spectrometry (SIMS) spot analyses from 20 individ-       Metamorphic domes often experience a multiphase tectono-
ual crystals, including co-type material of the monazite-(Nd)     metamorphic evolution (e.g., Schmid et al., 2004; Steck et
type locality, record ages for the time of ∼ 19 to 2.7 Ma, with   al., 2013). For the Lepontine Dome of the European Alps,
individual grains recording age ranges of 2 to 7.5 Myr. The       this evolution is an interplay between exhumation and defor-
combination of these age data with geometric considerations       mation during doming and motion along large fault systems
and spatial distribution across the Lepontine region gives a      that dominate the western regions of the dome. Although
more precise young exhumation history for the area. At the        much of the retrograde orogenic evolution of the area is well
northeastern and southwestern edges of the Lepontine Dome,        known (e.g., Hurford, 1986; Mancktelow, 1992; Steck and
units underwent hydrothermal monazite-(Ce) growth at 19–          Hunziker, 1994; Mullis et al.,1994; Wiederkehr et al., 2009;
12.5 and 16.5–10.5 Ma, respectively, while crystallization of     Campani et al., 2010; Haertel et al., 2013; Steck et al., 2013),
monazite-(Ce) in the eastern Lepontine Dome started later, at     hydrothermal monazite-(Ce) ages may complement existing
15–10 Ma. Fissure monazite-(Ce) along the western limit of        cooling ages of thermochronometers by providing crystal-
the dome reports younger ages of 13–7 Ma. A younger age           lization and dissolution–precipitation ages that directly date
group around 8–5 Ma is limited to fissures and clefts asso-       low-temperature (T ) tectonic activity.
ciated with the Simplon normal fault and related strike-slip         Monazite, a light rare-earth-element (LREE) mineral with
faults such as the Rhone Fault. The data set shows that the       composition (LREE, Th, U)PO4 , is considered an excellent
monazite-(Ce) age record directly links the fluid-induced in-     mineral for the dating of geologic processes (e.g., Parrish,
teraction between fissure mineral and host rock to the Lepon-     1990). It is highly resistant to radiation damage (e.g., Mel-
tine Dome’s evolution in space and time. A comparison be-         drum et al., 1998, 1999, 2000) and shows negligible Pb
tween hydrothermal monazite-(Ce) and thermochronometric           loss by diffusion (Cherniak et al., 2004; Cherniak and
                                                                  Pyle, 2008). Nonetheless, monazite may record ages after

Published by Copernicus Publications on behalf of the European Geosciences Union.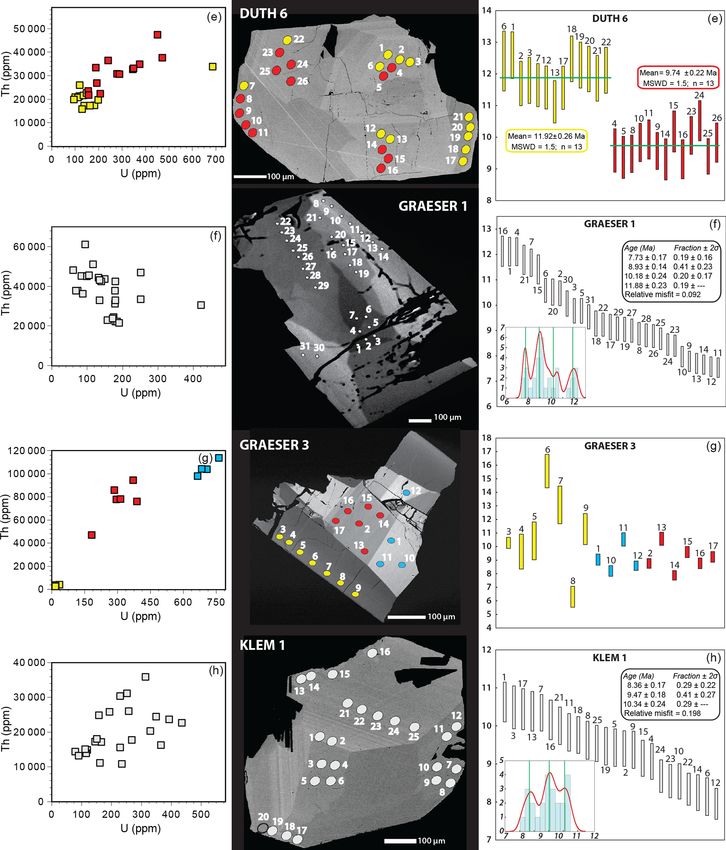
200                                  C. A. Bergemann et al.: Dating tectonic activity through hydrothermal monazite-(Ce)

its initial crystallization, as it can experience dissolution–     rock accessible to the fluid is disturbed, a new cycle of dis-
reprecipitation or recrystallization facilitated by hydrous flu-   solution and crystallization within the cleft occurs. Quartz
ids (e.g., Seydoux-Guillaume et al., 2012; Janots et al., 2012;    fluid inclusion studies show that its growth is not continuous
Grand’Homme et al., 2016).                                         (thus not due to a continuous temperature drop) but stepwise
   Fissures and clefts, occasionally containing hydrother-         (e.g., Mullis, 1996). Independent of the initial fluid, it has
mal monazite-(Ce), represent voids partially filled with crys-     a strongly rock-buffered composition. This is, for example,
tals that precipitated on the fissure walls from hydrous flu-      expressed by matching stable oxygen values of hydrothermal
ids during late-stage metamorphism (Mullis et al., 1994;           quartz and quartz from the host rock (e.g., Sharp et al., 2005),
Mullis, 1996). Dating such mineralization is often difficult       implying a low fluid-to-rock ratio and minimal fluid flow.
due to later overprinting during multiple stages of fluid ac-      Moreover, the composition of the fissure-filling fluid changes
tivity (Purdy and Stalder, 1973). Fissures and clefts in some      systematically according to the maximal metamorphic grade
metasediments and metagranitoids have long been known              reached during regional metamorphism (e.g., Rauchenstein-
to contain well-developed monazite-(Ce) crystals (Niggli et        Martinek et al., 2016). This indicates that the initial fissure
al., 1940), but it is only recently that some of these were        fluid is sourced from the surrounding country rock instead
dated (e.g., Gasquet et al., 2010; Janots et al., 2012). While     of large-scale fluid flow. Thus, chemical disequilibration is
other minerals like micas and adularia are common in alpine        generally triggered by tectonic activity, causing a deforma-
fissures, these are often affected by overpressure or ex-          tion of the fissure or cleft, and results in sudden changes in
cess argon (e.g., Purdy and Stalder, 1973). Another issue          the P –T conditions, the influx or loss of fluid, or the ex-
is that it is not always clear whether these ages represent        posure of previously unaltered wall rock (e.g., Mullis et al.,
(re)crystallization or cooling through system closure to dif-      1994; Rolland et al., 2003; Sharp et al., 2005). While fluids
fusion (e.g., Rauchenstein-Martinek, 2014). In contrast, hy-       released during dehydrating mineral reactions play an impor-
drothermal monazite-(Ce) dates new crystallization or re-          tant role during prograde burial and metamorphism, the type
crystallization but provides only a very general idea of the       of cleft sampled in the context of this study forms under ret-
temperature. The fissures and clefts in the Lepontine region       rograde conditions (e.g., Mullis et al., 1994; Mullis, 1996;
formed after the metamorphic peak, in the context of exten-        Sharp et al., 2005; Rauchenstein-Martinek et al., 2016). The
sional tectonic activity. Accordingly, fissures and clefts are     fissure or cleft remains fluid filled and behaves for consider-
oriented roughly perpendicular to the lineation and foliation      able parts of its history as a closed system (e.g., Sharp et al.,
of the host rock. The fluid that intruded during fissure forma-    2005). This was deduced from the fluid volumes required for
tion (< ca. 450 ◦ C; Mullis et al., 1994; Mullis, 1996) inter-     the precipitation of the encountered hydrothermal minerals
acted with the wall rock, triggering dissolution and precipi-      being too large. This issue necessitates a recycling of an en-
tation of minerals in both host rock and fissure, marked by        trapped fluid in multiple dissolution–precipitation cycles that
a porous alteration halo in the surrounding wall rock. Com-        would need to be triggered by deformation of the system, so
plex growth domains are common in hydrothermal monazite-           that small volumes of fluid suffice for the (re)precipitation of
(Ce) from such fissures showing both dissolution and sec-          large mineral volumes. Most likely a complete reopening of
ondary growth (e.g., Janots et al., 2012; Bergemann et al.,        the system only happens at a relatively late stage when all
2017, 2018), as well as dissolution–reprecipitation reactions      country rocks become brittle, independent of their mineral
resulting in patchy grains (e.g., Gnos et al., 2015). In con-      composition, or in association with steeply oriented shear
trast to metamorphic rocks, where newly formed monazite-           and fault zones that create a pathway for penetration of me-
(Ce) rarely exceeds 100 µm, fissure monazite-(Ce) is com-          teoric water (e.g., Sharp et al., 2005; Bergemann et al., 2018)
monly millimeters in size, containing large individual growth      or for fluids from depth (e.g., Janots et al., 2019). The pene-
domains. This enables precise dating of individual domains         tration of meteoric water into a fissure will typically lead to
using secondary ion mass spectrometry (SIMS). Thereby al-          a dilution of the fissure fluid and an end of monazite crystal-
lowing researchers to resolve growth duration and identify         lization. This means that while an age in an individual crystal
single events and phases of tectonic activity (e.g., Janots et     might, in rare cases, record fluid flow unassociated with de-
al., 2012; Berger et al., 2013; Bergemann et al., 2017, 2018,      formation, previous studies suggest that this is not the norm
2019b).                                                            (Berger et al., 2013; Grand’Homme et al., 2016; Bergemann
   The formation of hydrothermal monazite-(Ce) within an           et al., 2017, 2018, 2019b; Ricchi et al., 2019). Consequently,
open fissure or cleft depends on the chemical composition of       individual ages found in one crystal of an area have therefore
the aqueous fluid filling it. Following the initial formation of   an uncertainty in what they date; deformation is most likely
a fissure or cleft, the intruding fluid (< ca. 450 ◦ C; Mullis     dated if several crystals of an area record the same age.
et al., 1994; Mullis, 1996) leaches and partly dissolves the          The mechanisms of (partial) dissolution and precipitation
surrounding host rock, leading to crystallization of mineral       of newly formed cleft minerals occur repeatedly, resulting
phases on the fissure or cleft wall until a chemical equilib-      in the strong zonation, alteration, and dissolution features of
rium is reached. If the resulting chemical equilibrium be-         most cleft minerals (e.g., Mullis, 1996; Sharp et al., 2005;
tween fluid phase, cleft minerals, and those parts of the wall     Heijboer, 2006). Thus, the mineral association of a cleft is

Solid Earth, 11, 199–222, 2020                                                               www.solid-earth.net/11/199/2020/
C. A. Bergemann et al.: Dating tectonic activity through hydrothermal monazite-(Ce)                                                  201

Figure 1. Map of the Lepontine Dome, modified from Steck et al. (2013) and Schmid et al. (2004). Colored areas mark the areal division in
the context of this study. The 500 ◦ C isograd was taken from Todd and Engi (1997) and Wiederkehr et al. (2008), and the albite–oligoclase
mineral zone boundary was taken from Beard (1958). Section A–A0 is shown in Fig. 6.

the result of a series of disequilibrations, and it does not rep-      along mineral inclusion interfaces, cracks, and microcracks
resent a mineral paragenesis. This means that each crystal             (Fig. 2a, b; Grand’Homme et al., 2018). Due to these pro-
or crystal part formed due to a disequilibration of the sys-           cesses, also internal parts of a crystal may be altered and in
tem, and it was, after its formation, in chemical equilibrium          some cases even result in young core and old rim ages, pos-
with the surrounding fluid. Therefore, each primary chemi-             sibly due to the interior grain parts being in stronger dise-
cal zone within a crystal represents a change in the cleft fluid       quilibrium with the surrounding fluid. These processes may
chemical composition.                                                  be active as long as conditions in the cleft stay within the
   Hydrothermal monazite-(Ce) typically crystallizes at tem-           monazite-(Ce) formation temperature window and stability
peratures below ∼ 350 or ∼ 300 ◦ C (Gnos et al., 2015;                 field and appear to be largely temperature independent within
Bergemann et al., 2017, 2018). Due to the continued pres-              this temperature window, with only slightly increasing re-
ence of fluid in the cleft, it continues to be able to record ages     action speeds with increasing temperature (Budzyn et al.,
down to at least 200 ◦ C and likely below (e.g., Townsend              2011). Therefore, several (re)crystallization or dissolution–
et al., 2000; Bergemann et al., 2017, 2018). During the                precipitation cycles may occur over the active lifetime of a
formation of a grain, any tectonic activity that changes               monazite-(Ce) crystal (e.g., Bergemann et al., 2018, 2019b).
the chemical equilibrium within a cleft causes the crys-               The dissolution–reprecipitation/recrystallization events com-
tal to develop a primary chemical zonation usually vis-                monly induce porosity and fractures in the monazite-(Ce)
ible in backscattered electron (BSE) images. After crys-               and catalyze later reactions by bringing an increased crys-
tallization, monazite-(Ce) shows practically no U–Th–Pb                tal volume into direct contact with the fluid (Putnis, 2002,
diffusion at the prevalent P –T conditions (Cherniak and               2009). This is observable in both primary monazite-(Ce) that
Pyle, 2008). However, the changing chemical conditions                 formed during the initial formation of the grain and sec-
in a hydrothermal environment may not only cause new                   ondary monazite-(Ce) that formed at a later time or due to
growth around an existing grain but also can result in partial         dissolution–reprecipitation/recrystallization. Possible signs
(re)crystallization/dissolution–reprecipitation in equilibrium         of these alteration processes recognizable in BSE images
with the cleft fluid (e.g., Janots et al., 2012; Bergemann et          are irregularly shaped (Fig. 2a, b) or weak (Fig. 2b) inter-
al., 2017; Grand’Homme et al., 2018). These dissolution–               nal zonation or cross-cutting by secondary zones (Fig. 5j,
reprecipitation processes may be initiated on any part of              k), as well as a high porosity (Fig. 2a, b; e.g., Gnos et al.,
the crystal in contact with the surrounding fluid. A self-             2015; Bergemann et al., 2017, 2018). Microscale alteration
sustaining reaction front propagates in this case into the min-        along cracks, inclusions, and porosity may produce altered
eral for as long as the interfacial fluid remains connected            areas within a crystal that cannot be recognized in BSE im-
to a fluid reservoir (e.g., Putnis, 2002, 2009). Alteration is         ages but yield a different age, as assumed for the crystal
therefore not limited to grain rims but commonly occurs                shown in Fig. 2c (Grand’Homme et al., 2018). Dissolution–

www.solid-earth.net/11/199/2020/                                                                      Solid Earth, 11, 199–222, 2020
202 C. A. Bergemann et al.: Dating tectonic activity through hydrothermal monazite-(Ce)
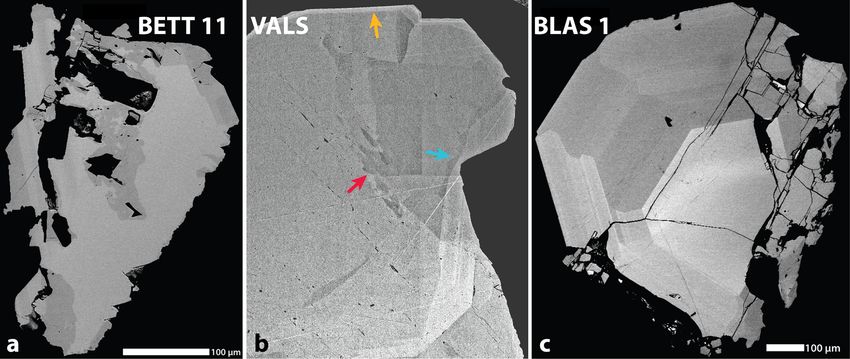
Figure 2. Backscattered electron (BSE) images of monazite-(Ce) samples showing different kinds of internal primary and alteration struc-
tures. (a) The dark grain areas of the grain, primarily located close to rims and inclusions, display sharp irregularly shaped borders and
porosity. These areas consist of secondary monazite that is ca. 2.5 Myr younger than the lighter grain parts (Fig. 5b). Panel (b) shows part of
a large grain with partially preserved sector-like zonation. Indications for alteration are irregularly shaped secondary zonation, both patchy
in the middle (red arrow) and wavy on the right side (blue arrow), as well as porosity and fractures. The light rim visible at the top (orange
arrow) likely represents a late overgrowth but yields some of the oldest ages of the grain, predating those of some of the interior grain parts
by several million years (Fig. 5t). The grain in (c) displays multiple rims combined with sector-like zonation around the core. Although the
grain shows practically no alteration features, the outer rim has the oldest and most homogeneous age pattern, with the central part possessing
a wider age range with some significantly younger ages (Fig. 5m, Table S1 in the Supplement). The youngest ages were found in part of the
inner rim surrounding the core, postdating all other ages measured in the second rim or center by several million years.
precipitation processes may sometimes largely preserve the parallel extension (e.g., Mancktelow, 1992; Ratschbacher et
chemical composition of an affected crystal part, possibly al., 1989, 1991).
due to only small pore fluid volumes involved in the reac- Early high-pressure (P ) metamorphism in the western
tion that did not equilibrate completely with the fluid sur- Alpine Sesia-Lanzo Zone during subduction below the
rounding the crystal; consequently, areas affected by alter- Southern Alps is dated to 75–65 Ma (e.g., Ruffet et al., 1997;
ation that possess different chemical compositions may have Rubatto et al., 1998; Regis et al., 2014). This was followed by
reprecipitated simultaneously (Grand’Homme et al., 2016; underthrusting and nappe stacking from ca. 42 Ma on, dur-
Bergemann et al., 2017, 2018). ing continental collision linked with a transition from high
The aim of this study is to illustrate that hydrothermal P and low T to Barrow-type metamorphism of medium-
monazite-(Ce) dating provides information about the tectonic grade conditions of ≥ 500 ◦ C in most of the Lepontine Dome
evolution of metamorphic domes and their surrounding areas (e.g., Köppel and Grünenfelder, 1975; Markley et al., 1998;
using the example of the Lepontine Dome. Herwartz et al., 2011; Boston et al., 2017). Peak metamor-
phic conditions were reached diachronously from south to
north around 30–19 Ma (e.g., Schärer et al., 1996). Barro-
vian metamorphism was followed by exhumation starting in
2 Geological setting the east and moving westward within the Lepontine Dome,
with vertical displacement along the Insubric Line starting
2.1 Evolution of the study area as early as 30 Ma (e.g., Hurford, 1986; Steck and Hunziker,
1994). Accelerated cooling due to exhumation below 500 ◦ C
The formation of the nappe stack of the European Alps, first occurred at ∼ 26 Ma in the central Lepontine Dome
caused by the collision of the European and Adriatic plates, (Hurford, 1986). This was followed in the eastern Lepontine
was followed by the development of several domes (Tauern Dome and along the Insubric Line between 22 and 17 Ma by
and Rechnitz in the Eastern Alps and Lepontine in the Cen- a period of rapid cooling (Steck and Hunziker, 1994; Rubatto
tral Alps; e.g., Schmid et al., 2004). Dome formation was et al., 2009), after which exhumation slowed down. The area
related to crustal shortening associated with coeval orogen-
Solid Earth, 11, 199–222, 2020 www.solid-earth.net/11/199/2020/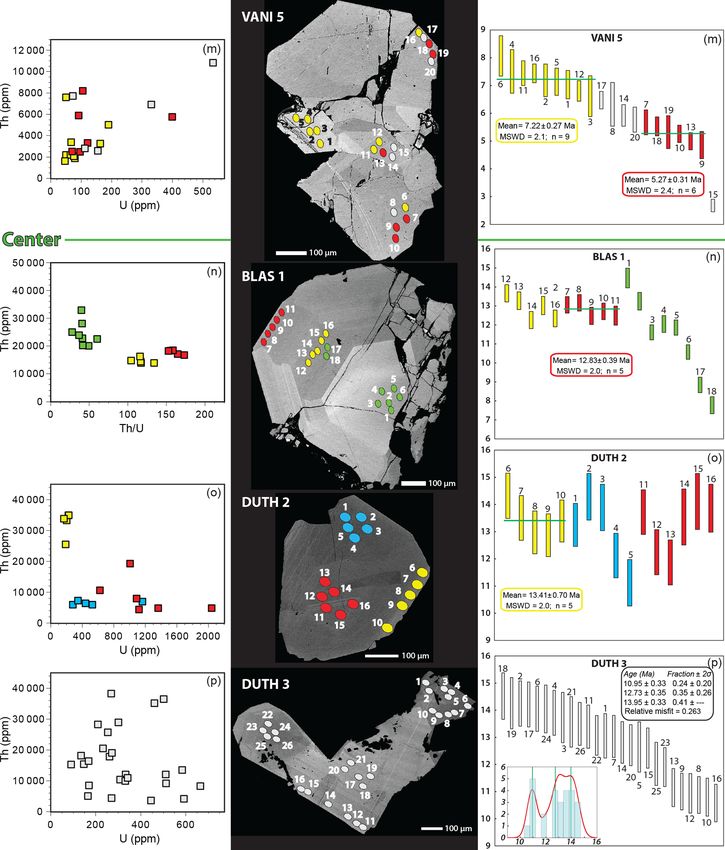
C. A. Bergemann et al.: Dating tectonic activity through hydrothermal monazite-(Ce)                                             203

to the west in the surroundings of the Rhone-Simplon Line            current of 3.5 nA. As the surface of the mounts needs to re-
experienced phases of accelerated cooling somewhat later at          main flat for ion-probe dating, element mapping that would
18–15 and 12–10 Ma (Campani et al., 2014).                           cause damage to the epoxy is not possible. SIMS spot mea-
   The western and southwestern margins of the study area            surements (Fig. 5) were taken according to visible domains
(Fig. 1) are dominated by the Rhone-Simplon Fault system,            in these images. As far as possible, spot measurements next
its extensions to the Rhine-Rhone Line to the north along            to cracks were avoided, as the Th–Pb isotope measurements
the Aar Massif, and the Centovalli Fault to the south. The           may be disturbed in such areas due to unevenness in the sam-
extensional Simplon Fault zone (SFZ) was active contem-              ple surface (Janots et al., 2012; Berger et al., 2013).
poraneously with thrusting in the external Alpine domain                Th–Pb analyses were conducted at the Swedish Mu-
(e.g., Grosjean et al., 2004), with the ductile–brittle transi-      seum of Natural History (Nordsim facility) on a CAMECA
tion of the SFZ constrained to the time between 14.5 and             ims1280 SIMS instrument. Analytical methods and correc-
10 Ma (Campani et al., 2010). Brittle deformation of the SFZ         tion procedures followed those described by Harrison et
and Centovalli Fault continued after this (Zwingmann and             al. (1995), Kirkland et al. (2009), and Janots et al. (2012),
Mancktelow, 2004; Surace et al., 2011), with the youngest            using a −13 kV O2− primary beam of ca. 6 nA and nom-
displacement activity dated to ca. 5–3 Ma (Campani et al.,           inal 15 µm diameter. The mass spectrometer was operated
2010).                                                               at +10 kV and a mass resolution of ca. 4300 (M/1M, at
                                                                     10 % peak height), with data collected in peak hopping mode
2.2    Study area                                                    using an ion-counting electron multiplier. Unknowns were
                                                                     calibrated against monazite-(Ce) standard 44069 (Aleinikoff
The study area comprises a part of the Lepontine Dome                et al., 2006). Lead isotope signals were corrected for com-
in which mineralized fissures and clefts commonly occur              mon Pb contribution using measured 204 Pb and an as-
(Fig. 1). It extends from the Tambo nappe, east of the For-          sumed present-day Pb isotope composition according to the
cola Fault, across the central Lepontine Dome to the Simplon         model of Stacey and Kramers (1975). The measurement of
Fault in the west and southwest, to the south of the Simplon         204 Pb is subject to an unresolvable molecular interference
Fault, and to the southern Gotthard Nappe to the north (see          by 232 Th143 Nd16 O++
                                                                                         2 , also affecting
                                                                                                             206 Pb and 207 Pb to a
Fig. 3 for the tectonic position of the samples). The 20 dated                                               16
                                                                     lesser degree through replacement of O by heavier O iso-
monazite-(Ce) samples were at the study outset divided into          topes, which may result in an overestimation of common
four areal groups that proved, with few adjustments, to be           Pb concentrations. A correction was applied whenever the
serviceable in the context of this work (Fig. 1). These are          232 Th143 Nd16 O++ signal at mass 203.5 exceeded the average
                                                                                     2
(1) the Adula nappe and the area to its east (East; 2 samples);      background signal on the ion-counting detector by 3 times
(2) the Lepontine Dome east of the Verzasca anticline, in-           its standard deviation. Age calculations use the decay con-
cluding part of the southern Gotthard Nappe (Center; 5 sam-          stants recommended by Steiger and Jäger (1977). The Th–
ples); (3) the Lepontine Dome west of the Verzasca anticline,        Pb ages were corrected for common Pb and doubly charged
including the southwestern Gotthard Nappe and bound by the           232 Th143 Nd16 O++ overlap, and they are reported with 2σ
                                                                                     2
Rhone-Simplon Fault (West; 12 samples); and (4) the area             uncertainties. Weighted mean age plots were done using Iso-
south of the Centovalli and southern Simplon faults (South;          plot v. 3.75 (Ludwig, 2012).
1 sample).

                                                                     4   Th–Pb monazite-(Ce) dating and age calculation
3     Analytical techniques
                                                                     The dating of hydrothermal monazite-(Ce) differs from ther-
Most of the samples were provided by mineral collectors,             mochronometers that possess a closure temperature insofar
as hydrothermal cleft monazite-(Ce) is uncommon and often            as a crystal may record several ages due to new crystalliza-
difficult to detect in the field when covered by dirt or chlorite.   tion or alteration of crystal parts. The grains directly record
Sample GRAESER 1 was provided by the Natural History                 tectonic activity instead of cooling through new crystalliza-
Museum of Basel (identification number NMBa 10226) and               tion or recrystallization, e.g., in the case of Ar–Ar dating
sample VALS was provided by the Natural History Museum               in white micas. Consequently, unless coupled with fluid in-
of Bern (identification number NMBE43124). The sampled               clusion analysis, a hydrothermal monazite-(Ce) age in itself
clefts are vertically oriented, except for those located in the      only provides a very general idea of fluid temperature con-
Gotthard Nappe where the sampled clefts are horizontal. See          ditions (ca. 350 ◦ C down to at least 200 ◦ C or somewhat be-
Table 1 for location details. Monazite-(Ce) samples were in-         low; Gnos et al., 2015; Bergemann et al., 2017, 2018) and
dividually polished to the level of a central cross section          more information on regional temperatures needs to come
across the grain and assembled in mounts of several grains.          from comparison with thermo(chrono)meters.
BSE images were obtained using a Zeiss DSM940A elec-                    The SIMS spot measurements were distributed on the ba-
tron microscope at the University of Geneva and a beam               sis of domains visible in BSE images, among these the cen-

www.solid-earth.net/11/199/2020/                                                                  Solid Earth, 11, 199–222, 2020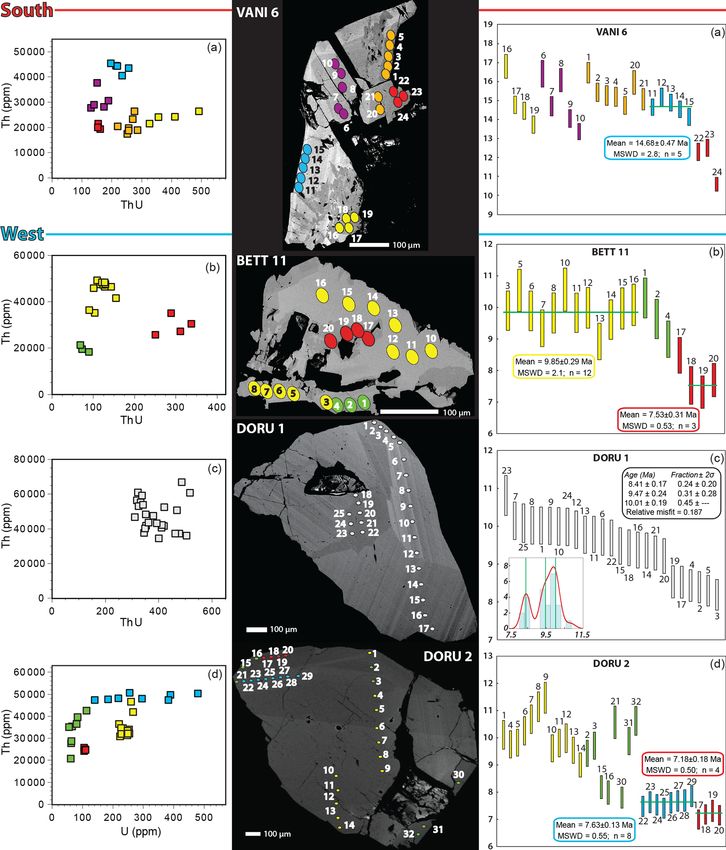
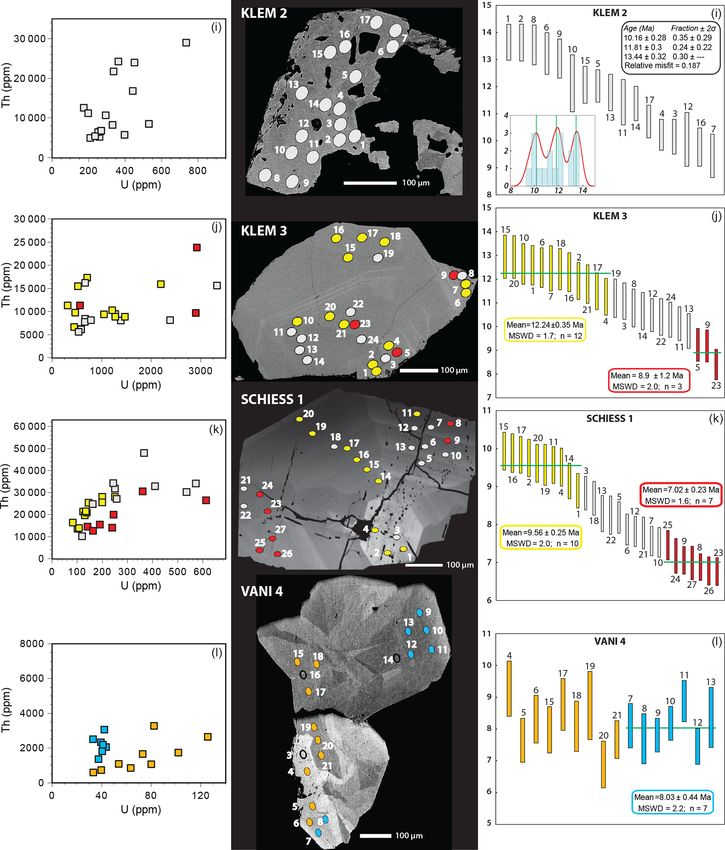
204                                    C. A. Bergemann et al.: Dating tectonic activity through hydrothermal monazite-(Ce)

Figure 3. Tectonic overview over the study area. (a) Tectonic sketch map modified after Schmid et al. (2004) and Steck et al. (2013);
(b) tectonic section over the Simplon Fault zone into the western Lepontine, based on Campani et al. (2014); (c) tectonic section through the
western Northern Steep Belt, modified and extended after Leu (1986); (d) tectonic section through the eastern Northern Steep Belt, redrawn
after Wiederkehr et al. (2008); (e) tectonic section across the Forcola normal fault; see also Meyre et al. (1998) and Berger et al. (2005).
Profiles (b)–(e) are not to scale with map (a). Section A–A0 is shown in Fig. 6.

ter and outer rims, if distinguishable, to capture the crystal-          termediate decay product of 238 U (Janots et al., 2012). Ac-
lization duration. In order to obtain more robust growth do-             cordingly, only 208 Pb/232 Th single or weighted mean ages
main ages, the selected domains were large enough to place               instead of concordia ages should be used in this case.
a minimum of three measurement spots. Only 208 Pb/232 Th                    Previous studies found no simple chemical criteria to iden-
ages were used, as the Th–Pb system is favorable in dat-                 tify altered zones and have shown that U–Th contents seem
ing hydrothermal monazite-(Ce) due to high Th/U ratios at                to be the easiest way to differentiate between zones, such as
low to very low U contents, which preclude the use of the                primary and often also secondary (e.g., Gnos et al., 2015;
207 Pb/235 U system. Additionally, the high Th/U ratios and              Bergemann et al., 2017). Figure 5 includes plots showing the
young age of the samples also exacerbate the uncorrectable               compositional variation used as a basis for domain age cal-
excess in 206 Pb due to the incorporation of 232 Th, an in-              culations. The derived spot ages were grouped together on

Solid Earth, 11, 199–222, 2020                                                                       www.solid-earth.net/11/199/2020/
C. A. Bergemann et al.: Dating tectonic activity through hydrothermal monazite-(Ce)                                               205

Table 1. Information on sample localities for all analyzed grains.

              Region     Sample          Locality                                    Latitude     Longitude   Altitude (m)
              South      VANI 6          Cava Maddalena, Beura                       46◦ 04.300   8◦ 17.710           260
              West       BETT 11         Bettelbach, Niederwald, Goms                46◦ 25.620   8◦ 11.700          1460
                         DORU1           Doru, Gantertal, Simplon                    46◦ 17.630   8◦ 02.070          1160
                         DORU2           Doru, Gantertal, Simplon                    46◦ 17.640   8◦ 02.070          1160
                         DUTH 6          Pizzo Rüscada, Valle di Prato (Lavizzara)   46◦ 24.570   8◦ 40.090          2420
                         GRAESER 1       Lärcheltini, Binntal                        46◦ 22.30    8◦ 14.90           1860
                         GRAESER 3       Wannigletscher, Cherbadung, Binntal         46◦ 19.50    8◦ 23.40           2560
                         GRAESER 4       Monte Giove, Val Formazza                   46◦ 21.90    8◦ 13.00           2720
                         KLEM 1          Grosses Arsch, Blinnental                   46◦ 26.710   8◦ 16.330          1900
                         KLEM 2          Alpe Devero, Val Antigorio                  46◦ 22.160   8◦ 18.440          2340
                         KLEM 3          Griessgletscher                             46◦ 26.590   8◦ 19.460          2840
                         SCHIESS 1       Schiessbach/Simplon                         46◦ 18.130   8◦ 04.180          1760
                         VANI 4          Montecrstese                                46◦ 09.600   8◦ 19.180           370
                         VANI 5          Crino Baceno                                46◦ 15.130   8◦ 19.140           710
              Center     BLAS 1          Piz Blas, Val Nalps, Sedrun                 46◦ 34.680   8◦ 43.980          2790
                         DUTH 2          Lago Scuro, Val Cadlimo                     46◦ 33.800   8◦ 41.500          2620
                         DUTH 3          Lago Retica, Lagi di Campo Blenio           46◦ 34.450   8◦ 53.570          2400
                         LUCO 1          Lucomagno                                   46◦ 33.790   8◦ 48.100          1915
                         SALZ 2          Piz Scai                                    46◦ 34.50    8◦ 45.80           2740
              East       TAMB 1          Pizzo Tambo, Splügen                        46◦ 30.480   9◦ 18.350          2460
                         VALS            Vals, Valsertal                             46◦ 37.30    9◦ 17.30           3150

the basis of spatial distribution across the sample according             Differing from other areas from which hydrothermal mon-
to zonation visible on BSE images and secondarily checked              azite was studied, large parts of the Lepontine Dome re-
for chemical composition representing crystal formation or             gion experienced multiple distinct deformation events and/or
replacement under different chemical conditions of a given             phases of prolonged small-scale tectonic activity, likely dur-
zone. Whenever age clusters were found on the basis of these           ing exhumation, which led to a far more complex data set
groups, weighted mean domain ages were calculated (Fig. 5),            than those obtained for other areas (e.g., Janots et al., 2012;
as these could be shown to generally date tectonic activ-              Berger et al., 2013; Grand’Homme et al., 2016; Berge-
ity (Berger et al., 2013; Grand’Homme et al., 2016; Berge-             mann et al., 2017, 2018, 2019b; Ricchi et al., 2019). Ex-
mann et al., 2017, 2018, 2019b; Ricchi et al., 2019). Since            periments have shown that a reason for the sometimes
any new crystallization or alteration associated with a change         large age scatter found in crystal domains affected by alter-
in chemical composition must have happened in equilibrium              ation may be an incomplete age resetting within a crystal
with the surrounding fluid, any age cluster within a chemical          part due to the survival of primary monazite nanoscale do-
group must be due to the simultaneous formation or alter-              mains (Grand’Homme et al., 2018). This may have caused
ation of those crystal parts. Therefore, two chemically dis-           the observed spread-out age patterns without age clusters
tinct groups that yield, within error, identical weighted mean         in zones visible in BSE, which impede the calculation of
ages still signify two distinct crystal formation or alteration        weighted mean ages (Fig. 5). Especially prolonged phases
events closely following each other. In areas that experienced         of low-intensity tectonic activity would presumably repeat-
strong and discrete tectonic events, usually in the vicinity of        edly cause small volumes of monazite-(Ce) to reprecipitate
shear zones, this approach often allows for the calculation of         during re-equilibration of the fluid chemistry. In those cases
domain ages for a majority of the analyzed spots from the              where no correlation between visible zonation and chem-
data set of a sample (e.g., Janots et al., 2012; Berger et al.,        istry (± ages) was found, the age data of a sample were
2013; Bergemann et al., 2017, 2019b; Ricchi et al., 2019).             submitted to an age deconvolution according to Sambridge
As only a finite number of analyses can be obtained for each           and Compston (1994) using the Isoplot 3.75 Unmix function
grain, some of the weighted mean ages may only combine                 (Ludwig, 2012) to identify the number of age-group com-
a small number of individual ages. This appears to be es-              ponents. Where this did not yield well-constrained results, a
pecially true for ages dating late-stage events (e.g., Berger          mean squared weighted deviation (MSWD) test was applied
et al., 2013; Grand’Homme et al., 2016; Bergemann et al.,              to calculate a weighted mean age for the youngest and oldest
2017, 2018).                                                           age groups within a grain, with the remaining ages in be-

www.solid-earth.net/11/199/2020/                                                                      Solid Earth, 11, 199–222, 2020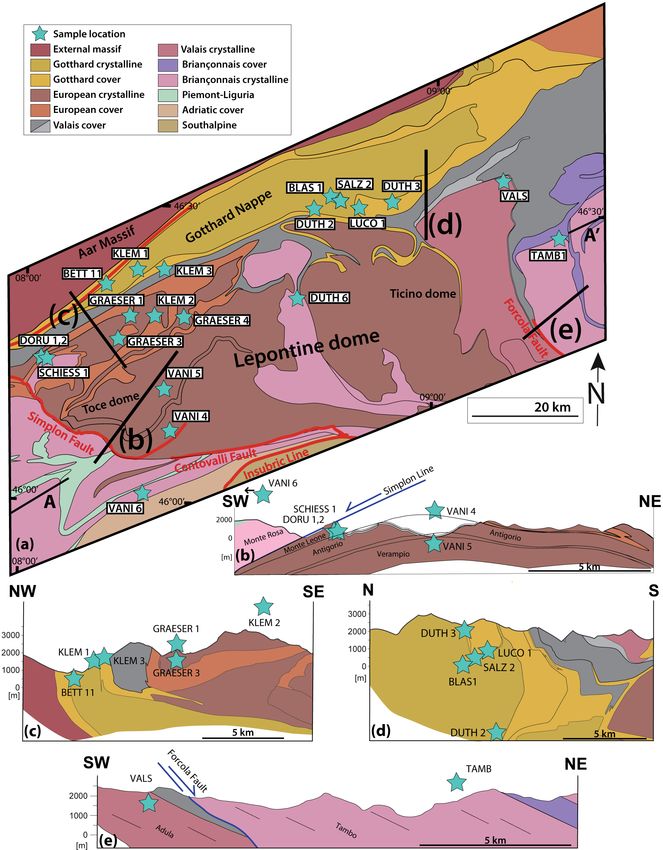
206 C. A. Bergemann et al.: Dating tectonic activity through hydrothermal monazite-(Ce)
Table 2. Overview list of the 232 Th–208 Pb age range and significant minimum and maximum ages obtained for each grain and weighted
mean domain ages that could be calculated for the samples.
Region Sample Figure No. of Spot age range min age max age Mean age MSWD No. of Fraction
analyses of sample (Ma) (Ma) (Ma) (Ma) points (unmixing)
South VANI 6 5a 24 16.80 ± 0.31–10.62 ± 0.18 16.80 ± 0.31 10.62 ± 0.18 14.68 ± 0.47 2.8 5
West BETT 11 5b 19 10.55 ± 0.33–7.34 ± 0.26 10.31 ± 0.31 like mean age 9.85 ± 0.29 2.1 12
7.53 ± 0.31 0.53 3
DORU 1 5c 25 10.82 ± 0.26–8.21 ± 0.20 like mean age like mean age 10.01 ± 0.19 0.45 ± −
9.47 ± 0.24 0.31 ± 0.28
8.41 ± 0.17 0.24 ± 0.20
DORU 2 5d 32 11.48 ± 0.28–7.02 ± 0.18 11.48 ± 0.28 like mean age 7.63 ± 0.13 0.55 8
7.18 ± 0.18 0.50 4
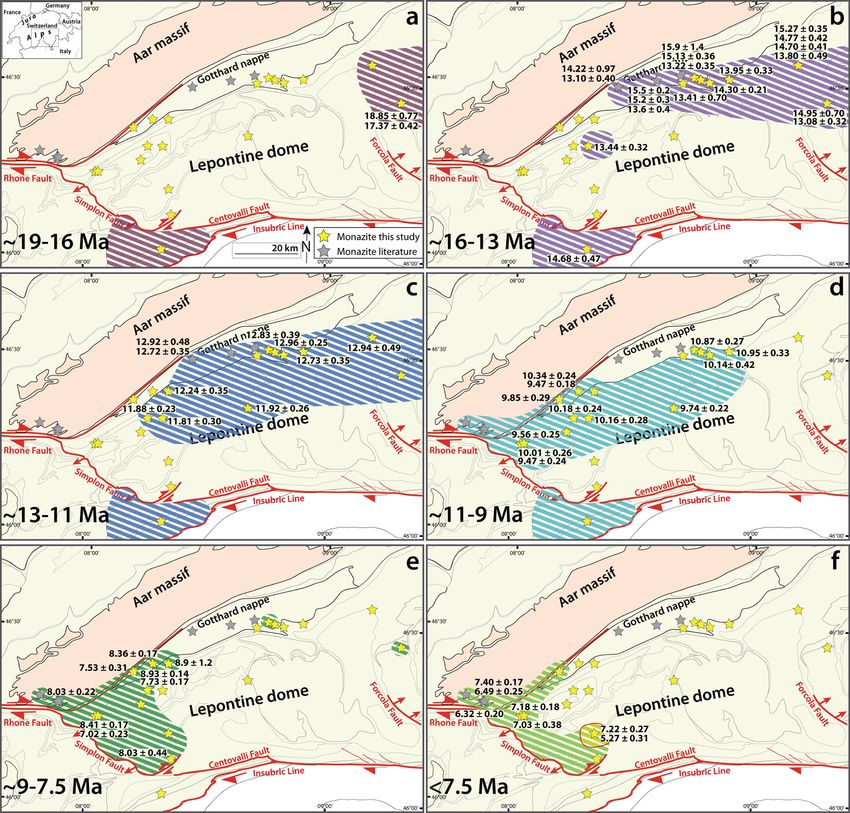
DUTH 6 5e 26 12.60 ± 0.37–9.33 ± 0.32 like mean age like mean age 11.92 ± 0.26 1.5 13
9.74 ± 0.22 1.5 13
GRAESER 1 5f 31 12.14 ± 0.30–7.57 ± 0.19 like mean age like mean age 11.88 ± 0.23 0.19 ± −
10.18 ± 0.24 0.20 ± 0.17
8.93 ± 0.14 0.41 ± 0.23
7.73 ± 0.17 0.19 ± 0.16
GRAESER 3 5g 17 15.60 ± 0.61–6.36 ± 0.39 15.60 ± 0.61 6.36 ± 0.39
GRAESER 4 App. 2 12.25 ± 0.51–11.88 ± 0.47 12.25 ± 0.51 11.88 ± 0.47
KLEM 1 5h 24 10.64 ± 0.26–7.97 ± 0.20 like mean age like mean age 10.34 ± 0.24 0.29 ± −
9.47 ± 0.18 0.41 ± 0.27
8.36 ± 0.17 0.29 ± 0.22
KLEM 2 5i 17 13.65 ± 0.33–9.47 ± 0.40 like mean age like mean age 13.44 ± 0.32 0.30 ± −
11.81 ± 0.30 0.24 ± 0.22
10.16 ± 0.28 0.35 ± 0.29
KLEM 3 5j 24 12.96 ± 0.46–8.43 ± 0.32 like mean age like mean age 12.24 ± 0.35 1.7 12
8.9 ± 1.2 2.0 3
SCHIESS 1 5k 27 9.94 ± 0.25–6.78 ± 0.18 like mean age like mean age 9.56 ± 0.25 2.0 10
7.02 ± 0.23 1.6 7
VANI 4 5l 16 9.27 ± 0.43–6.89 ± 0.37 9.27 ± 0.43 6.89 ± 0.37 8.03 ± 0.44 2.2 7
VANI 5 5m 20 8.07 ± 0.36–2.69 ± 0.11 like mean age 2.69 ± 0.11 7.22 ± 0.27 2.1 9
5.27 ± 0.31 2.4 6
Center BLAS 1 5n 18 14.49 ± 0.26–7.82 ± 0.22 14.49 ± 0.26 7.82 ± 0.22 12.83 ± 0.39 2.0 5
DUTH 2 5o 16 14.34 ± 0.41–11.15 ± 0.43 14.34 ± 0.41 11.15 ± 0.43 13.41 ± 0.70 2.0 5
DUTH 3 5p 26 14.53 ± 0.43–10.61 ± 0.34 like mean age like mean age 13.95 ± 0.33 0.41 ± −
12.73 ± 0.35 0.35 ± 0.26
10.95 ± 0.33 0.24 ± 0.20
LUCO 1 5q 25 14.74 ± 0.30–9.90 ± 0.17 like mean age like mean age 14.30 ± 0.21 1.13 6
10.14 ± 0.42 1.8 4
SALZ 2 5r 28 14.28 ± 0.74–10.51 ± 0.39 like mean age like mean age 12.96 ± 0.25 2.4 20
10.87 ± 0.27 1.14 8
East TAMB 1 5s 24 19.02 ± 0.47–8.32 ± 0.11 like mean age 8.32 ± 0.11 18.85 ± 0.77 0.12 ± −
17.37 ± 0.42 0.23 ± 0.21
14.95 ± 0.70 0.24 ± 0.22
13.08 ± 0.32 0.41 ± 0.28
VALS 5t 43 16.43 ± 0.61–12.09 ± 0.57 like mean age like mean age 15.27 ± 0.35 1.1 7
14.77 ± 0.42 2.0 16
14.70 ± 0.41 0.81 6
13.80 ± 0.49 2.7 4
12.94 ± 0.49 1.9 10
Solid Earth, 11, 199–222, 2020 www.solid-earth.net/11/199/2020/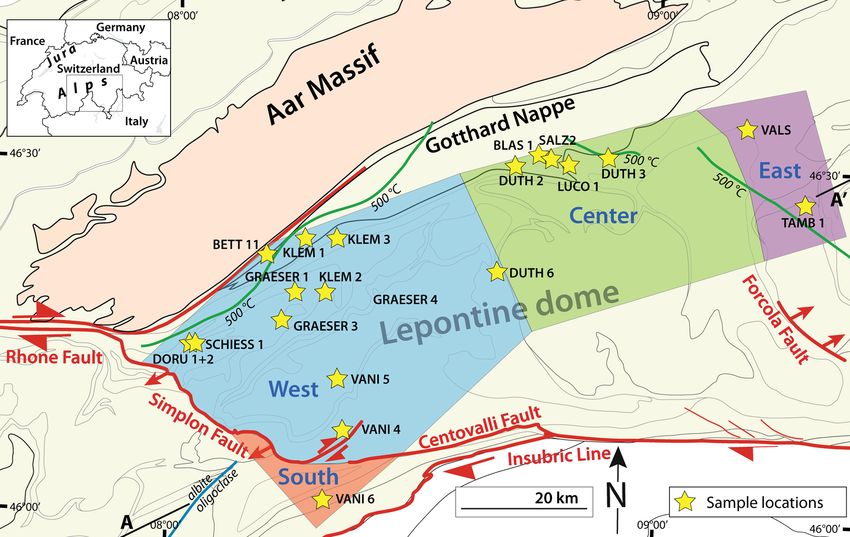
C. A. Bergemann et al.: Dating tectonic activity through hydrothermal monazite-(Ce)                                               207

                                                                       phases (e.g., Grand’Homme et al., 2016), and analyses be-
                                                                       longing to the same chemical group may show a large age
                                                                       scatter, the finite number of analyses per grain would result
                                                                       in many individual ages being discarded for these areas. Ac-
                                                                       cordingly, events may, especially in larger grains, not be rec-
                                                                       ognized if looking at the well-defined weighted mean ages
                                                                       only. To avoid this, the entire data set of each region was
                                                                       plotted according to the number of ages per 0.5 Myr interval
                                                                       to identify age clusters across the grains of a given region
                                                                       (Fig. 4, inset). Identified deformation stages for which ages
                                                                       were obtained were then combined with the weighted aver-
                                                                       age ages to visualize distinct events or phases of tectonic ac-
                                                                       tivity (Fig. 4). As can be seen, some phases of age recording
                                                                       visible in the overall age record were not identified through
                                                                       weighted mean ages alone. For the interpretation of the data,
                                                                       weighted mean ages are preferable to pinpoint deformation
                                                                       events. However, at least the beginning and end of the age
                                                                       record within a sample must have a geological significance
                                                                       since their recording must have been triggered by tectonic
                                                                       activity, even if one assumes all ages in between to be simply
                                                                       mixing ages. Accordingly, weighted mean ages are in the fol-
                                                                       lowing generally discussed as precise ages, while spot ages
                                                                       are treated as approximate ages.

                                                                       Results

                                                                       The ion-probe measurement data set is given in the data ta-
                                                                       ble in the Supplement and can be found in the PANGAEA
                                                                       database (https://doi.org/10.1594/PANGAEA.898689). Only
                                                                       those few measurements that did not yield an age were dis-
                                                                       carded during the initial data reduction (their positions are
                                                                       included in Fig. 5). The age data of the individual samples
                                                                       and the whole data set cover a large range of ca. 16 Myr, be-
                                                                       tween ∼ 19 and 2.7 Ma. Individual grains record ages over
                                                                       a lifetime of 2 to 7.5 Myr. An overview over the individual
                                                                       age ranges and the weighted mean domain ages that could
                                                                       be calculated for the individual samples is shown in Table 2.
                                                                       Figure 5 shows the measurement positions, an age plot, and
                                                                       a chemical plot for each sample.
                                                                          Sample GRAESER 4 (Appendix Fig. A1; Supplement ta-
Figure 4. Time diagram combining the overall age recording time        ble) is a grain (co-type) from the monazite-(Nd) type lo-
from the inset and weighted mean ages of all samples from the Lep-     cality (Graeser and Schwander, 1987). Due to very low Th
ontine Dome. The inset shows an age probability density plot rep-      contents, only two spots yielded ages of 11.88 ± 0.47 and
resenting the data set of each region (Fig. 1) according to the num-   12.25 ± 0.51 Ma, clearly indicating that the monazite-(Nd)
ber of ages per 0.5 Myr interval. Black error bars indicate weighted   crystallized coevally with monazite-(Ce).
mean ages from this study.
                                                                          Typical for hydrothermal cleft and fissure monazite, the
                                                                       contents of Th and U are generally relatively low compared
                                                                       to monazite from other geological environments (Supple-
tween being mixing ages or the result of either multiple or            ment table; Janots et al., 2012). Th contents mostly range
continuous (re)crystallization events. These weighted mean             from 5000 to 60 000 ppm, with (parts of) individual sam-
ages were only kept if their MSWD did not exceed the 95 %              ples considerably lower (down to 1000 ppm) or higher (up to
confidence interval for a given number of dates, as recom-             110 000 ppm), while U contents are below 1000 ppm (only
mended by Mahon (1996).                                                KLEM 3 up to 3300 ppm). This results in very high Th/U
  As altered areas may preserve their overall chemical com-            ratios of up to 792. Lead contents show a spread from a few
position but consist of a submicroscopic mix of different              up to several hundred ppm, with common Pb contents for

www.solid-earth.net/11/199/2020/                                                                    Solid Earth, 11, 199–222, 2020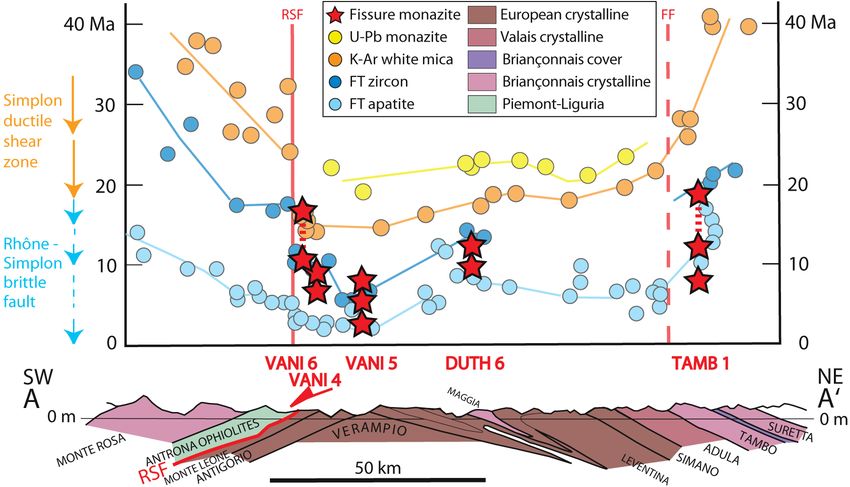
208                                 C. A. Bergemann et al.: Dating tectonic activity through hydrothermal monazite-(Ce)

the most part considerably below 10 %. A number of mea-                 – SCHIESS 1 shows many cracks and in parts strong
surements in GRAESER 3 and TAMB 1 show very high                          alteration signs like porosity, and the primary zona-
common Pb contents, largely above 70 %, with a maximum                    tion is cut in places.
of 99 %. While generally increasing the uncertainty in the
age data, this is insignificant for the age data presented here   (3) Clear distinction between primary and altered zones:
as these show no significant age difference between spots
with high or low common Pb contents (except for sample                  – BETT 11 is the only sample that shows no (pri-
GRAESER 3). With the exception of samples BLAS 1 and                      mary) zonation, but it shows altered areas around
GRAESER 3, all sample grains show at least some alter-                    holes and along rims.
ation features (irregular, wavy, or unclear zonation, poros-            – VANI 6 displays oscillatory-complex zonation,
ity; see also Sect. 3.1) and can roughly be divided into five             with clearly discernible altered grain parts around
partly overlapping groups on the basis of their appearance in             pores and along rims.
BSE images (Fig. 5; for an introduction into this, see Catlos,
2013).                                                                  – LUCO 1 is largely featureless in the lighter parts of
                                                                          the BSE image, with right and interior parts show-
(1) Sector-(like) zonation:                                               ing an intricate secondary zonation pattern.

       – DUTH 6 shows some signs of alteration or replace-        (4) Weak zonation with minor alteration features:
         ment and complex zonation in the inner part of the
         grain.                                                         – DUTH 2 displays only weak remnants of sector-
       – GRAESER 3 shows no clear signs of alteration                     like zonation.
         but an extreme zonation in both Th (∼ 1800–                    – KLEM 3 shows weak remnants of oscillatory zona-
         113 000 ppm) and U (∼ 10–680 ppm) contents ac-                   tion that is cut and transitions in places into a dif-
         cording to visible zonation and elevated (> 10 %)                fuse pattern.
         to extreme (65 %–99 %) common Pb contents. The
         ages derived from the low-Th measurements should               – SALZ 2 shows remains of sector-like combined
         be treated with caution, as they show a greater                  with complex zonation.
         spread at higher error than the other measurements.
                                                                  (5) Weak zonation with strong alteration features:
       – VANI 4 shows in places strong signs of alteration
         like cross-cutting and rounded zonation.                       – DORU 2 displays remnants of oscillatory zonation.
       – VANI 5 displays in places only weak zonation                   – DUTH 3 has partly preserved oscillatory zonation
         with sometimes strong alteration signs. Thorium                  with large parts of the grain having only very weak
         contents are relatively low (1600–10 800 ppm) and                zonation.
         common Pb contents elevated but mostly below
         20 %.                                                          – GRAESER 1 shows remains of sector combined
                                                                          with oscillatory zonation but strong zonation in the
       – VALS, by far the largest analyzed grain, shows in                altered parts of the crystal.
         places only weak zonation with sometimes strong
         alteration features. Thorium contents are low (>               – GRAESER 4 (see Appendix) shows remnants of
         3500 ppm) with only an overgrowth rim showing                    sector zonation and has very low Th contents of just
         higher contents (up to 12 300 ppm). Common Pb                    below 1100 ppm and elevated common Pb contents
         contents are elevated but remain below 25 %.                     below 20 %.
                                                                        – KLEM 2 has a diffuse internal structure with only
(2) Sector-(like) plus oscillatory or ring zonation:                      weakly preserved zonation and elevated common
                                                                          Pb contents that remain below 21 %.
       – BLAS 1 shows no visible signs of alteration, but the
         interior part of the crystal gives younger ages than           – TAMB 1 has a weakly pronounced patchy zonation,
         the outer part, meaning that (incomplete) alteration             with little growth or alteration patterns apart from
         likely happened along microcracks.                               porosity and cracks visible within the grain. Tho-
                                                                          rium contents are low (> 3300 ppm). While most
       – DORU 1 has strong zonation with only minor signs
                                                                          of the measurements have common Pb contents of
         of alteration.
                                                                          > 5 %, five measurements show very high contents
       – KLEM 1 shows signs of alteration, and the zonation               of 72 %–96 %, but despite this the dates appear
         is diffuse in places like the center and part of the             undisturbed.
         rim.

Solid Earth, 11, 199–222, 2020                                                             www.solid-earth.net/11/199/2020/
C. A. Bergemann et al.: Dating tectonic activity through hydrothermal monazite-(Ce) 209 Figure 5. www.solid-earth.net/11/199/2020/ Solid Earth, 11, 199–222, 2020
210                              C. A. Bergemann et al.: Dating tectonic activity through hydrothermal monazite-(Ce)

Figure 5.

Solid Earth, 11, 199–222, 2020                                                     www.solid-earth.net/11/199/2020/
C. A. Bergemann et al.: Dating tectonic activity through hydrothermal monazite-(Ce)                             211

Figure 5.

www.solid-earth.net/11/199/2020/                                                      Solid Earth, 11, 199–222, 2020
212                              C. A. Bergemann et al.: Dating tectonic activity through hydrothermal monazite-(Ce)

Figure 5.

Solid Earth, 11, 199–222, 2020                                                     www.solid-earth.net/11/199/2020/
C. A. Bergemann et al.: Dating tectonic activity through hydrothermal monazite-(Ce)                                                     213

Figure 5. Visualization by sample of all SIMS analyses conducted for this study. Chemical plots that best show the different groups within a
sample (left), BSE images (center) with colored ovals representing analysis spots being to scale, and age diagrams (right) show 208 Pb/232 Th
ages. Gray ovals were not included in any of the groups.

www.solid-earth.net/11/199/2020/                                                                        Solid Earth, 11, 199–222, 2020
214                                 C. A. Bergemann et al.: Dating tectonic activity through hydrothermal monazite-(Ce)

5     Discussion                                                  ZFT ages that show a considerable spread of ca. 70–50 Ma
                                                                  (Kurz et al., 2011; van Gelder et al., 2015). The three areas
5.1    Hydrothermal monazite-(Ce) ages compared to                have in common that exhumation or cooling rates were low
       thermochronometry during cooling                           during the time of hydrothermal monazite-(Ce) crystalliza-
                                                                  tion (e.g., Fügenschuh et al., 2000; Steck et al., 2013) com-
Hydrothermal monazite-(Ce) crystallization and alteration         pared to other parts of the Alps from which hydrothermal
typically occur in a fluid temperature window of ca. 350 ◦ C      monazite-(Ce) was dated (Gnos et al., 2015; Bergemann et
down to at least 200 ◦ C (Gnos et al., 2015; Bergemann et al.,    al., 2017, 2019b; Ricchi et al., 2019).
2017, 2018) but probably considerably below as is, for ex-           A possible explanation for this difference in age relations
ample, visible in Fig. 6. This is by its nature independent of    is that, due to the slow cooling rates, the Ar isotope system
the local cooling rate, since for the monazite-(Ce) crystal-      closure and the end of fission-track annealing would have
lization the temperature window and fluid chemistry instead       occurred at the lower end of their respective closure temper-
of the cooling speed is the critical factor. In most areas the    ature windows since the systems had time to equilibrate even
oldest recorded hydrothermal monazite-(Ce) ages are pre-          at lower temperatures. Monazite-(Ce) crystallization, on the
dated by 40 Ar/39 Ar white mica cooling ages, and they are        other hand, presumably occurred during its ca. 350 ◦ C down
slightly younger than or equal to zircon fission-track (ZFT)      to or likely below 200 ◦ C temperature window (Gnos et al.,
ages (Fig. 6, although here K–Ar ages instead of 40 Ar/39 Ar      2015; Bergemann et al., 2017, 2018). This means that during
ages are shown; Gnos et al., 2015; Grand’Homme et al.,            ongoing tectonic activity the coincidence of 40 Ar/39 Ar white
2016; Bergemann et al., 2017, 2019b; Ricchi et al., 2019).        mica ages with the beginning of monazite-(Ce) crystalliza-
This sequence is also found in most parts of the Lepontine        tion and ZFT ages overlapping with the latest monazite-(Ce)
Dome as shown for samples located in the vicinity of the          crystallization may be an indication of slow exhumation or
NE–SW cross section Fig. 6.                                       cooling rates. Since monazite-(Ce) (re)precipitation depends
   A comparison of monazite-(Ce) crystallization ages with        on a disequilibration of the fissure or cleft system, a lack of
ages obtained with thermochronometers, whose closure tem-         this relation does, on the other hand, not exclude low ex-
peratures depend on the cooling rate, seems to allow for the      humation rates for an area. This could, for example, be the
identification of areas experiencing low cooling rates at the     case if initial monazite-(Ce) formation did not occur at the
time of hydrothermal monazite growth. In such cases, mon-         upper end of its formation window or if the analyzed mon-
azite has a larger time window to record tectonic activity,       azite comes from a younger cleft generation that formed after
and 40 Ar/39 Ar white mica ages coincide with the beginning       a change in deformation style from, for example, thrusting to
of the monazite-(Ce) age record, whereas ZFT ages coin-           strike-slip formation (see Bergemann et al., 2017; Ricchi et
cide with or even postdate the youngest found monazite-(Ce)       al., 2019).
ages. This is the case in the central region of the study area,
where the youngest white mica cooling ages of 15.1±0.70 to        5.2   Monazite-(Ce) ages and late Lepontine Dome
16.30 ± 0.23 Ma (Allaz et al., 2011) located west of sample             evolution
DUTH 2 and south of sample LUCO 1 (Fig. 1) coincide with
the earliest monazite-(Ce) crystallization dated at ca. 14.3 to   Hydrothermal cleft monazite-(Ce) crystallization and
14.7 Ma, and ZFT ages of 9.7 ± 0.5 Ma (Janots et al., 2009)       dissolution–reprecipitation varied in space and time in the
coincide with the late phase of monazite-(Ce) age record-         study region as it passed through the monazite-(Ce) crystal-
ing around 10 Ma. Also in the vicinity of sample VANI 6           lization recording window. The growth duration recorded by
south of the Rhone-Simplon Fault (RSF) (Fig. 1), the ZFT          the spot age range within individual monazite-(Ce) crystals
ages ranging from 12.0 ± 2.6 to 7.1 ± 1.6 Ma (Keller et al.,      spans from 2.5 Ma to 7 Myr (Table 2, Fig. 5), with the total
2005) overlap with the youngest monazite-(Ce) spot ages of        spot age range of all grains covering the time from ca. 19
around 12.5 to 10.6 Ma. There are no 40 Ar/39 Ar white mica       to 2.7 Ma. The following description gives an overview
ages in the direct vicinity of VANI 6. However, the sam-          over the spatial distribution of the monazite-(Ce) age record
ple is located in an area that does not show the large jump       visible in Fig. 7, and it is followed by a contextualization
in cooling ages (Fig. 6) found across the rest of the brit-       within the area.
tle Rhone-Simplon Fault bordering the Lepontine Dome to              The monazite-(Ce) age record starts in the eastern re-
the west (Keller et al., 2005; Campani et al., 2010). A simi-     gion (Fig. 1) of the study area at the edges of the Lepon-
lar age pattern was also found outside the study area, in the     tine Dome (Fig. 7a), with the earliest ages around 19 Ma
Eastern Alps in Austria, in an area affected by Cretaceous        (sample TAMB 1; Figs. 4, 5s), slightly postdated by sam-
Eo-Alpine Barrow-type metamorphism (Bergemann et al.,             ple VALS somewhat to the north of TAMB 1 at ∼ 16.5 Ma
2018). There, primary monazite-(Ce) mean ages of 90.6±1.3         (Fig. 5t). As it continues in the east, the age record starts in
to 89.2±1.8 Ma coincide with 40 Ar/39 Ar white mica ages of       the central region (Fig. 1) around 14.7–14.3 Ma. This paral-
88.4 ± 0.4 to 84.3 ± 0.7 Ma (Dallmeyer et al., 1996), and the     lel monazite-(Ce) age record for the central and eastern re-
youngest monazite spot ages of around 70 Ma coincide with         gions continues until ca. 12.5 Ma after which it ends in the

Solid Earth, 11, 199–222, 2020                                                              www.solid-earth.net/11/199/2020/
C. A. Bergemann et al.: Dating tectonic activity through hydrothermal monazite-(Ce) 215
Figure 6. Figure modified from Steck et al. (2013), with cooling ages compiled by Steck and Hunziker (1994), and completed with data
from Keller et al. (2005), Rahn (2005), Elfert et al. (2013) and Boston et al. (2017). Cleft monazite crystallization ages of samples from this
study, located in the vicinity of the cross section (Figs. 1, 2), are shown for comparison. The red lines mark the Rhone-Simplon Fault (RSF)
and Forcola Fault (FF, located south of the cross section). Sample VANI 6 is projected into the profile from some distance and into the foot
wall of the RSF where cooling ages are similar to those around the sample location of VANI 6. Note that rock-forming monazite dates peak
metamorphic conditions considerably higher than the (re)crystallization temperature of the hydrothermal cleft and fissure monazite-(Ce)
variety.
east, with the exception of an isolated spot age of ∼ 8.3 Ma Overall, the monazite-(Ce) chronological record shows a
(TAMB 1). The western area (Fig. 1) has a more hetero- clear east–west trend without large age jumps within the Lep-
geneous age record with the oldest ages being diachronous ontine Dome. The record starts in the eastern (and southern)
within the area from east to west or southwest (Fig. 7b–e). parts of the study area, with the activity then moving through
The oldest ages are around 13.6 Ma (KLEM 2) with the area the central to the western area, where it progressively con-
in which ages are recorded progressively spreading west; un- centrates on the large fault systems in the west of the Lepon-
til ca. 10 Ma, most samples from the western region record tine Dome.
ages. The age record ends first in the central region and then The earliest monazite-(Ce) ages, found in the eastern area
the easternmost western region at ca. 9.5 Ma, except a spot (TAMB 1; Fig. 1), fall into two groups, with mean ages at
age in the center of 7.8 Ma (BLAS 1). The record contin- 18.85 ± 0.77 and 17.37 ± 0.42 Ma (Fig. 4, Table 2), during
ues in most of the western region (Fig. 7e) until it becomes which time the area around TAMB 1 experienced a time of
progressively more localized by ∼ 7.5 Ma towards the west rapid exhumation and cooling (Steck and Hunziker, 1994).
and the vicinity of the Rhone-Simplon Fault system (Fig. 7f). The nearby Forcola Fault (Fig. 1) was estimated to have
The youngest widely recorded monazite-(Ce) age group for been active sometime around 25–18 Ma on the basis of Rb–
this area dates to around 7 Ma (Fig. 7f), and only one sample Sr and K–Ar cooling ages (Meyre et al., 1998). In this con-
(VANI 5) records ages down to around 5 Ma, with a single text, the monazite-(Ce) ages would date the final deforma-
spot age of ∼ 2.7 Ma. The southern region (Fig. 1) at the SW tion phases of such normal faults as the Forcola Fault, which
edge of the Lepontine Dome, separated from the western re- shows an age jump in cooling ages similar to that of the
gion by the Rhone-Simplon Fault, shows a similar age range Rhone-Simplon Fault but in this case more pronounced for
as the eastern region. As in the east, the monazite-(Ce) age the low-temperature thermochronometers (Fig. 6). Monazite-
record starts early at ca. 16.8 Ma and continues somewhat (Ce) spot ages down to ∼ 8.3 Ma (Fig. 5s, Table 2) in con-
further down to around 10.6 Ma (Fig. 5a–d). junction with this age jump suggest that these faults, and
possibly the Forcola Fault itself, may have been active far
www.solid-earth.net/11/199/2020/ Solid Earth, 11, 199–222, 2020216 C. A. Bergemann et al.: Dating tectonic activity through hydrothermal monazite-(Ce) Figure 7. Overview maps of the study area modified from Steck et al. (2013) and Schmid et al. (2004) showing the relevant monazite-(Ce) spot and mean age record over time and space. Note the shift over time from the southern and eastern regions of the Lepontine Dome to the central and western areas and finally to the areas close to the shear zones bounding its western limit. Mean ages, quoted near the stars representing the corresponding sample locations, indicate individual tectonic events that could be identified for a grain. Ages are ordered into six time intervals. Published hydrothermal monazite-(Ce) locations (gray stars) of the areas adjacent to the Lepontine Dome are from Janots et al. (2012), Berger et al. (2013), and Ricchi et al. (2019). longer than until 18 Ma. The youngest ages even postdate Blanc massifs (Janots et al., 2019; Bergemann et al., 2019b). apatite fission-track ages (AFT) of 16.9 to 9.9 Ma (Hunziker North of TAMB 1, the age record of sample VALS starts et al., 1992; Rahn, 2005; Fig. 6). This is unusual and may slightly later at ∼ 16.5 Ma and then mirrors that of TAMB 1 have been facilitated by the late circulation of hot fluids dur- (Fig. 5s, t). ing renewed deformation. Something similar could be shown In the central area close to the sample locations, temper- for hydrothermal monazite-(Ce) of the Lauzière and Mont atures were still prograde up until the time of 19–18 Ma at Solid Earth, 11, 199–222, 2020 www.solid-earth.net/11/199/2020/
C. A. Bergemann et al.: Dating tectonic activity through hydrothermal monazite-(Ce)                                          217

450–430 ◦ C (Janots et al., 2009) as deduced from allanite        tional style elsewhere in the Western Alps mentioned above,
dating. After this time, temperature conditions must have de-     and it is followed by multiple mean ages from ∼ 10.5 to
creased due to exhumation, as the hydrothermal monazite-          7 Ma, with weakly defined clusters around 10.5–9.5 and 8.5–
(Ce) age record started after around 16–15 Ma in the central      7 Ma (Figs. 4, 7d). The older ages of these age groups are also
and southern Gotthard Nappe (this study; Ricchi et al., 2019)     recorded towards the central Lepontine (sample DUTH 6;
and eastern Lepontine Dome (Fig. 7b) and continued to later       Figs. 5e, 7c–d), but after ca. 10 Ma the ages are progres-
than ∼ 13 Ma (Fig. 7c). After this time, the monazite-(Ce)        sively restricted to the westernmost areas close to the fault
age record receded from the eastern region, which cooled          zones (Figs. 4, 7e, f). The younger mean ages likely mark
below 180 ◦ C around 12 Ma (e.g., Price et al., 2018, zircon      events of strong tectonic activity and corroborate evidence
U/Th–He), as well as the Gotthard Nappe, moving west- and         of continuing deformation along the Rhone-Simplon Fault
southwards into the Lepontine Dome (Fig. 7d). This would          (e.g., Zwingmann and Mancktelow, 2004; Campani et al.,
date the decoupling of the Gotthard Nappe, which experi-          2010; Surace et al., 2011). Only one sample in this group
enced a rapid exhumation due to steepening during back-           (VANI 5; Fig. 7f) yields ages younger than ca. 7 Ma, with
folding (Wiederkehr et al., 2009; Ricchi et al., 2019), from      a weighted mean age of 5.27 ± 0.31 Ma and a spot age of ∼
the Lepontine Dome to ca. 13–12 Ma, as the samples of             2.7 Ma (Fig. 5m). The sample comes from an area where late-
the central area in the Lepontine Dome show a continued           stage hydrothermal activity occurred (Pettke et al., 1999),
widespread age record down until ∼ 9 Ma (Fig. 7d). Dur-           and the mean age coincides with ZFT ages of 6.4–5.4 Ma that
ing this time interval (Fig. 7c), primary monazite-(Ce) crys-     are younger than those found in most of the region (Keller et
tallized also along the other parts of the extended Rhone-        al., 2006). This coincidence of ages younger than in the sur-
Simplon Fault system (Grand’Homme et al., 2016; Berge-            rounding areas may indicate a localized resetting of the ZFT
mann et al., 2017, 2019b; Ricchi et al., 2019). There, it dates   ages through the hydrothermal activity. The phases of de-
in some areas a change in deformational style, from thrust-       formation recorded in the western Lepontine Dome are not
ing or transtensional movements to pure strike-slip deforma-      local, but they seem to have affected much of the extended
tion, through the formation of a new cleft generation with        Rhone-Simplon Fault system in the Western Alps (Berger
a different orientation associated with strong hydrothermal       et al., 2013; Grand’Homme et al., 2016; Bergemann et al.,
fluid activity (Bergemann et al., 2017, 2019b; Janots et al.,     2017, 2019b; Ricchi et al., 2019).
2019). Since in the study area clefts are vertical, whether
they formed during extension or later strike-slip deformation,
such a switch in deformation style cannot be proven. But          6   Summary
it might explain the progressive restriction of the monazite-
                                                                  Hydrothermal fissure monazite-(Ce) offers the possibility to
(Ce) age record to the vicinity of major fault zones in the
                                                                  date tectonic activity in the brittle domain for extended time
western Lepontine Dome (Fig. 7e–f). This excludes the Got-
                                                                  periods, as it provides a record of the shifting tectonic ac-
thard Nappe, where sampled clefts are horizontal (see also
                                                                  tivity within the Lepontine Dome likely associated with the
Ricchi et al., 2019).
                                                                  regional exhumation and shear zone history. The fluid and
   Spot ages of ∼ 12–10.5 Ma (Fig. 7d) mark the end of the
                                                                  likely often also host rock temperature range of roughly
hydrothermal monazite-(Ce) age record in the hanging wall
                                                                  350 ◦ C to at least 200 ◦ C, as indicated by previous studies,
of the Rhone-Simplon Fault (southern region, Fig. 1), which
                                                                  likely extends to significantly lower temperatures as sug-
had continued since ∼ 16.8 Ma (spot age), largely parallel
                                                                  gested by a comparison with thermochronometers. This com-
to that in the eastern region (Fig. 7a–d). Comparably old
                                                                  parison between hydrothermal monazite-(Ce) samples from
spot ages of ∼ 11.5–10 Ma mark the beginning of monazite-
                                                                  different parts of the Lepontine Dome area and the Eastern
(Ce) crystallization in the foot wall of the Rhone-Simplon
                                                                  Alps with thermochronometric data suggests that hydrother-
Fault (Figs. 1, 7d), which tend to postdate, but are still in
                                                                  mal monazite-(Ce) dating might help with identifying areas
close agreement with, zircon fission-track ages (Fig. 6). The
                                                                  of slow exhumation or cooling rates during ongoing tectonic
often well-constrained weighted mean ages of western re-
                                                                  activity. The 232 Th–208 Pb monazite-(Ce) crystallization data
gion samples (Figs. 4, 5b–d) might suggest a dominance of
                                                                  record prolonged hydrothermal activity during tectonics be-
strong individual tectonic events. With this in mind, weighted
                                                                  tween ∼ 19 and 2.7 Ma and thereby contributed to the under-
mean ages in this area (Fig. 4) may suggest deformation dur-
                                                                  standing of the tectonic evolution of the Central Alps. Over-
ing brittle tectonics along the extended Rhone-Simplon Fault
                                                                  all, the monazite-(Ce) age record reveals a relatively smooth
system.
                                                                  east–west age trend within the Lepontine Dome. The record
   The mean age group around 12 Ma, found in the east-
                                                                  starts in the eastern (and southern) parts of the study area,
ern part of the western zone (Figs. 4, 7c), is related to the
                                                                  with the recorded activity then moving through the central to
more strongly exhumed areas with some distance from the
                                                                  the western area, where it progressively concentrates on the
Simplon Fault (Haertel et al., 2013), whereas the younger
                                                                  large fault systems of the western Lepontine Dome.
ages are closer to the localized, late Simplon Fault. The
12 Ma age also falls together with the switch in deforma-

www.solid-earth.net/11/199/2020/                                                               Solid Earth, 11, 199–222, 2020
You can also read