De novo transcriptome sequencing and anthocyanin metabolite analysis reveals leaf color of Acer pseudosieboldianum in autumn
←
→
Page content transcription
If your browser does not render page correctly, please read the page content below
Gao et al. BMC Genomics      (2021) 22:383
https://doi.org/10.1186/s12864-021-07715-x

 RESEARCH ARTICLE                                                                                                                                   Open Access

De novo transcriptome sequencing and
anthocyanin metabolite analysis reveals
leaf color of Acer pseudosieboldianum in
autumn
Yu-Fu Gao†, Dong-Hui Zhao†, Jia-Qi Zhang, Jia-Shuo Chen, Jia-Lin Li, Zhuo Weng and Li-Ping Rong*

  Abstract
  Background: Leaf color is an important ornamental trait of colored-leaf plants. The change of leaf color is closely
  related to the synthesis and accumulation of anthocyanins in leaves. Acer pseudosieboldianum is a colored-leaf tree
  native to Northeastern China, however, there was less knowledge in Acer about anthocyanins biosynthesis and
  many steps of the pathway remain unknown to date.
  Results: Anthocyanins metabolite and transcript profiling were conducted using HPLC and ESI-MS/MS system and
  high-throughput RNA sequencing respectively. The results demonstrated that five anthocyanins were detected in
  this experiment. It is worth mentioning that Peonidin O-hexoside and Cyanidin 3, 5-O-diglucoside were abundant,
  especially Cyanidin 3, 5-O-diglucoside displayed significant differences in content change at two periods, meaning
  it may be play an important role for the final color. Transcriptome identification showed that a total of 67.47 Gb of
  clean data were obtained from our sequencing results. Functional annotation of unigenes, including comparison
  with COG and GO databases, yielded 35,316 unigene annotations. 16,521 differentially expressed genes were
  identified from a statistical analysis of differentially gene expression. The genes related to leaf color formation
  including PAL, ANS, DFR, F3H were selected. Also, we screened out the regulatory genes such as MYB, bHLH and
  WD40. Combined with the detection of metabolites, the gene pathways related to anthocyanin synthesis were
  analyzed.
  Conclusions: Cyanidin 3, 5-O-diglucoside played an important role for the final color. The genes related to leaf
  color formation including PAL, ANS, DFR, F3H and regulatory genes such as MYB, bHLH and WD40 were selected.
  This study enriched the available transcriptome information for A. pseudosieboldianum and identified a series of
  differentially expressed genes related to leaf color, which provides valuable information for further study on the
  genetic mechanism of leaf color expression in A. pseudosieboldianum.
  Keywords: A. pseudosieboldianum, Transcriptome, Differentially expressed genes, Anthocyanin

* Correspondence: rongliping2013@163.com
†
 Yu-Fu Gao and Dong-Hui Zhao contributed equally to this work
Agriculture College, Yanbian University, 977 Gongyuan Road, 133002 Yanji,
China

                                        © The Author(s). 2021 Open Access This article is licensed under a Creative Commons Attribution 4.0 International License,
                                        which permits use, sharing, adaptation, distribution and reproduction in any medium or format, as long as you give
                                        appropriate credit to the original author(s) and the source, provide a link to the Creative Commons licence, and indicate if
                                        changes were made. The images or other third party material in this article are included in the article's Creative Commons
                                        licence, unless indicated otherwise in a credit line to the material. If material is not included in the article's Creative Commons
                                        licence and your intended use is not permitted by statutory regulation or exceeds the permitted use, you will need to obtain
                                        permission directly from the copyright holder. To view a copy of this licence, visit http://creativecommons.org/licenses/by/4.0/.
                                        The Creative Commons Public Domain Dedication waiver (http://creativecommons.org/publicdomain/zero/1.0/) applies to the
                                        data made available in this article, unless otherwise stated in a credit line to the data.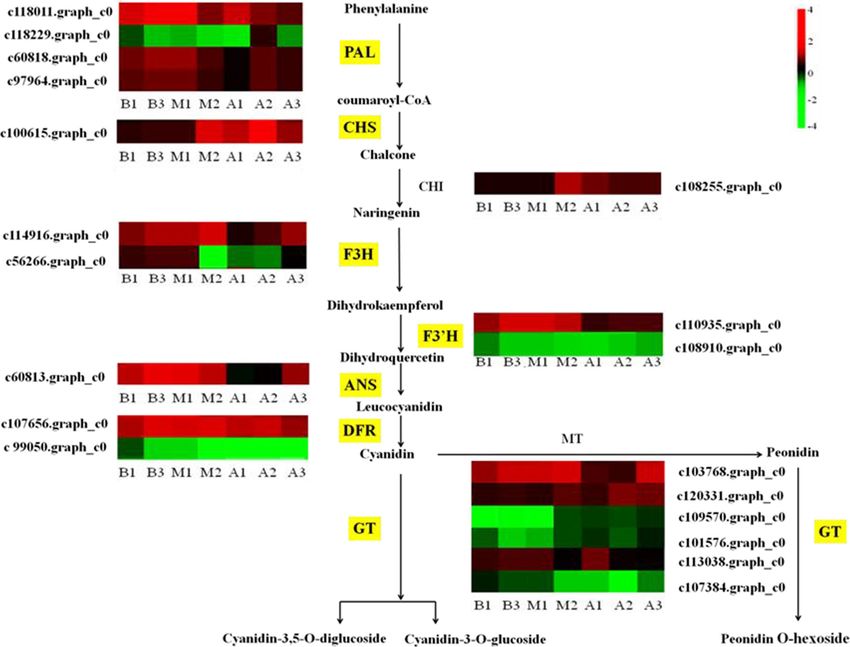
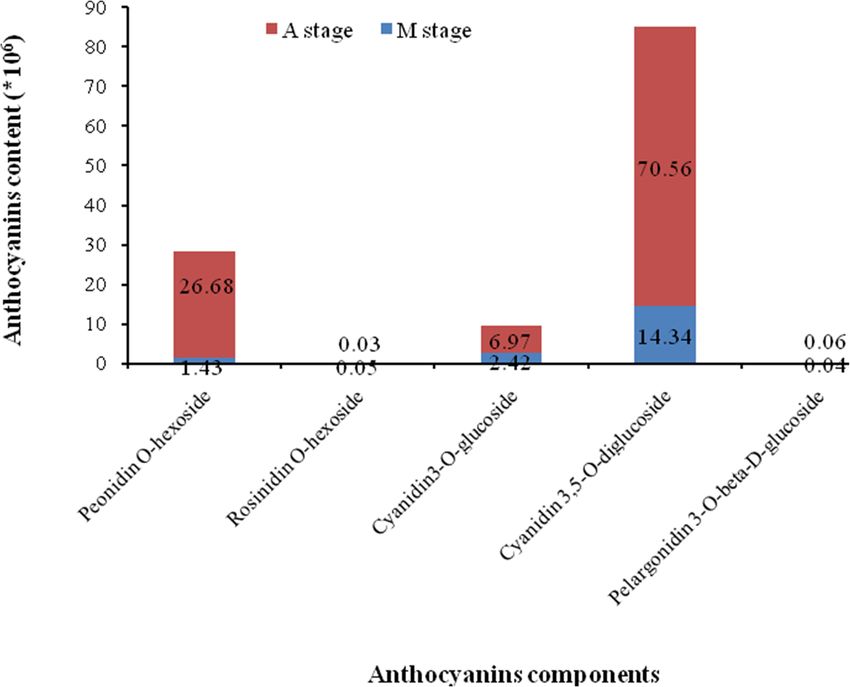
Gao et al. BMC Genomics   (2021) 22:383                                                                        Page 2 of 12

Background                                                    combined this data with anthocyanin metabolism ana-
Leaf color is one of the most important characteristics of    lysis data, some genes related to anthocyanin synthesis
ornamental plants, and plants with colored foliage were       were identified. This study provides a theoretical basis
often called “colored-leaf plants” [1, 2]. Some researchers   for studying the molecular mechanism of leaf color in A.
have analyzed and determined systematically the pig-          pseudosieboldianum.
ments and physiological indexes of the leaves of colored-
leaf plants [3, 4]. Result showed that the change of leaf     Results
color is closely related to the synthesis and accumulation    Contents of anthocyanin in the leaves
of anthocyanins in leaves [5]. Anthocyanins are one of        In order to explore the mechanism of pigment formation
the important secondary metabolites of plants and they        in A. pseudosieboldianum leaves, we carried out qualita-
often have anti-cancer, anti-oxidation and anti-              tive analysis of anthocyanin components in the middle
atherosclerosis properties [6]. Anthocyanins confer or-       (M) and last stage (A) of leaf color transformation (The
ange, red, magenta, violet and blue and the biosynthetic      anthocyanin content was extremely low in early stage
pathway leading to floral or pulp pigment accumulation        (B), Therefore, only M and A stage were analyzed). Ac-
had been well characterized and the genes encoding            cording to our UPLC–Q–TOF–MS data, five anthocya-
relevant enzymes and transcriptional factors have been        nins were identified (Fig. 1). They were Peonidin O-
isolated [7, 8]. The molecular mechanisms of the antho-       hexoside, Rosinidin O-hexoside, Cyanidin 3-O-glucoside,
cyanin biosynthesis pathway also have been comprehen-         Cyanidin 3, 5-O-diglucoside, and Pelargonidin 3-O-beta-
sively reported. However, most of the researches mainly       D-glucoside. The content of five anthocyanin metabo-
focused on f fruit color [9] and petal color [10–12], and     lites were different during the middle stage (M) and last
anthocyanin biosynthesis in colored-leaf plants has rarely    stage (A). The contents of Rosinidin O-hexoside and
been researched prior to this study. In recent years,         Pelargonidin 3-O-beta-D-glucoside in the leaves were
some scholars have identified PAL, CHS, CHI, DFR,             both very low. Peonidin O-hexoside and Cyanidin 3, 5-
ANS, F3H, F3’H, F3’5’H [13, 14] and a few related regu-       O-diglucoside, especially Cyanidin 3, 5-O-diglucoside in
latory genes such as MYB, bHLH and WDR in color               the leaves were abundantand, and displayed significant
changing of colored-leaf plants [15, 16]. The process of      differences at two periods, meaning they may be the key
anthocyanin synthesis and accumulation is relatively          substances for the final color of A. pseudosieboldianum.
complex, and is regulated by multiple enzymes and tran-
scription factors [17], as well as being influenced by ex-    Production statistics of sequencing data
ternal environmental factors such as light [18], water        In order to understand the molecular mechanism of
stress [19], and temperature [20]. Thus the mechanism         color change in A. pseudosieboldianum leaves in au-
of leaf color change in colored-leaf plants needs to be       tumn, sequencing was performed using the Illumina
further studied.                                              Hiseq 2500 (Additional file 1: Table S1). A total of 67.47
  Acer pseudosieboldianum is a small deciduous tree be-       Gb of clean data was obtained from these sequencing re-
longing to the Acer genus of the family Aceraceae. Be-        sults, and the percentage of Q30 bases was 93.10 % or
cause of its beautiful shape and brilliant leaves, it is an   more. After assembly, 50,501 unigenes were identified.
often used autumn leaf ornamental tree species [21]. In       Among these there were 20,706 unigenes over 1 kb in
addition, it has high economic value, whose woods can         length, and the error rate of sequencing was less than
be used for making utensils and leaves can be used as         0.1 %, which indicates that the quality of sequencing data
dyes [22]. Recently, some scholars have reported and          was good and could be used for subsequent analysis.
studied the introduction, cultivation, and breeding of A.
pseudosieboldianum [23, 24]. However the key genes af-        Statistics of sequencing data assembly results
fecting leaf color change have not been determined yet,       These recombinant sequence dataset yielded 115,413
and relative information is relatively scarce. This fact      transcripts and 50,501 unigenes, among which, the N50
means that the molecular regulatory mechanisms related        (accounting for 50 % of the maximum length nucleotide
to leaf color formation needs further study.                  sequence of all single genes) was 2267 nt and 1979 nt,
  In recent years, transcriptome high-throughput se-          respectively. There were 17,366 (34.39 %) unigenes be-
quencing technology has been widely used to study the         tween 300 and 500 nt, 23,580 (46.69 %) unigenes be-
mechanism of leaf color in various plants [25, 26]. In this   tween 500 and 2000 nt, and 9,555 (18.92 %) unigenes
study, de novo transcriptome sequencing assembly, an-         longer than 2000 nt (Table 1).
notation, and bioinformatic analysis on leaves from A.
pseudosieboldianum were performed at different color-         Functional annotation and classification
changing stages in autumn. The DEGs at different trans-       Unigene sequence was then compared with gene se-
formation stages were analyzed and validated. At last,        quences in the NR, Swiss-Prot GO, COG, KOG,
Gao et al. BMC Genomics (2021) 22:383 Page 3 of 12
Fig. 1 Anthocyanins components and contents detected in A. pseudosieboldianum
eggNOG 4.5, and KEGG databases using BLAST soft- popular-related species were also annotated based on
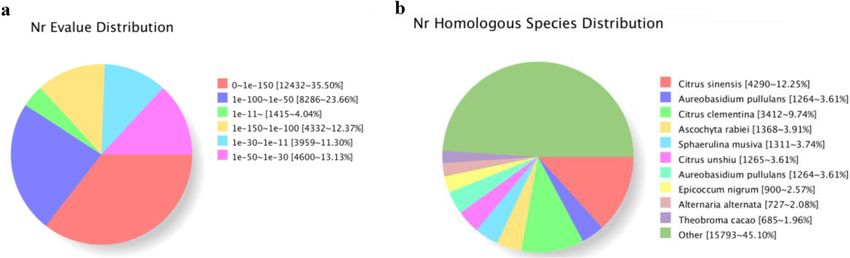
ware (e < 0.00001). 35,316 unigenes were identified, ac- the NCBI NR database (Fig. 2b). The highest homology
counting for 70.01 % of the 50,501 unigenes. 12,984 to A. pseudosieboldianum was Citrus sinensis, account-
unigenes were annotated in the COG database, 25,375, ing for 12.25 % homology, followed by Citrus clementina,
12,487 and 19,460 unigenes were annotated in the GO, which accounted for 9.74 % homology.
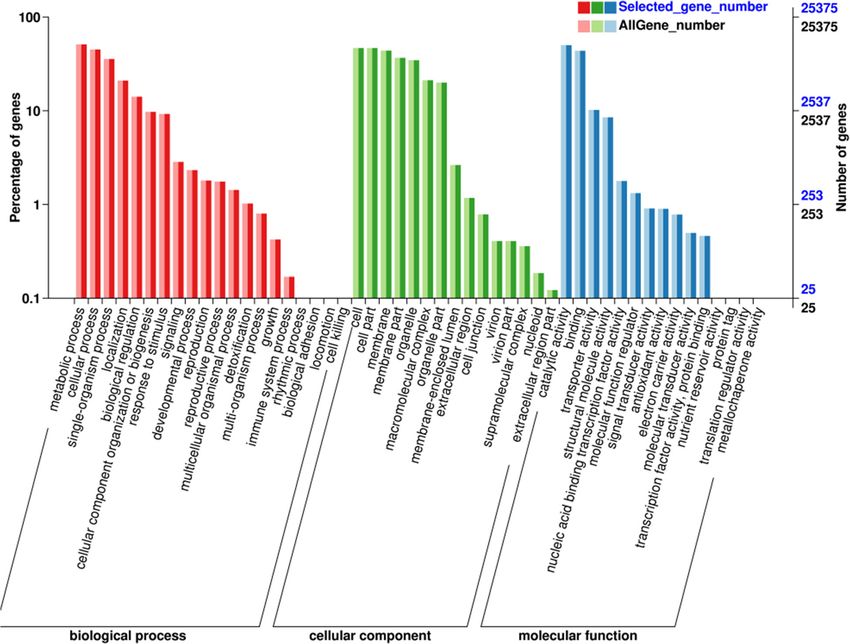
KEGG, and KOG databases respectively. 25,226 unigenes GO databases are divided into three categories: biological
were annotated in the Pfam database. 19,796 unigenes process, cellular component and molecular function, which
and 32,498 unigenes were also annotated in the Swan- are further divided into 42 functional subgroups. Biological
shot and eggNOG databases respectively (Table 2). process had the largest number of annotated unigenes, in-
According to NCBI NR database and E-value distribu- cluded metabolic process and cellular process with 13,141
tion, the number of unigenes annotated in our dataset (51.78 %) unigenes and 11,546 (45.5 %) unigenes, respectively.
was 35,024, of which 71.53 % of these unigenes (E < 10 The cellular component class mainly included cell and cell
− 50
) had strong homology and 47.87 % of these unigenes part, with 11,886 (46.84 %) unigenes and 11,806 (46.53 %) uni-
(E < 10− 100) had very strong homology (Fig. 2a).Ten genes, respectively. The molecular function category mainly
included catalytic activity and binding, and there were 12,691
Table 1 Length distributions of the transcripts and unigenes (50.01 %) unigenes and 1, 1049 (43.54 %) unigenes (Fig. 3).
from de novo assembly In addition, Annotation data about COG and KEGG
Length range Transcript Unigene were found in Additional file 2: Fig. S1 and Additional
300–500 24,236(21.00 %) 17,366(34.39 %)
file 3: Table S2, respecially.
500–1000 26,476(22.94 %) 12,429(24.61 %)
Differentially Expressed Genes (DEGs)
1000–2000 33,114(28.69 %) 11,151(22.08 %) In order to explore the genes related to anthocyanin bio-
2000+ 31,587(27.37 %) 9555(18.92 %) synthesis in A. pseudosieboldianum at different color-
Total Number 115,413 50,501 changing stages, the differential expression of A. pseudo-
Total Length 179,159,431 62,348,493 sieboldianum samples at different color-changing stages
N50 Length 2267 1979
were then analyzed. The results showed that there were
16,521 DEGs in the three color-changing periods of A.
Mean Length 1552.33 1234.60
pseudosieboldianum (Fig. 4a). Comparing between the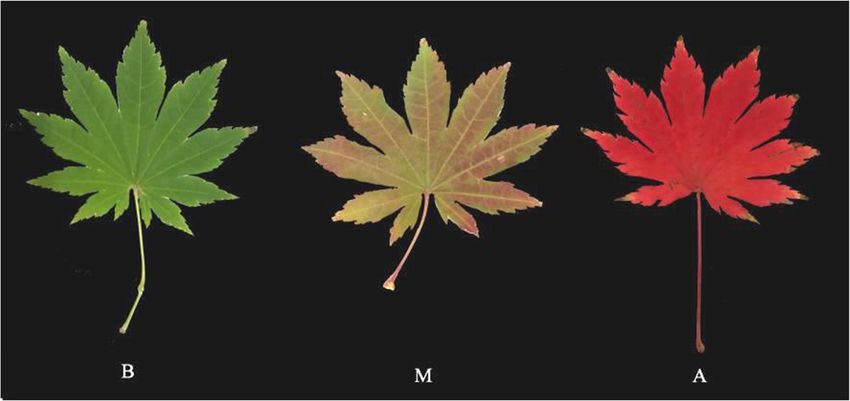
Gao et al. BMC Genomics      (2021) 22:383                                                                                            Page 4 of 12

Table 2 Statistics of comparisons with databases
Anno_ Database                            300 < = length < 1000                         length > = 1000                       Annotated Number
COG_Annotation                                      4534                                      8450                                    12,984
GO_Annotation                                      11,027                                    14,348                                   25,375
KEGG_Annotation                                     4861                                      7626                                    12,487
KOG_Annotation                                      7536                                     11,924                                   19,460
Pfam_Annotation                                     9281                                     15,945                                   25,226
Swissprot_Annotation                                6715                                     13,081                                   19,796
eggNOG_Annotation                                  14,214                                    18,284                                   32,498
Nr_Annotation                                      16,192                                    18,832                                   35,024
All_Annotated                                      16,431                                    18,885                                   35,316

early stage (B) and the middle stage (M), there were 87                    biosynthesis. Four PAL genes (c118011.graph_c0,
significant DEGs, with 52 up-regulated and 35 down-                        c118229.graph_c0, c60818.graph_c0, c97964.graph_c0),
regulated. Between with the early stage (B) and the final                  one CHS gene was detected (c100615.graph_c0), one
stage (A), there were 14,855 DEGs, of which 7984 were                      CHI gene (c108255.graph_c0), two F3H genes
up-regulated and 6871 were down-regulated. In a com-                       (c114916.graph_c0, c56266.graph_c0) were detected in
parison of the middle stage (M) and the final stage (A),                   the upstream phenylalanine pathway, and two F3’H
there were 12,402 DEGs, 5683 up-regulated and 6719                         genes (c110935.graph_c0, c108910.graph_c0), one ANS
down-regulated, in A. pseudosieboldianum (Fig. 4b).                        genes, two DFR genes, and six GT genes also detected in
   In order to further understand the function of these re-                the downstream phenylalanine pathway. Combined with
spective DEGs, we carried out KEGG pathway enrichment                      contents of metabolites, the gene pathways related to
analysis in the three stages of A. pseudosieboldianum. Our                 anthocyanin synthesis were analyzed in A. pseudosiebol-
results showed that there were 16,521 differentially expressed             dianum (Fig. 5).
genes in the three stages (B, M and A). The anthocyanin bio-
synthesis pathways related to leaf tone control were signifi-
cantly enriched in B vs. M and B vs. A up-regulated genes.                 Screening of different transcription factors for
Phenylalanine metabolic pathways were significantly                        anthocyanin biosynthesis
enriched in B vs. M and B vs. A up-regulated genes (Add-                   Transcription factors play an important role in plant de-
itional file 4: Table S3; Additional file 5: Table S4).                    velopment and secondary metabolism. In this experi-
                                                                           ment, we screened out 31 MYB genes, 15 bHLH genes,
                                                                           and 28 WD40 protein genes from the three DEGs of B,
Candidate genes involved in the anthocyanin                                M and A stages of A. pseudosieboldianum. In the 31
biosynthesis Pathway                                                       MYB genes, 17 were up-regulated and 14 down regu-
Twenty candidate genes were identified that covered al-                    lated (Additional file 6: Table S5). In the 15 bHLH
most all known enzymes involved in anthocyanin                             genes, 6 were up-regulated and 9 down regulated. In the

 Fig. 2 Characteristics of homology search of A. pseudosieboldianum unigenes. a E-value distribution in the NR database for each unigene.
 b Species taxonomy based on the NR database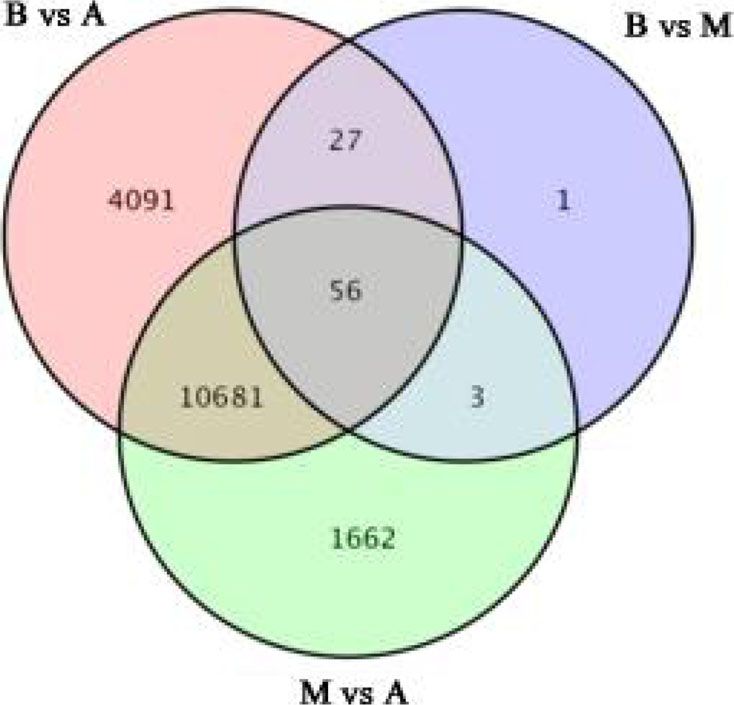
Gao et al. BMC Genomics       (2021) 22:383                                                                                              Page 5 of 12

 Fig. 3 Histogram of GO classification of assembled unigenes

 Fig. 4 Differentially expressed genes at three stages. a The statistics of differentially expressed genes; b Venn Diagram result among three stages
Gao et al. BMC Genomics       (2021) 22:383                                                                                            Page 6 of 12

 Fig. 5 Thermographic analysis of gene pathways related to flavonoid synthesis in A. pseudosieboldianum leaves at B, M and A stages. Early stage:
 B; mid- stage: M; last stage: A. B, M and A are arranged horizontally at all stages and single genes are listed vertically. The annotations are
 displayed next to the corresponding genes. All FPKM values of single genes are plotted logarithmically

28 WD40 protein genes, 25 were up-regulated and 3                          Ser. Palmata (Pax) Pojark. There were many cultivars of
down regulated.                                                            A. palmatum and they had strong ecological adaptability
                                                                           [27]. However, there are few varieties of A. pseudosiebol-
qRT-PCR confirmation of RNA-seq data                                       dianum, which was still in the wild state or in scenic for-
In order to verify the accuracy of our sequencing data,                    ests, and are rarely used in urban greening even if the
we selected eight genes involved in anthocyanin biosyn-                    maple leaves are red and beautiful in autumn and have
thesis, and analyzed the expression level in leaves of dif-                high ornamental value.
ferent color from these three different stages of A.                          At present, transcriptome sequencing technology has
pseudosieboldianum by qRT- PCR. The results showed                         been used to study vegetables color formation [28],
that all of these selected genes had similar expression                    flower color mechanisms [10, 29], fruit development [30,
patterns than identified in the RNA sequencing data                        31]. Some scholars have analyzed the color mechanism
(Fig. 6). Therefore, the data obtained in our study can be                 of the related species in Acer [32]. However, due to the
used to analyze the anthocyanin biosynthesis and metab-                    lack of genomic reference sequences, the molecular
olism gene in A. pseudosieboldianum.                                       mechanism of leaf color is difficult to decipher in A.
                                                                           pseudosieboldianum. The change of anthocyanin content
Discussion                                                                 in plants was shown to be related to the differential ex-
A. pseudosieboldianum is a wild ornamental maple na-                       pression of key genes encoding structural enzymes in
tive to Northeast China. Like A. palmatum Thunb., A.                       the anthocyanin biosynthesis pathway [10]. The different
pseudosieboldianum belongs to Sect. Palmata Paxand                         genes including PAL, CHS, ANS, UFGT, FLS, C4H, 4CL,
Gao et al. BMC Genomics (2021) 22:383 Page 7 of 12 Fig. 6 Expression analysis of eight differentially expressed genes related to flavonoid and anthocyanin biosynthesis in A. pseudosieboldianum DFR and ANR were identified in the flavonoid biosyn- the M vs. A stage, which indicated that the change of thesis pathway from the purple bud tea plant by tran- leaves from green to red was controlled by multiple sin- scriptome sequencing [33]. In this study, we used gle genes. transcriptome sequencing technology to sequence and Both F3’H and F3’5’H belong to the cytochrome P450 compare three different coloring stages of A. pseudosie- superfamily [34]. F3’H is an important intermediate in boldianum leaves in autumn. We detected four PAL, the synthesis of cyaniding, and F3’5’H is a key enzyme in one CHS, one CHI, two F3H, two F3’H, one F3’5’H, two the synthesis of blue flower anthocyanin. Masukawa T DFR, one ANS, and six UFGT genes in the flavonoid [35] reported that F3’H could make red cyanidin accu- anthocyanin complex related to leaf color in A. pseudo- mulate in purple and red root radishes. F3’5’H mainly sieboldianum. Three GT genes were down regulated in accumulated in the blue waterlily [11]. Many important
Gao et al. BMC Genomics   (2021) 22:383                                                                       Page 8 of 12

flower crops can’t produce turquoise, meaning they can-      to red in A. palmatum was the result of the increase of
not appear blue. In this study, two F3’H and one F3’5’H      the mass fraction of cyanidin galactoside and the de-
were detected, but the expression of F3’5’H was very         crease of the mass fraction of chlorophyll [43]. In this
small, which may be caused leaf colour did not appear        study, the contents of differential metabolites were very
blue.                                                        high about Cyanidin 3, 5-O-diglucoside. The above re-
   DFR is the key enzyme that catalyzes the conversion of    search results revealed that Cyanidin was important
dihydroflavonol to corresponding colorless geranium          anthocyanin in Acer, and played a key role of leaf color
delphinium and cyanidin [36]. The main function of           change in autumn. This study provided the basis for mo-
ANS is to oxidize colorless proanthocyanidins to pro-        lecular breeding theory for ornamental plant leaf color
duce colored anthocyanidins, which are the first colored     improvement.
compound in the anthocyanin synthesis pathway [37].
ANS was originally identified in a maize A2 mutant and       Conclusions
cloned by the transposon tagging technique [38]. GT is       In this study, five anthocyanins were detected in the
mainly responsible for transforming unstable anthocya-       leaves of A. pseudosieboldianum, especially, Cyanidin 3,
nins into stable anthocyanins. Studies have shown that       5-O-diglucoside played an important role for the final
the expression of UFGT is different in different varieties   leaf color. A total of 50,501 unigenes were produced at
[39]. For example, anthocyanin accumulation in apple         three stages of leaf color changing among which 16,521
was positively correlated with UFGT activity. The            DEGs and 64 unigenes were identified as color-related
change of UFGT activity in grape leads to the change of      homologous genes. Four PAL, one CHS, one CHI, two
their phenotype from white to red [40]. In this study,       F3H, two F3’H, one F3’5’H, two DFR, one ANS and six
UFGT (c103768.graph_c0) expression in A. pseudosiebol-       GT about anthocyanin synthesis pathway were detected.
dianum leaves first accumulated and then was con-            Combined with the detection of metabolites, the gene
sumed in the process of leaf color formation, which was      pathways related to anthocyanin synthesis were con-
consistent with the conclusion that UFGT consumption         ducted. Also, related regulatory genes include MYB,
was needed for paeoniae anthocyanin synthesis.               bHLH, and WD40 were found. This study provides a
   At present, the research about anthocyanin biosyn-        theoretical basis for the formation of leaf color in A.
thesis structural genes has been gradually improved, and     pseudosieboldianum.
the research on transcription factors has become the
focus. The transcription factors may also be one of the      Methods
important indicators of causing A. pseudosieboldianum        Plant materials and treatments
to turn green and red. Now MYB transcription factors         The materials tested were A. pseudosieboldianum plants
for anthocyanin biosynthesis have been identified and        that were five years old from Tianchi Square, Yanji City,
isolated in many plants. Some studies have shown that        Jilin Province (The plant materials were identified by
MYB transcription factor can enhance or inhibit some         Professor Liu Ji-Sheng from Agriculture college, Yanbian
aspects of regulation [10]. It was found that PqMYB113       University, engaged in dendrological research for many
was a transcription factor promoting anthocyanin syn-        years). Three leaf samples were collected separately at
thesis in the leaves of peony, while PqMYB4 was a tran-      three different stages (early stage: B; mid- stage: M; last
scription factor inhibiting anthocyanin synthesis in the     stage: A) with three replicate libraries per stage (Fig. 7).
leaves of peony. In this study, we found that ApMYB4         Three stages were September 21, 2018 (B) September
gene was down-regulated in the stage of green to red         30, 2018 (M) and October 11, 2018 (A). All flesh sam-
transformation, which is consistent with the previous re-    ples were frozen immediately in liquid nitrogen, and
search results, indicating that ApMYB4 gene may be a         then stored in a refrigerator at -80 ℃ for transcriptome
transcription factor promoting anthocyanin synthesis in      sequencing and anthocyanin metabolite analysis.
A. pseudosieboldianum.
   It is worth mentioning that Rosinidin O-hexoside was      Extraction identification and data analysis of anthocyanin
found in A. pseudosieboldianum leaves, although the          metabolites
content was very small. There was no Rosinidin O-            Leaf tissue samples of A. pseudosieboldianum were
hexoside found in Acer in previous studies. The distribu-    ground to a powder, and 100 mg of powder was dis-
tion of Rosinidin O-hexoside in plants is very limited       solved in 1.0 ml extract solution (70 % methanol aque-
and has only been reported in Catharanthus roseus [41]       ous solution). The dissolved sample was placed in a
and Primula [12]. In addition, the cyanidin 3-glucoside      refrigerator overnight at 4 ℃, and then vortexed three
contents could be used as a quantitative index to deter-     times during the period to improve the extraction rate.
mine the color of Acer palmatum ‘atropurpureum’ [42].        After centrifugation, the supernatant was reserved and
It was also found that the leaf color changing from green    the sample was filtered with a microporous filter
Gao et al. BMC Genomics       (2021) 22:383                                                                                               Page 9 of 12

 Fig. 7 The three stages of color change in A. pseudosieboldianum leaf. b: Initial stage, the leaves were all green. m: Mid stage, the leaves were
 both red and green. a: Last stage, the leaves were all red

membrane, and then stored in a sample bottle for LC-                         dual methods of De Bruijn mapping and sequencing
MS / MS analysis. We used multiple reaction monitor-                         read information analysis, each transcript sequence was
ing (MRM) for qualitative and quantitative analysis of                       identified in each fragment set. The Unigene sequence
metabolites by mass spectrometry. Combining single                           was compared with the gene sequence in NR [46],
variable statistical analysis and multivariate statistical                   Swiss-Prot [47], GO [48], COG [49], KOG [50], egg-
analysis, we calculated the fold-change, and called a me-                    NOG4.5 [51], KEGG database by Blast software [52]
tabolite as a differential metabolite when its value was                     (e < 0.00001). Using KOBAS 2.0 [53], the KEGG orthol-
between a fold change ≥ 2 and a fold change ≤ 0.5. The                       ogy result of unigenes from KEGG was obtained, and
differential metabolites were then annotated using the                       after predicting the amino acid sequence of each uni-
KEGG database [44].                                                          gene, we used HMMER [54] software to compare with
                                                                             the Pfam [55] database, select unigenes whose BLAST
RNA isolation library construction and RNA-Seq                               parameter E-values were not greater than 1e− 5 and
Total RNA was extracted from leaf samples using an                           whose HMMER parameter E-values were not more than
RNA extraction kit (Beijing Tiangen in China). Agarose                       1e− 10, and thus, finally obtained a unigene with annota-
electrophoresis and the Agilent 2100 Bioanalyzer were                        tion information.
used to determine the concentration, purity and integrity
of RNA samples. Then, PolyA mRNA was reverse tran-                           Expression and differentially expressed unigene
scribed into cDNA, and the construction and sequencing                       annotation
of the cDNA library was completed by the BMK Tech-                           Bowtie [56] was used to compare the sequenced reads
nology company in Beijing. Raw reads were obtained                           with a unigene library, and RSEM [57] was used to esti-
using an Illumina Hiseq 2500 sequencing platform, and                        mate the expression level. The expression abundance of
after filtering, clean reads were obtained. Contigs were                     each corresponding unigene was expressed by its FPKM
assembled by overlapping information between se-                             [58] value. It is a common method for estimating gene
quences, transcripts were locally assembled, and uni-                        expression level in transcriptome sequencing data ana-
genes were obtained by homologous clustering and                             lysis. The use of FPKM values can eliminate the influ-
splicing of transcripts with Tgicl and Phrap software, re-                   ence of gene length and sequencing on calculations of
spectively [45].                                                             gene expression. When detecting differentially expressed
                                                                             genes, DESeq2 was used to analyze the differentially
De novo assembly and functional annotation                                   expressed genes between the sample groups and the dif-
After obtaining high quality sequencing data, it was ne-                     ferentially expressed gene sets between two different
cessary to assemble the genomic sequence of A. pseudo-                       conditions were identified. In the process of differential
sieboldianum. First, Trinity software parsed the                             expression analysis, the Benjamini−Hochberg method
sequencing reads into shorter fragments (K-mers), ex-                        was used to correct the significance p-value of the ori-
tends these fragments into longer fragments (Contig),                        ginal hypothesis test, so as to reduce the false positives
and uses the overlap between these fragments to deter-                       in independent statistical hypothesis testing for a large
mine the fragment set (Component). Finally, using the                        number of gene expression values. In the screening
Gao et al. BMC Genomics (2021) 22:383 Page 10 of 12
process, the criterion was that the FDR (False Discovery Additional file 7: Table S6. Designed primers for RT-qPCR.
Rate) was less than 0.01 and the difference factor FC
(Fold Change) was greater than or equal to 2. Between Acknowledgements
these two factors, the FC represented the ratio of expres- We thank Beijing Biomarker Biotech Company for help with high throughput
sion between two samples (groups). sequencing.
Authors’ contributions
Gene validation and expression analysis YFG and DHZ carried out sequence data analysis and drafted the manuscript.
In order to validate our differential gene expression ana- LPR organized the manuscript and supervised the study. JQZ and JSC
lysis, RT-qPCR was used to validate the differentially participated in the experiments. JLL and ZW participated in sequencing data
submission and manuscript revision. All authors have read revised the
expressed genes related to anthocyanin biosynthesis [59]. manuscript and approved the final manuscript.
We used a fluorescence quantitative Kit (2×SYBR ® green
premix) and an analytikjena-qTOWER 2.2 fluorescence Funding
The high throughput sequencing, the editing and publishing fee were
quantitative PCR instrument for quantitative analysis. financially supported by the National Natural Science Foundation of China
The primer sequences can be found in Additional file 7: (No. 32060692) and the Science and Technology Development project of
Table S6. The reaction procedure was as follows: 95 ℃ Jilin province (No. 20200402112 NC). The funding agencies were not
involved in the experimental design of the study, data collection, analysis
for 3 min, 95 ℃ for 10 s, 58 ℃ for 30 s, for a total of 39 and interpretation or writing the manuscript.
cycles. Melt curve analysis (60 ℃ ~ 95 ℃ +1 ℃ / cycle,
holding time 4 s), and carried out centrifugation on PCR Availability of data and materials
plate centrifuge at 4 ℃ 6000 rpm for 30 s. Finally, we Raw-reads data were deposited in the NCBI Sequence Read Archive (SRA)
with accession number of PRJNA596335. The Transcriptome Shotgun
put it in quantitative PCR for amplification, using Assembly project has been deposited at DDBJ/EMBL/GenBank under the
c110191.graph_c0 as an internal reference gene. accession GJBB00000000.
Statistical analysis Declarations
The procedure was repeated three times for each sample Ethics approval and consent to participate
and the relative expressions were calculated using the The plants under this study are not rare or endangered. The samples were
2−ΔΔCt method. Excel and GraphPad Prism 5 were used collected in their wild populations in non-protected areas; no any legal
authorization/license is required.
for chart preparation. The R-3.4.2 was used to conduct
the heatmap. Consent for publication
Not Applicable.
Abbreviations
HPLC: High-performance liquid chromatography; ESI-MS/MS: Electrospray Competing interests
ionization tandem mass spectrometry; COG: Clusters of orthologous groups; The authors declare that they have no competing interests.
Go: Gene Ontology; NCBI: The US National center for biotechnology
information; NR: Non-redundant protein sequence database; KOG: Clusters of Received: 11 August 2020 Accepted: 14 May 2021
orthologous groups for eukaryotic complete genomes; PAL: Phenylalanine
ammonia-lyase; CHS: Chalcone synthase; CHI: Chalcone isomerase;
F3H: Flavone 3-hydroxylase; F3’H: Flavonoid 3’-hydroxylase; F3’5’H: Flavonoid
References
3’5’-hydroxylase; DFR: Dihydroflavonol reductase; ANS: Anthocyanidin
1. Dai SL, Huang H, Fu JX, Hong Y. Advances in molecular breeding of
synthase; GT: Glucosyltransferase; eggnog: Evolutionary genealogy of
ornamental plants. Chinese Bull Bot. 2013;48:589–607. https://doi.org/10.3
genes:Non-supervised Orthologous Groups; KEGG: Kyoto Encyclopedia of
724/SP.J.1259.2013.00589.
Genes and Genomes; DEG: Differentially expressed genes;
2. Sjöman H, Hirons AD, Bassuk NL. Urban forest resilience through tree
MT: Methyltransferase; qRT-PCR: Quantitative real-time reverse transcription
selection-variation in drought tolerance in Acer. Urban For Urban Gree.
PCR
2015;14:858–65. https://doi.org/10.1016/j.ufug.2015.08.004.
3. Li XM. Physiological characters of Pyracantha fortuneana ‘Harlequin’ leaves
Supplementary Information during color-changing period in autumn and winter. J. Shanghai Jiaotong
The online version contains supplementary material available at https://doi. U. (Agr Sci). 2013; 31: 82–7.
org/10.1186/s12864-021-07715-x. 4. Ren J, Chen Z, Tang F, Xuan Y, Yang F, Lu XY, Fu SL. Study on leaf color
related chemicals components based on comparing Acer rubum L. cv.
‘Yanhong’ and ‘Jinseqiutian’. J Anhui Agr U. 2019;46:420–5. https://doi.org/1
Additional file 1: Table S1. Statistics of sequencing data across the 0.13610/j.cnki.1672-352x.20190716.007.
nine libraries in A. pseudosieboldianum. 5. Li YK, Fang JB, Qi XJ, Lin MM, Zhong YP, Sun LM, Cui W. Combined analysis
Additional file 2: Figure S1. COG classifications of annotated unigenes. of the fruit metabolome and transcriptome reveals candidate genes
Additional file 3: Table S2. KEGG pathway annotation in A. involved in flavonoid biosynthesis in Actinidia arguta. Int J Mol Sci. 2018;19:
pseudosieboldianum unigenes. 1471. https://doi.org/10.3390/ijms19051471.
6. Song XW, Wei XB, Di SK, Pang YZ. Recent advances in the regulation
Additional file 4: Table S3. KEGG pathway enrichment analysis of mechanism of transcription factors and metabolic engineering of
DEGs between B and M. anthocyanins. Chinese Bull Bot. 2019;54:133–56. https://doi.org/10.11983/
Additional file 5: Table S4. KEGG pathway enrichment analysis of CBB18016.
DEGs between B and A. 7. Hu JT, Chen GP, Zhang YJ, Cui BL, Yin WC, Yu XH, Zhu ZG, et al.
Anthocyanin composition and expression analysis of anthocyanin
Additional file 6: Table S5. MYBs identified in differentially expressed
genes. biosynthetic genes in kidney bean pod. Plant Physio Bioch. 2015;97:304–12.
https://doi.org/10.1016/j.plaphy.2015.10.019.Gao et al. BMC Genomics (2021) 22:383 Page 11 of 12
8. Li BB, Hou ZX, Yang JF, Chen L, Wan RM. Variations of flavonoids and 28. Kodama M, Brinch-Pedersen H, Sharma S, Holme IB, Joernsgaard B,
soluble sugars in ‘Northland’ blueberry leaf during the color changing Dzhanfezova T, Amby DB, et al. Identification of transcription factor genes
process. J Agr Sci Technol. 2018;20:20–9. https://doi.org/10.13304/j.nykjdb.2 involved in anthocyanin biosynthesis in carrot (Daucus carota L.) using RNA-
017.0210. SEq. BMC Genomics. 2018;19:811. https://doi.org/10.1186/s12864-018-5135-6.
9. Feng FJ, Li MJ, Ma FW, Cheng LL. Phenylpropanoid metabolites and 29. Qu Y, Ou Z, Yang FS, Wang S, Peng JS. The study of transcriptome
expression of key genes involved in anthocyanin biosynthesis in the shaded sequencing for flower coloration in different anthesis stages of alpine
peel of apple fruit in response to sun exposure. Plant Physiol Bioch. 2013;69: ornamental herb (Meconopsis ‘Lingholm’). Gene. 2018;689:220–6. https://doi.
54–61. https://doi.org/10.1016/j.plaphy.2013.04.020. org/10.1016/j.gene.2018.12.017.
10. Zhang HS, Tian H, Chen MX, Xiong JB, Cai H, Liu Y. Transcriptome analysis 30. Fang Z, Zhou DR, Ye XF, Jiang CC, Pan SL. Identification of candidate
reveals potential genes involved in flower pigmentation in a red-flowered anthocyanin-related genes by transcriptomic analysis of ‘Furongli’ Plum
mutant of white clover (Trifolium repens L.). Genomics. 2018;110:191–200. (Prunus salicina Lindl.) during fruit ripening using RNA-SEq. Front. Plant Sci.
https://doi.org/10.1016/j.ygeno.2017.09.011. 2016;7:1338. https://doi.org/10.3389/fpls.2016.01338.
11. Wu Q, Wu J, Li SS, Zhang HJ, Feng CY, Yin DD, Wu RY, et al. Transcriptome 31. Shi LY, Chen X, Chen W, Zheng YH, Yang ZF. Comparative transcriptomic
sequencing and metabolite analysis for revealing the blue flower formation analysis of white and red Chinese bayberry (Myrica rubra) fruits reveals
in waterlily. BMC Genom. 2016;17:897. https://doi.org/10.1186/s12864-01 flavonoid biosynthesis regulation. Sci Hortic. 2018;235:9–20. https://doi.org/1
6-3226-9. 0.1016/j.scienta.2018.02.076.
12. Valentina S, Maja MP, Franci S, Vlasta C. Phenolic accumulation in hybrid 32. Chen Z, Lu XY, Xuan Y, Tang F, Wang JJ, Shi D, Fu SL, et al. Transcriptome
primrose and pigment distribution in different flower segments. J Am Soc analysis based on a combination of sequencing platforms provides insights
Hortic sci. 2017;142:192–9. https://doi.org/10.21273/JASHS04038-17. into leaf pigmentation in Acer rubrum. BMC Plant Biol. 2019;19:240. https://
13. Jia ZD, Ma PY, Bian XF, Yang Q, Guo XD, Xie YZ. Biosynthesis metabolic doi.org/10.1186/s12870-019-1850-7.
pathway and molecular regulation of plants anthocyanin. Acta Bot Boreal- 33. Jiang HB, Xia LF, Tian YP, Dai WD, Sun YN, Chen LB. Transcriptome analysis
Occident Sin. 2014;34:1496–506. https://doi.org/10.7606/j.issn.1000-4025.2 of anthocyanin synthesis related genes in purple bud tea plant. J Plant
014.07.1496. Genet Resour. 2018;19:967–78. https://doi.org/10.13430/j.cnki.jpgr.2018012
14. Wang W, Zheng W, Xu XD, Chen J, Wang TX. Coloring mechanism analysis 6001.
of mosaic leaves in Camellia reticulata Lindl. based on sequencing of 34. Rosati C, Cadic A, Duron M, Ingouff M, Simoneau P. Molecular
transcriptome. Acta Bot Boreal Occident Sin. 2017;37:1720–1727. https://doi. characterization of the anthocyanidin synthase gene in
org/10.7606/j.issn.1000-4025.2017.09.1720. Forsythis×intermedia reveals organ-specific expression during flower
15. Duan YJ, Zhang LG, He Q, Zhang MK, Shi JC. Expression of transcriptional development. Plant Sci. 1999;149:73–9. https://doi.org/10.1016/S0168-9452
factors and structural genes of anthocyanin biosynthesis in purple-heading (99)00146-6.
Chinese Cabbage. Acta Hortic Sin. 2012;39:2159–67. https://doi.org/10.1642 35. Masukawa T, Cheon KS, Mizuta D, Kadowaki M, Nakatsuka A, Kobayashi N.
0/j.issn.0513-353x.2012.11.012. Development of mutant RsF3′H allele-based marker for selection of purple
16. Liu XF, Li F, Yin XR, Xu CJ, Chen KS. Recent advances in the transcriptional and red root in radish (Raphanus sativus L.var. longipinnatus L.H.Bailey).
regulation of anthocyanin biosynthesis. Acta Hortic Sin. 2013;40:2295–306. Euphytica. 2019;215:119. https://doi.org/10.1007/s10681-019-2442-1.
https://doi.org/10.3969/j.issn.0513-353X.2013.11.023. 36. Holton TA. Cornish EC. Genetics and biochemistry of anthocyanin
17. Shi Q, Li X, Du J, Li X. Anthocyanin synthesis and the expression patterns of biosynthesis. Plant Cell. 1995;7:1071–83. https://doi.org/10.1105/tpc.7.7.1071.
bHLH transcription factor family during development of the Chinese jujube 37. Springob K, Nakajirna J, Yamazaki M, Saito K. Recent advances in the
fruit (Ziziphus jujuba Mill.). Forests. 2019;10:346. https://doi.org/10.3390/f1004 biosynthesis and accumulation of anthocyanins. Nat Prod Rep. 2003;20:288–
0346. 303. https://doi.org/10.1039/b109542k.
18. Grace SC, Logan BA, Adams WW. Seasonal differences in foliar content of 38. Menssen A, Hohmann S, Martin W, Schnable PS, Peterson PA, Saedler H,
chlorogenic acid a phenylpropanoid antioxidant in Mahonia repens. Plant Gierl A. The En/Spm transposable element of Zea mays contains splice sites
Cell Environ. 1998;21:513–21. https://doi.org/10.1046/j.1365-3040.1998.00282. at the temini generating a novel intron from a dSpam element in the A2
x. gene. Embo J. 1990;9:3051–7. https://doi.org/10.1002/j.1460-2075.1990.
19. Zhang X, Xiao TT, Li J, Wang YT, Liu GL. Effects of water stress on the tb07501.x.
growth and leaf color in Acer rubrum. Jiangsu Agricultural Sciences. 2016;44: 39. Li JC, Li TH, Wang ZG, Li BJ. Cloning and expression of UFGT gene in skin of
224–7. max red Bartlett. Acta Botanica Boreali-Occidentalia Sinica. 2010;30:30–4.
20. Oberbauer SF, Starr G. The role of anthocyanins for photosynthesis of 40. Kobayashi S, Ishimaru M, Ding CK, Yakushiji H, Goto N. Comparison of UDP-
alaskan arctic evergreens during snowmelt. Adv Bot Res. 2002;37:129–45. glucose: flavonoid 3-O-glucosyltransferase(UFGT) gene sequences between
https://doi.org/10.1016/S0065-2296(02)37047-2. white grapes (Vitis vinifera) and their sports with red skin. Plant Sci. 2001;
21. Sun B, Zheng DC, Cui HM. Leaf color change in Acer pseudo-sieboldianum in 160:543–50. https://doi.org/10.1016/S0168-9452(00)00425-8.
autumn. J Northeast For U. 2009;37:14–15. https://doi.org/10.3969/j.issn.1 41. Toki K, Saito N. Irie Y. Tatsuzawa F. Shigihara A. Honda T. 7-O-Methylated
000-5382.2009.02.006. anthocyanidin glycosides from Catharanthus roseus. Phytochemistry. 2008;
22. Pang QY, Zhuo LH. Spatial difference in physiological indexes of autumn 69:1215–9. https://doi.org/10.1016/j.phytochem.2007.11.005.
colored maple leaves. J Northeast For U. 2007;35:16–7. https://doi.org/10.3 42. Schmitzer V, Stampar F, Veberic R, Osterc G. Phase change modifies
969/j.issn.1000-5382.2007.06.006. anthocyanin synthesis in Acer palmatum Thunb. (Japanese maple) cultivars.
23. Qu X, Sun B, Yang YH. Leaf color performance and its application of Acta Physiol Plant. 2009;31:415–8. https://doi.org/10.1007/s11738-008-023
introduced A. pseudosieboldianum. Terrttory Nat Resour Study. 2012;4:86–8. 7-4.
https://doi.org/10.16202/j.cnki.tnrs.2012.04.018. 43. Cai XY, Li HH, Li L, Yu H, Chen G, Bao NNDT. Pigment composition and leaf
24. Xian Y, Dong X, Xie XM, Wu D, Han B, Wang Y. Effect of conservation color change in Acer palmatum. J Northeast For U. 2015;43:63–7. https://doi.
conditions on restricting conservation of Acer rubrum cv. ‘Somerset’. Chinese org/10.3969/j.issn.1000-5382.2015.07.015.
Bull Bot. 2019;54:64–71. https://doi.org/10.11983/CBB18010. 44. Kanehisa M, Goto S, Kawashima S, Okuno Y, Hattori M. The KEGG resource
25. Wang YS, Wang H, Fan ZY, Chen Y, Jin YF, ,Gao ML. Identifying genes for deciphering the genome. Nucleic Acids Res. 2004;32:277–80. https://doi.
associated with leaf color in kale (Brassica oleracea L. var. acephala DC.) org/10.1093/nar/gkh063.
based on transcriptome analysis. Genom Appl Biol. 2020;39:200–206. https:// 45. Grabherr MG, Haas BJ, Yassour M, Levin JZ, Thompson DA, Amit I, Adiconis X, et al.
doi.org/10.13417/j.gab.039.000200. Full-length transcriptome assembly from RNA-Seq data without a reference
26. Jiang Y, Wang Q, Shen QQ, Zhuo BP, He JR. Transcriptome analysis reveals genome. Nat Biotechnol. 2011;29:644–52.https://doi.org/10.1038/nbt.1883.
genes associated with leaf color mutants in Cymbidium longibracteatum. Tree 46. Deng YY, Li JQ, Wu SF, Zhu YP, Chen YW, He FC. Integrated nr database in
Genetics Genomes. 2020;16:44. https://doi.org/10.1007/s11295-020-01440-4. protein annotation system and its localization. Comput Eng. 2006;32:71–4.
27. Rong LP, Li QZ, Li SS, Tang L, Wen J. De novo transcriptome sequencing of https://doi.org/10.3969/j.issn.1000-3428.2006.05.026.
Acer palmatum and comprehensive analysis of differentially expressed 47. Apweiler R, Bairoch A, Wu CH, Barker WC, Boeckmann B, Ferro S, Gasteiger
genes under salt stress in two contrasting genotypes. Mol Genet Genom. E, et al. UniProt: the Universal Protein knowledgebase. Nucleic Acids Res.
2016;291:575–86. https://doi.org/10.1007/s00438-015-1127-2. 2004;32:115–9. https://doi.org/10.1093/nar/gkh131.Gao et al. BMC Genomics (2021) 22:383 Page 12 of 12
48. Ashburner M, Ball CA, Blake JA, Botstein D, Butler H, Cherry JM, Davis AP,
et al. Gene ontology: tool for the unification of biology. Nat Genet. 2000;25:
25–9. https://doi.org/10.1038/75556.
49. Tatusov RL, Galperin MY, Natale DA, Koonin EV. The COG database: a tool
for genome scale analysis of protein functions and evolution. Nucleic Acids
Res. 2000;28:33–6. https://doi.org/10.1093/nar/28.1.33.
50. Koonin EV, Fedorova ND, Jackson JD, Jacobs AR, Krylov DM, Makarova KS,
Mazumber R, et al. A comprehensive evolutionary classification of proteins
encoded in complete eukaryotic genomes. Genome Biol. 2004;5:R7. https://
doi.org/10.1186/gb-2004-5-2-r7.
51. Huerta-Cepas J, Szklarczyk D, Forslund K, Cook H, Heller D, Walter MC,
Ratteri T, et al. eggNOG 4.5: a hierarchical orthology framework with
improved functional annotations for eukaryotic prokaryoticand viral
sequences. Nucleic Acids Res. 2016;44:286–93. https://doi.org/10.1093/nar/
gkv1248.
52. Altschul SF, Madden TL, Schaffer AA, Zhang J, Zhang Z, Miller W, Lipman DJ.
Gapped BLAST and PSI BLAST: A newgeneration of protein database search
programs. Nucleic Acids Res. 1997;25:3389–402. https://doi.org/10.1093/na
r/25.17.3389.
53. Xie C, Mao XZ, Huang JJ, Ding Y, Wu JM, Dong S, Kong L, et al. KOBAS 2.0: a
web server for annotation and identification of enriched pathways and
diseases. Nucleic Acids Res. 2011;39:316–22. https://doi.org/10.1093/nar/gkr4
83.
54. Eddy SR. Profile hidden Markov models. Bioinformatics. 1998;14:755–63.
https://doi.org/10.1198/016214502388618870.
55. Finn RD, Bateman A, Clements J, Coggill P, Eberhardt RY, Eddy SR, Heger A,
et al. Pfam: the protein families database. Nucleic Acids Res. 2014;42:222–30.
https://doi.org/10.1093/nar/gkt1223.
56. Langmead B, Pop M. Ultrafast and memory-efficient alignment of short
DNA sequences to the human genome. Genome Biol. 2009;10:R25. https://
doi.org/10.1186/gb-2009-10-3-r25.
57. Li B, Dewey CN. RSEM: accurate transcript quantification from RNA-Seq data
with or without a reference genome. BMC Bioinformatics. 2011;12:323.
https://doi.org/10.1186/1471-2105-12-323.
58. Trapnell C, Williams BA, Pertea G, Mortazavi A, Kwan G, Baren MJ, Salzberg
SL, et al. Transcript assembly and quantification by RNA seq reveals
unannotated transcripts and isoform switching during cell differentiation.
Nat Biotechnol. 2010;28:511–5. https://doi.org/10.1038/nbt.1621.
59. Pfaffl MW. A new mathematical model for relative quantification in real-time
RT-PCR. Nucleic Acids Res. 2001;29:e45. https://doi.org/10.1093/nar/29.9.e45.
Publisher’s Note
Springer Nature remains neutral with regard to jurisdictional claims in
published maps and institutional affiliations.You can also read


