Deal Trends in Latin America - S&P Global
←
→
Page content transcription
If your browser does not render page correctly, please read the page content below
Deal Trends in Latin America

March 2019 | Issue Number 9
Table of Contents

Deal Trends in Latin America

Deal Activity in Latin America……………..…………..…………………………..                           4
          Year-Over-Year Trends by Country………………............................      5
          2018 Top M&A Deals………….………………....................................       6
          Sector Trends Year-Over-Year……..………………………………….                          7
          Year-Over-Year by Largest Subsector…………..............................   8
          Cross-Border Intraregional Deals………………..............................    9
          Cross-Border Deal Count………………………….............................          10
Key Metrics On Select Countries…………………….…………..….……….……                            12
Currency Spotlight……………………………………………………………………                                      13
Data Dispatch: Latin America………………………………………………………                                 14
Panjiva Supply Chain Research: Analyzing LatAm Export Data…………….                  15
Behind the Data……………………………………………………………………….                                       16

                                                                                       2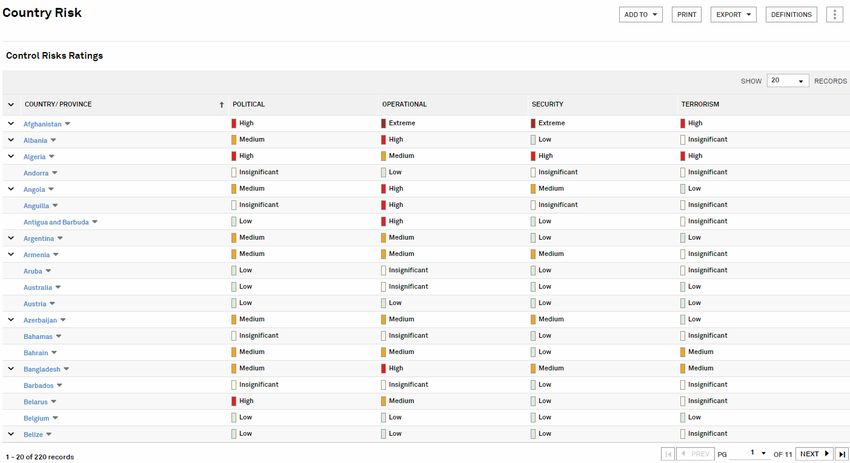
Editors’ Note
Deal Trends in Latin America is a publication brought to you by S&P Global Market Intelligence that                                            Contributors:
explores deal activity in Argentina, Brazil, Chile, Colombia, Ecuador, Mexico, Panama, Peru, Uruguay,
and Venezuela.                                                                                                                                 Brandon Newland
                                                                                                                                               bnewland@spglobal.com
                                                                                                                                               Market Development
For analysis contained in this report, data was collected on M&A and private placements in these                                               Private Equity Solutions
countries between Q1 2015 and Q4 2018. We also examined trends in various industries, cross-border                                             S&P Global Market Intelligence
activity, currencies, and assessed macroeconomic conditions in the region.

Key Highlights:                                                                                                                                Andrei Tratseuski
                                                                                                                                               atratseuski@spglobal.com
                                                                                                                                               Market Development
•     Latin American deal volume fell 3.9% in calendar year 2018 vs. calendar year 2017, with 818 announced                                    Private Equity Solutions
      transactions with deal value greater than $0 for the year.                                                                               S&P Global Market Intelligence

•     Transaction value across Latin America fell by 21.4% to $85B USD in 2018, the lowest annual amount
      since the financial crisis.                                                                                                              Kevin Zacharuk
                                                                                                                                               kevin.zacharuk@spglobal.com
•     Brazil continues to be the most active region by volume and value, announcing 328 transactions worth                                     Market Development
      over $49B USD. Six transactions in Brazil surpassed $1B USD in calendar year 2018, three fewer than in                                   Private Equity Solutions
                                                                                                                                               S&P Global Market Intelligence
      calendar year 2017. Brazil hosted 43% of all deals over $1B USD in Latin America in 2018.

•     The Materials sector was the largest driver of M&A activity in the region at $26.6B USD, comprising 24%                                  Katherine Mitchell
      of Latin American transaction value in 2018. Three transactions in the sector surpassed $1B USD,                                         katherine.mitchell@spglobal.com
      contributing to a nearly 4x increase in year-over-year deal value.                                                                       Marketing Manager
                                                                                                                                               Private Equity Solutions
•     Transactions in the Information Technology sector rose for the third consecutive year in Latin America,                                  S&P Global Market Intelligence
      falling behind only the Materials sector in deal count for calendar year 2018. Of aggregate transaction
      volume in the region, Information Technology drove 14.5% of deals, up from 9.9% in 2015.

•     Suzano Pepel e Celulose’s acquisition of Fibria Celulose in Q1, valued at $17.4B USD, is the largest Latin
      American transaction of 2018 and the second largest Latin American transaction since 7/1/2014.

*Data pulled for this report is as of January 15th, 2019. Transactions must be classified as an active (not cancelled), private placement or
M&A with an associated transaction value greater than $0. All references of Latin America and transactions mentioned refer to targets
located in Mexico, Central America, or South America. For more information on our methodologies, please e-mail
marketobservations@spglobal.com.

                                                                                                                                                                                3
Deal Activity in Latin America
A busy year at the polls
hampers 2018 transactions
Time spent at the ballot box in 2018 brought
significant change to political powers in prominent
Latin American countries, most notably Brazil and
Mexico. Already a primary risk for the region, the
uncertainty around changing political and economic
regimes further contributed to a softer deal market in
both deal value and volume. This ultimately led to Q4
seeing the lowest quarterly deal volume since the
first quarter of 2016. The calendar year finished with
818 transactions across the entire region, a 3.9%
decrease from announced or completed transactions
in 2017.
Aggregate transaction value in 2018 declined 21%
from 2017, despite finishing January through June
ahead of 2017’s first half deal value. In the latter half
of the year, Q3 and Q4 could not maintain
momentum and produced back-to-back soft results,
resulting in the lowest two consecutive quarters in
more than five years. Although the calendar year
declined in deal value, 2017 was an exceptionally
strong year and 2018 still produced deal values
higher than both 2015 and 2016. The year finished
with aggregate deal value of $85.3B across all
sectors and countries within Latin America.
*Source: S&P Capital IQ platform as of January 15th, 2019
4Deal Activity in Latin America: YoY Trends by Country
Deal Value by Country (2015 - 2018 LTM1) Brazil’s transaction value fell substantially in 2018 as three fewer $1B+ deals were
announced versus calendar year 2017. The drop is not indicative of a concerning decline, as
$70,000
Latin America’s second largest economy still hosted six transactions surpassing $1B and
$60,000 had strong support from sub-$1B transactions. Ultimately, the region completed $49B worth
of transactions in 2018.
$50,000
USD ($mm)
$40,000 In Mexico, ongoing NAFTA concerns were partially alleviated in the early quarters of 2018
before eventually being signed in November. While this helped alleviate some concern,
$30,000
pending ratification from participating governments may present ongoing resistance to a
$20,000 healthy deal market. Overall transaction value still ticked up 16% to $10.4B.
$10,000
Chile saw strong growth for the second consecutive year with a 44% surge in deal value on
$0 top of 2017, a year where deal value more than doubled. Political change and economic
concerns appear to be behind the country as growth and stability are now supporting a
favorable M&A market.
2015 2016 2017 2018
In 2018, only Chile, Colombia, and Peru saw an increase in deal volume from 2017 with Deal Volume by Country (2015 - 2018 LTM)
all other countries seeing less activity. Brazil and Mexico saw the smallest declines in 0 100 200 300 400
activity with reductions of 9.6% and 8.3% respectively. These two countries play a pivotal
Argentina
role in the health of the market, jointly contributing 55% of all transactions, down from
60.6% in 2017. Brazil
Chile
The region’s third largest economy, Argentina, struggled in 2018 with inflation nearing Colombia
50% and a deteriorating peso. Surprisingly, the economy still produced 81 transactions, Ecuador
only a slight decline from the 96 transactions a year prior. President Mauricio Macri, with
Mexico
the additional support of the IMF, will need to continue to combat external risks, such as
Panama
rising rates in the United States, to help manage ongoing currency and inflation risks.
Peru
Venezuela, after defaulting on interest payments in 2017, has failed to improve their Uruguay
long-term foreign currency rating of SD issued by S&P Ratings. The country will need to Venezuela
address political and economic concerns before realization of rich oil reserves becomes 2015 2016 2017 2018
a feasible activity.
*Source: S&P Capital IQ platform as of January 15th , 2019
1 Represents period of Last-Twelve-Months
5M&A Activity in Latin America:
Top Deals (Announced or Closed) January 1, 2018 – December 31, 2018
Total Implied Implied
Implied Implied Equity
Announced Transaction Enterprise Enterprise
Closed Date Target/Issuer Headquarters Primary Industry (Target) Buyers/Investors Enterprise Value/LTM Net
Date Value Value/EBITDA Value/Revenue
Value/EBIT Income (x)
($USDmm) (x) (x)
Suzano Papel e
03/12/2018 01/14/2019 Fibria Celulose S.A. Brazil Paper Products Celulose S.A. 10.7 4.3 19.5 31.0
17,377.1
(BOVESPA:SUZB3)*
Boeing Brasil Serviços
Commercial Aircraft
07/05/2018 - Brazil Aerospace and Defense Técnicos Aeronáuticos - - - -
Operations of Embraer 4,200.0
Ltda
Sociedad Química y Tianqi Lithium
Fertilizers and Agricultural
05/17/2018 12/03/2018 Minera de Chile S.A. Chile Corporation 19.5 8.0 26.4 39.0
Chemicals 4,066.2
(NYSE:SQM) (SZSE:002466)
Eletropaulo Metropolitana Enel Brasil
04/17/2018 07/04/2018 Eletricidade de São Paulo Brazil Electric Utilities Investimentos 10.3 0.7 21.7 -
2,982.5
S.A. (BOVESPA:ELPL3) Sudeste, S.A.
Somos Educação S.A. Saber Serviços
04/23/2018 10/11/2018 Brazil Education Services 18.2 3.9 19.4 142.0
(BOVESPA:SEDU3) Educacionais S.A. 2,064.0
Data Processing and Digital Realty Trust,
09/24/2018 12/20/2018 Ascenty Ltda. Brazil - - - -
Outsourced Services L.P. 1,826.8
Integrated Fintech Telecom, LLC;
Telecom Argentina S.A.
06/21/2018 - Argentina Telecommunication Cablevisión Holding 11.9 4.5 17.6 32.5
(BASE:TECO2) 1,812.7
Services S.A. (BASE:CVH)
Vega Solar 6, S.A.P.I. de Atlas Renewable
04/02/2018 03/28/2018 Mexico Renewable Electricity - - - -
C.V. Energy 1,300.0
10/07/2018 12/13/2018 Cable Onda, S.A. Panama Cable and Satellite Millicom LIH, S.A 8.8 3.8 15.9 21.1
1,261.1
Compressor Business of Nidec Corporation
04/04/2018 - Brazil Industrial Machinery - - - -
Whirlpool Corporation (TSE:6594) 1,261.5
This chart includes the top 10 deals in Latin America by Total Transaction Value in USD between 2017 and 2018. Brazil continues to host the majority of the largest deals across multiple sectors. All deals
except for Digital Realty Trusts’ acquisition of Ascenty represent strategic acquisitions.
M&A Activity in Latin America is sorted by largest transaction values in USD. Data was derived from S&P Capital IQ platform as of January 15th, 2019.
6Deal Activity in Latin America: Sector Trends YoY
Materials sector surges, core industries show stability
The Materials sector swelled in 2018 with three transactions Deal Value by Sector (2015 - 2018 LTM)
surpassing $1B USD, collectively contributing 8% of the
sector’s annual deal value. As a whole, the sector’s deal $40,000
value grew nearly 4x in 2018, while volume saw a marginal $35,000
3% drop. Materials led all other sectors in both deal value $30,000
USD ($mm)
and volume in 2018. Across the entire region, 24% of deal $25,000
value and 15.7% of deal volume came from the Materials $20,000
sector. $15,000
$10,000
Financials and Industrials, both leading sectors for M&A $5,000
activity, each contributed $10B of transactions in 2018, $0
jointly representing 18% of Latin America’s deal value. The
steep decline in deal value from 2017 to 2018 for the
Financials sector can be attributed to the record setting
$21.1B Vale/Valepar transaction in 2017.
2015 2016 2017 2018
While Information Technology has never been a prominent
driver of deal value, deal volume has been on the rise and
surpassed all but the Materials sector, making it the second Deal Volume by Sector (2015 - 2018 LTM)
most active sector in Latin America. Of the 113 Information 0 20 40 60 80 100 120 140 160 180
Technology transactions in 2018, 60% were located in Consumer Discretionary
Brazil, a 40% increase from Brazil’s 2014 investment into Consumer Staples
the sector. Energy
Financials
Utilities deal value fell 61.3% after leading all sectors in both Health Care
2016 and 2017, excluding impacts of Vale/Valepar’s Industrials
transaction. The absence of any Utility transaction over $3B Information Technology
in 2018 was a first in three years. Despite the fall in deal Materials
value, Utilities is the only sector to see four consecutive Real Estate
Communication Services
years of increasing deal volume.
Utilities
2015 2016 2017 2018
*Source: S&P Capital IQ platform as of January 15th, 2019
7Deal Activity in Latin America: YoY by Largest Subsector
Deal Highlights
Deal Volume by Primary Industry (2015 - 2018 LTM)
0 20 40 60 80 100 120 Within the Information Technology sector, the
Application Software industry represented
2015 66.4% of the sector’s activity in 2018. Growth
within the industry will be an important trend to
2016
monitor as the foundations of a technology
2017
hub within Latin America begin to emerge.
2018 Real Estate Operating Companies continues
to drive a large volume of transactions despite
Real Estate Operating Companies Application Software Diversified Metals and Mining the broader sector being a relatively small
Packaged Foods and Meats Interactive Media and Services Renewable Electricity contributor of regional deal value. Nearly 80%
Gold Asset Management and Custody Banks Electric Utilities of these investments are within the more
Internet and Direct Marketing Retail mature countries – Brazil and Mexico – as
such opportunities are fewer and less
Deal Value by Primary Industry (2015 - 2018 LTM) structured in other countries.
$20,000
After three consecutive years of growth in deal
$16,000 value for Renewable Electricity, 2018 saw a
USD ($mm)
$12,000 weakening of 37.8%. While there are fewer
$8,000 funds flowing to renewables, transactions
continue to occur at a healthy clip with the
$4,000
number of deals increasing 22.2% in 2018.
$0
Brazil hosted 15 of 33 renewable transactions
while Chile and Argentina saw their third
consecutive year of increasing sector deals
with eight and five, respectively.
2015 2016 2017 2018
*Source: S&P Capital IQ platform as of January 15th, 2019
8Deal Activity in Latin America:
Cross-Border Intraregional Deals
Deal Highlights
In 2018, 89.0% of transactions were intra-country, slightly below the four year average of 90.9%. Brazil is the largest driver of the long-
term average as 96.5% of all transactions involving Brazilian firms took place within Brazil. On the lower end of the spectrum, 81.0%
and 86.8% of transactions in Colombia and Mexico, respectively, were intra-country. Uruguay is the rare exception in that seven of
eight transactions were acquisitions of Argentinean companies by Uruguay-based companies. With upwards of 40% of Latin American
transactions occurring in Brazil, intra-country deals, led by Brazil, will remain a prominent factor for regional M&A activity.
Current Year
Latin America Buyers Into Latin America Targets
(January 1, 2015 – December, 2018)
BUYER COUNTRIES Deal Volume Key:
Argentina Brazil Chile Colombia Mexico Peru Uruguay
TARGET COUNTRY
Argentina = 0 to 5 deals
Brazil = 6 to 25 deals
= 26 to 50 deals
Chile
= 51 to 100 deals
Colombia
=101 to 200 deals
Mexico
= 201 to 300 deals
Peru
= 300+ deals
Uruguay
*Source: S&P Capital IQ platform as of January 15th, 2019
9Deal Activity in Latin America: Cross-Border Deal Count
TOP TWO FOREIGN INVESTORS (DEAL WHO’S BUYING INTO LATIN AMERICA AND IN WHICH
SECTORS?
VOLUME INTO LATIN AMERICA TARGETS Canada showed a strong interest in the Materials sector in
(January 1, 2018 – December 31, 2018) 2018; of the 59 acquisitions of Latin American companies
by Canadian entities, 28 were in the Materials sector.
Health Care and Energy followed Materials with twelve and
Industrials – 2 nine acquisitions, respectively.
Consumer Discretionary – 7
Energy – 6 The United States is a more diverse investor in Latin
Materials – 7
America than Canada, with no sector receiving more than
20% of overall U.S. acquisitions. The previously noted
growth in the Information Technology sector is strongly
supported by the U.S. It’s clear that U.S. investors have
preferred industries within each country, although 60% of
Financials – 3 their acquisitions are of Brazilian or Mexican companies.
Materials – 4
Financials – 10
Materials – 2
Materials – 5
2018 Totals
Mexico
Colombia Information Technology – 4 Canada: 59 Transactions
Peru Materials – 6
Brazil United States: 170 Transactions
Chile Materials – 4
Argentina
Source: S&P Capital IQ platform, data as of January 15th, 2019. Numbers represent deal volume in that sector.
10Latin America Key Metrics & Financials Sector Analysis
11Key Metrics by Country
While 2018 saw significant time spent at the polls, the impact of new leadership will not be known until further into 2019. Argentina and Venezuela,
facing headwinds of their own, were the only two regions to see GDP declines as they grapple with inflation and subsequent issues. The remaining
countries built upon the stability and growth found in 2017, furthering the recovery from a depressed 2016. Growth in integral countries of Brazil and
Mexico is expected to be consistent in 2019, bringing steadiness to the broader region.
Argentina Brazil Chile Colombia Ecuador Mexico Panama Peru Uruguay Venezuela
COUNTRY
S&P Sovereign
Rating Long-
Term foreign
B BB- A+ BBB- B- BBB+ BBB BBB+ BBB SD
currency
S&P Sovereign
Rating Long-term B B AA- BBB B- A- BBB A- BBB CCC-
local currency
SNL Country
Political Risk Medium Medium Low Low High Low Low Medium Low High
Score
Nominal GDP
(USD$B)
455.1B 1,176.5B 153.5B 334.2B 102.8B 1,208.0B 60.4B 228.2B 60.7B 329.5B
2018 GDP Growth
Rate (%)
(2.20) 1.2 4.0 2.6 2.0 2.2 5.0 3.7 3.0 (16.0)
Unemployment
Rate (%)
8.9% 11.4% 6.4% 9.6% 4.5% 3.5% 5.6% 5.8% 7.4% 16.2%
CPI Growth (%) 39.9% 3.8% 3.1% 2.8% 1.4% 4.5% 0.7% 2.3% 7.6% NA
Budget Balance/
GDP%
(3.3)% (5.8)% (1.8)% (2.0)% (3.7)% (2.5)% (0.6)% (2.0)% (2.4)% (8.6)%
GDP per Capita($) 9,600 8,895 16,431 6,618 6,195 8.820 16,136 6,918 17,686 NA
*Source: S&P Global Market Intelligence as of January 15, 2019. Latest available quarterly data in $bns. Credit ratings are provided by S&P Global Ratings, which is analytically and
editorially independent from any other analytical group at S&P Global. An obligor rated 'SD' (selective default) or 'D' is in default on one or more of its financial obligations including rated and
unrated financial obligations but excluding hybrid instruments classified as regulatory capital or in non-payment according to terms.
12Currency Spotlight
Brazil vs. Mexico vs. Argentina FX Performance (2018)
20%
10%
0%
FX Change (%)
-10%
-20%
-30%
-40%
-50%
-60%
1/1/2018 2/1/2018 3/1/2018 4/1/2018 5/1/2018 6/1/2018 7/1/2018 8/1/2018 9/1/2018 10/1/2018 11/1/2018 12/1/2018
$USDARS $USDBRL $USDMXN
Argentina Brazil Mexico
760,000 -4.5% 1,210,000 0.5% 1,210,000 0.5%
1,200,000 1,200,000
740,000 -5.0% 1,190,000 0.0% 1,190,000 0.0%
1,180,000 Current
Real GDP 720,000 -5.5% 1,180,000 -0.5% -0.5% Account
(Local 1,170,000 1,170,000
Currency) 700,000 -6.0% 1,160,000 -1.0% 1,160,000 -1.0% Balanace
(%GDP)
680,000 -6.5% 1,150,000 -1.5% 1,150,000 -1.5%
1,140,000 1,140,000
660,000 -7.0% 1,130,000 -2.0% 1,130,000 -2.0%
Q4 Q1 Q2 Q3 Q4 Q1 Q2 Q3 Q4 Q1 Q2 Q3
'17 '18 '18 '18 '17 '18 '18 '18 '17 '18 '18 '18
Brazil and Mexico showed continued strength in 2018 with GDP picking up steam. Public Debt as percentage of GDP has now surpassed 80% in Brazil
where 6.7% of GDP is allocated to interest payments. While most debt is in local denomination, rising rates in the United States still pose a risk to the
economy. Mexico, for comparison, has a Public Debt/GDP ratio of 45%. Argentina, after receiving the IMF’s largest loan in history, must commit to a
zero deficit fiscal budget for 2019, a leading indicator of further austerity measures to address FX and inflation concerns.
Source: S&P Capital IQ platform as January 15th, 2019
13Data Dispatch Latin America: Banks
Most LatAm bank indexes post negative total returns in 2018
Subscribe to Data Dispatch Latin America
Data Dispatch provides a complete view and analysis beyond the data. Our
experienced journalists and bank analysts publish numerous articles and
reports on the financial industry every week. Don't miss out on highly relevant
insights critical to your business decisions.
In terms of total returns, the SNL Brazil Bank index outperformed other
regional bank indexes in 2018 as the country's ongoing economic recovery
and far-right President Jair Bolsonaro's ascension to power helped buoy the
local market.
The SNL bank indexes for the Caribbean, Mexico and the Southern Cone all
posted negative total returns in 2018.
The Brazil bank index peaked in February 2018 with a return of just above
30%. It dipped into negative territory in the second quarter and remained
there through the third quarter before rising back up in October when
Bolsonaro took a commanding lead in presidential polls.
The country's economic growth, meanwhile, accelerated to its fastest pace
in 18 months during the third quarter.
The SNL Mexico Bank index recorded a negative total return of -20.7% in
the fourth quarter of 2018 and -5.6% for the full year. Although returns were
positive in the third quarter, the situation changed when Andrés Manuel
López Obrador, who was elected Mexico's president in July 2018, shook
investor confidence with a number of surprise decisions.
In October, AMLO announced that his government would scrap a more than
$13 billion airport construction project. His party delivered a second blow to
markets when it floated a proposal to cut fees and commissions charged by
banks by up to 50%.
Meanwhile, inflation and currency turbulence in Argentina continued to
weigh on the SNL Southern Cone Bank index, which ended 2018 with a
negative -24.0% total return for the full year and -5.8% for the fourth quarter.
In response to the crisis, Argentine banks started diverting an increasing
amount of their liquidity toward transaction banking and away from lending
operations. In a sector report published in October, Moody's said it expects
to see asset quality deterioration in Argentina's banking system as
outstanding loans will mature in a much less favorable environment than
what banks had anticipated.
The SNL Caribbean Bank index did not fare much better, closing 2018 with
a negative one-year total return of -11.3%.
Authors: Ryan Jeffrey Sy and Mushir Shaikh, January 3rd, 2019
14Panjiva Supply Chain Research:
Highlighting LatAm Exports
Mexican Auto Exports’ Pickup Faces USMCA, Tariff Uncertainties1
Mexican automotive exports experienced an acceleration in growth in January – the lowest month for the year historically – with 4.9% year-over-year
growth compared to just 1.8% in the fourth quarter of 2018, Panjiva analysis of AMIA data shows. That was led by a 31.7% rise in shipments by
General Motors and 41.7% from Toyota. The only significant downturns came from Mazda, whose shipments dropped 63.3%, and Nissan, whose
shipments dropped 9.9%.
The regulatory outlook for the Mexican automakers is not as secure as may be first assumed. While the U.S.-Mexico-Canada Agreement (USMCA)
has been agreed, settling rules of origin and providing exemption from the upcoming section 232 review of the sector in the U.S., it has yet to
achieve ratification from any of the three countries’ parliaments. That may leave some short-term exposure to the section 232 review. Furthermore,
as outlined in Panjiva research of Feb. 5, U.S. automotive sales remain lackluster.
Among the major automakers, Ford is most exposed to the U.S. market, Panjiva data shows, accounting for 91% of its vehicle exports from the U.S.
in 2018. That was followed by General Motors’ 80.1% and Fiat Chrysler’s 72.6%. Among the less-exposed manufacturers are Volkswagen (60.8%)
and Mazda (33.9%).
1 Mexican Auto Exports’ Pickup Faces USMCA, Tariff Uncertainties (February, 2019)
https://panjiva.com/research/mexican-auto-exports-pickup-faces-usmca-tariff-uncertainties/24445
Subscription to Panjiva data is required.
15Behind The Data
The information in this publication was aggregated using data from S&P Global Market Intelligence. Request a trial and
learn more about how our platforms provide essential information on companies, people, and markets worldwide – along
with invaluable tools for analysis, idea generation, and workflow management – to help you make investment decisions
with conviction.
Our broad global, sector coverage including breaking SNL news, fundamental and asset-level data, and expert analysis
can help you stay on top of market economics and activity. Dive into deep SNL sector data, ratios, and meaningful metrics
that are specific to your industry – and go even further with proprietary research and sector projections. Sectors covered
include Financial Institutions (FIG), Healthcare, Consumer, Industrials, Real Estate, Energy & Utilities, Technology, Media,
& Telecommunications, and Materials (including Metals & Mining).
* For Illustrative Purposes Only
16Contact Us
Brazil
Pedro Arlant
Director
+55 11 3818 4109
parlant@spglobal.com
Mexico
Juan Carlos Perez Macias
Director
+52 55 1037 5260
jmacias@spglobal.com
All Regions
marketobservations@spglobal.com
17Disclosures
Copyright © 2019 by S&P Global Market Intelligence, a division of S&P Global Inc. All rights reserved.
These materials have been prepared solely for information purposes based upon information generally available to the public and from sources believed to be
reliable. No content (including index data, ratings, credit-related analyses and data, research, model, software or other application or output therefrom) or any part
thereof (Content) may be modified, reverse engineered, reproduced or distributed in any form by any means, or stored in a database or retrieval system, without
the prior written permission of S&P Global Market Intelligence or its affiliates (collectively, S&P Global). The Content shall not be used for any unlawful or
unauthorized purposes. S&P Global and any third-party providers, (collectively S&P Global Parties) do not guarantee the accuracy, completeness, timeliness or
availability of the Content. S&P Global Parties are not responsible for any errors or omissions, regardless of the cause, for the results obtained from the use of the
Content. THE CONTENT IS PROVIDED ON “AS IS” BASIS. S&P GLOBAL PARTIES DISCLAIM ANY AND ALL EXPRESS OR IMPLIED WARRANTIES,
INCLUDING, BUT NOT LIMITED TO, ANY WARRANTIES OF MERCHANTABILITY OR FITNESS FOR A PARTICULAR PURPOSE OR USE, FREEDOM FROM
BUGS, SOFTWARE ERRORS OR DEFECTS, THAT THE CONTENT’S FUNCTIONING WILL BE UNINTERRUPTED OR THAT THE CONTENT WILL OPERATE
WITH ANY SOFTWARE OR HARDWARE CONFIGURATION. In no event shall S&P Global Parties be liable to any party for any direct, indirect, incidental,
exemplary, compensatory, punitive, special or consequential damages, costs, expenses, legal fees, or losses (including, without limitation, lost income or lost
profits and opportunity costs or losses caused by negligence) in connection with any use of the Content even if advised of the possibility of such damages.
S&P Global Market Intelligence’s opinions, quotes and credit-related and other analyses are statements of opinion as of the date they are expressed and not
statements of fact or recommendations to purchase, hold, or sell any securities or to make any investment decisions, and do not address the suitability of any
security. S&P Global Market Intelligence may provide index data. Direct investment in an index is not possible. Exposure to an asset class represented by an index
is available through investable instruments based on that index. S&P Global Market Intelligence assumes no obligation to update the Content following publication
in any form or format. The Content should not be relied on and is not a substitute for the skill, judgment and experience of the user, its management, employees,
advisors and/or clients when making investment and other business decisions. S&P Global Market Intelligence does not act as a fiduciary or an investment advisor
except where registered as such. S&P Global keeps certain activities of its divisions separate from each other in order to preserve the independence and
objectivity of their respective activities. As a result, certain divisions of S&P Global may have information that is not available to other S&P Global divisions. S&P
Global has established policies and procedures to maintain the confidentiality of certain non-public information received in connection with each analytical process.
S&P Global may receive compensation for its ratings and certain analyses, normally from issuers or underwriters of securities or from obligors. S&P Global
reserves the right to disseminate its opinions and analyses. S&P Global's public ratings and analyses are made available on its Web sites,
www.standardandpoors.com (free of charge) and www.ratingsdirect.com (subscription), and may be distributed through other means, including via S&P Global
publications and third-party redistributors. Additional information about our ratings fees is available at www.standardandpoors.com/usratingsfees.
18You can also read