DECEMBER 2018 - Submission to the House Standing Committee on Infrastructure, Transport and Cities Inquiry The automation of mass transit Bus ...
←
→
Page content transcription
If your browser does not render page correctly, please read the page content below
Submission to the House Standing Committee on Infrastructure, Transport and Cities Inquiry
Bus Industry Confederation

   Submission to the House Standing Committee on Infrastructure,
                    Transport and Cities Inquiry
                                  The automation of mass transit

                                    Bus Industry Confederation

                                               DECEMBER 2018

   ©Bus Industry Confederation Inc. Last Updated 8/12/2018 Mass Trans Cities/AVs_on_Denmand   Page 1 of 30
Submission to the House Standing Committee on Infrastructure, Transport and Cities Inquiry
Bus Industry Confederation
Contents
INTRODUCTION ................................................................................................................................................. 3
FUTURE AUTOMATION – DRIVERLESS CARS AND LAND –BASED MASS TRANSIT – THE CONTEXT .................. 3
AUTONOMOUS VEHICLES .................................................................................................................................. 4
TWO FUTURE SCENARIOS AND THEIR POTENTIAL EFFECTS .............................................................................. 5
AN OPTIMISTIC SCENARIO ............................................................................................................................. 6
User impacts .............................................................................................................................................. 6
External benefits/costs .............................................................................................................................. 7
A PESSIMISTIC SCENARIO ............................................................................................................................ 10
IMPLICATIONS FOR PUBLIC TRANSPORT ......................................................................................................... 11
Markets subject to most pressure for change ............................................................................................ 11
PUBLIC TRANSPORT SERVICE SUBSIDIES ......................................................................................................... 18
FUTURE BUS MASS TRANSIT............................................................................................................................ 21
POINTS SPECIFIC TO THE BUS INDUSTRY......................................................................................................... 22
Market segments ......................................................................................................................................... 22
Operating costs............................................................................................................................................ 23
Capital costs................................................................................................................................................. 23
POLICY IMPLICATIONS ..................................................................................................................................... 24
Context ........................................................................................................................................................ 24
Mandatory emissions standards ................................................................................................................. 24
TRANSPORT PRICING REFORM ........................................................................................................................ 25
CONTAINING URBAN SPRAWL......................................................................................................................... 26
IMPROVED GOVERNANCE ARRANGEMENTS................................................................................................... 28
CONCLUSIONS ................................................................................................................................................. 29
©Bus Industry Confederation Inc. Last Updated 8/12/2018 Mass Trans Cities/AVs_on_Denmand Page 2 of 30Submission to the House Standing Committee on Infrastructure, Transport and Cities Inquiry
Bus Industry Confederation
INTRODUCTION
The Bus Industry Confederation (BIC) is the national organisation representing the interests of the Bus and
Coach Industry, both operators and suppliers.
The BIC promotes the safety, efficiency, effectiveness, accessibility and increased use of bus and coach
transport in Australia.
The BIC promotes the increased use of public transport in order to reduce the economic, social,
environmental and public health impacts associated with the excessive use of cars.
The Australian bus and coach industry carries more than 1.5 billion passengers annually and employs more
than 50,000 people.
As the primary voice of the bus and coach industry in Australia the BIC works with all levels of Government,
regulatory authorities, the industry and the community to:
Advocate for the virtues of the “National Moving People” strategy
Encourage investment in public transport infrastructure and services
Implement an effective tax and pricing regime for the industry and passengers
Coordinate and make more effective existing Federal, State and Local Government policies and
programs that relate to passenger transport
Improve public understanding of the contribution made by the bus and coach industry to
Australia’s economy, society and environment.
Ensure that the accessibility and mobility needs of Australians are met, regardless of where they
live or their circumstances.
Ensure that buses and coaches operate safely and effectively
Improve the environment and community health through greater use of public transport
FUTURE AUTOMATION – DRIVERLESS CARS AND LAND –BASED MASS TRANSIT –
THE CONTEXT
Whilst this Federal Inquiry has a specific focus on the automation of mass transit, this cannot be looked at
in isolation of the possible impacts of driverless vehicles in general and on social transit for transport
disadvantaged and people living in low volume passenger markets.
Mass transit in the future could be very different depending on the policy setting of Governments. This
submission attempts to provide this contextual view of future mass transit based on different policy
outcome scenarios that may provide the Committee some ideas about how the Federal government may
influence the future adoption of autonomous vehicles in general and the future role of mass transit and
also social transit, which in BIC’s view needs to be considered at the same time.
As background, parts of this submission refer to a to be completed and released (2019) future BIC Policy
paper, authored by the Institute of Transport and Logistics Studies, Business School, University of Sydney,
on Mobility as a Service (MaaS) and the changing social values and emerging new technologies that are
increasing the probability of massive shifts in transport service offerings in coming decades with potentially
huge benefits and/or costs.
Future energy sources for buses and moving from diesel to electric autonomous vehicles is also discussed in
this submission.
©Bus Industry Confederation Inc. Last Updated 8/12/2018 Mass Trans Cities/AVs_on_Denmand Page 3 of 30Submission to the House Standing Committee on Infrastructure, Transport and Cities Inquiry Bus Industry Confederation AUTONOMOUS VEHICLES Ever since the automobile frightened the living day lights out of horse and cart, we have not seen an evolution in transport technology that will have a major impact on humanity and society at large. This was until the autonomous vehicle came along. Initially the public perception of this innovation was that it was a technological novelty. In an advanced society such as Australia, vehicles such as cars are essential for daily commute and business operations. We are witnessing a technological evolution occurring where the humble car can now be operated without the need for a driver to control the vehicle’s movement. Technological advances are also being applied to heavier vehicles such as trucks and buses. The BIC would note however that the concept of a driverless bus, in particular large buses, may be technologically possible but the reality of mass transit and school bus services operating in this way are much less certain for a variety of operational and personal safety and societal issues. The unknown element from a bus perspective is if it is going to be accepted by users concerned about safety and security. Measures to gain the trust of the community in relation to safety and security will be very important, but ultimately they may not be successful. This issues has the potential to block the use of driverless buses and may limit the technology to personal conveyances and may even restrict them. These issues are dealt with later in this submission. It should be remembered that driverless trains have been a reality for some time but are manned by a driver in most, if not all instances and that despite fully functioning auto pilots on today’s commercial jet fleets, pilots are still a reality. In the US, a strong push for driverless vehicles has come from expectations of significantly improved travel safety with autonomous vehicles, with expectations of accident reductions of 80+%. If realized, this is an important social benefit. Driverless vehicles also promise more effective use of scarce road space, through the ability to operate closer to surrounding vehicles. This should save public money in terms of the need to add road space, another societal benefit. It is most unlikely that this potential benefit is taken into account in evaluating major new road projects that are due for completion within a decade or so. As suggested below, the benefits of such projects will thus be over-stated. Availability of a (driverless) vehicle of your choice, on-call, may be an attractive option for many people. The opportunity to work while travelling in your driverless car removes the notion of saving time having productive value, if you can work just as well in the car, as out. As a consequence the time savings benefits attributed to many major new road projects are likely to be illusory – they will simply vanish! This compounds the errors in road project evaluation from ignoring the impact of driverless vehicles on effective road capacity. Access to cheaper travel, where time saving has little value, in turn, may significantly reduce the pressures for workers to live close to where they work. Longer travel times lose disutility if the time can be productively enjoyed. Accelerated urban sprawl is a highly likely outcome, with all the adverse social consequences associated therewith. This is a major potential social risk from driverless vehicles. Car sharing (where this is linked with driverless vehicles is hard to predict as the culture in Australia is one of car ownership) creates the possibility that access to driverless vehicles will be substantially less costly than owning your own vehicle, even if it means significant numbers of empty vehicles re-positioning themselves for their next task (using up some of the additional road space made possible by driverless vehicles!). This opportunity for cheaper accessibility is likely to be of benefit to some transport disadvantaged people, where the cause of disadvantage is a lack of financial capability. The associated dead-running, together with the likely impetus to accelerated urban sprawl from the introduction of driverless vehicles, underlines the vital importance of a proper road pricing regime accompanying the introduction of driverless vehicles. This will have the benefit of reducing the growth in demand for the absolute numbers of driverless vehicles, encouraging sharing at the margin rather than owning your own ©Bus Industry Confederation Inc. Last Updated 8/12/2018 Mass Trans Cities/AVs_on_Denmand Page 4 of 30
Submission to the House Standing Committee on Infrastructure, Transport and Cities Inquiry
Bus Industry Confederation

vehicle, and will reduce low value movement of such vehicles. A substantial increase in use of shared
vehicles must be an important part of the introduction of driverless vehicles, to reduce the risks of sprawl
and of growth in congestion (caused by use of cheaper, more accessible vehicles growing faster than the
improvement in effective road capacity from driverless vehicles).
The role of mass transit, and in particular bus, whether they will be driverless or not must be considered in
the future, for the same reasons these services are provided today and in the context of the outcomes such
services deliver to the economy, environment and society. For example congestion management in a world
of driverless cars and an increasing population will still need to be addressed and mass transit solutions will
be part of this.
A road pricing regime that prices the full social costs of vehicle movement, full or empty, creates the
opportunity to exercise more effective and efficient transport network management control over
potentially serious adverse unintended outcomes, from greatly increased demand for limited road space
and pressure for accelerated urban sprawl.
The reduced cost of private vehicle access that may accompany driverless vehicles may pose a threat to
public transport but also provides some possible ways out. Removing labour costs from driverless
taxi/Uber type services , for example, may increase demand for those services, some of which may come at
the expense of public transport – although these services are increasingly becoming part of the ‘public
transport’ mix. Similarly, increased personal travel in cheaper driverless shared cars may also reduce
demand for PT trips. Such circumstances may reduce demand for some types of bus services as we know
them today, and thus reduce mobility options for those at risk of social exclusion. The balance between
providing services in driverless cars and small shared passenger vehicles that may be able to operate on a
commercial basis and Government funded bus services today that subsidise passenger fares needs to be
seriously considered in the context of social exclusion and access to opportunity. Driverless large mass
transit buses may be less expensive to operate, and could allow for greater investment in more mass transit
bus services. That is, if such large driverless vehicles will be accepted and used by the community.
With labour costs accounting for half the costs of bus operation, driverless buses will have cost appeal to
governments seeking ways to reduce costs of public transport service provision. Smaller driverless buses
have the potential to improve local access opportunities at the social safety net level, since their lifecycle
cost advantage creates the opportunity to add services (in smaller vehicles) for any given outlay on public
transport, which aligns with the idea of mobility as a service (MaaS). Such lower costs of service provision
thus create opportunities for extending services in areas that are currently under-provided or have no
services at all, including through tailoring bus sizes more closely to expected demand patterns. This is a
potentially significant benefit in terms of social inclusion opportunities, flowing from a convergence
between public and private transport as we know them today.
The introduction of driverless vehicles should be seen as an opportunity to review mobility in general,
reflecting on the whole mobility system, the purpose and value of mobility and how it can be accomplished
better in social, environmental and economic terms, recognising the potential benefits and challenges
associated with driverless vehicles.

TWO FUTURE SCENARIOS AND THEIR POTENTIAL EFFECTS
As mentioned earlier in this submission BIC is currently finalising a BIC Policy paper on Mobility as a Service
and the impacts of disruptive technology on mobility. Section 5 of this policy paper follows, and looks at
pessimistic and optimistic scenarios for future mobility that hopefully will assist the Committee in its
deliberations and putting mass transit into context in a changing mobility world
Given the uncertainties involved in predicting the way digital disruption will impact future personal travel
choices, and matters related thereto, scenarios can be a helpful way to think through what the future might
look like, as an aid to shaping policy responses to increase the likelihood of better societal outcomes, in
©Bus Industry Confederation Inc. Last Updated 8/12/2018 Mass Trans Cities/AVs_on_Denmand     Page 5 of 30
Submission to the House Standing Committee on Infrastructure, Transport and Cities Inquiry
Bus Industry Confederation

terms of the policy goals being sought from the transport network. A number of papers exploring
technological disruption in land passenger transport topic have taken this approach.

McKinsey & Bloomberg NEF (2016) develop three scenarios, each linked to a specific type of city
environment, which they label ‘clean and shared’, ‘private autonomy’ and ‘seamless mobility’. The ‘clean
and shared’ scenario is least relevant to Australia, since it focuses on developing, dense metropolitan areas
such as Istanbul, Delhi and Mumbai. Cervero et al. (2017) use ‘optimistic’ and ‘pessimistic’ scenarios, Isaac
(2016) talks about a ‘driverless nightmare’ scenario and a ‘driverless utopia’ scenario, while Susan Shaheen,
co-director of the University of California Berkeley Transportation Sustainability Research Centre (quoted in
Mervis 2017), talks about ‘utopian’ and ‘dystopian’ scenarios.

While scenarios often discuss the impacts of pathways on introducing technological change, they tend to
be more interested in end-points and, therefore, in the current context, tend to assume widespread
implementation of Autonomous Electric Vehicles (AEVs). In that event, the separation of scenarios for
exploring the possible future impacts of AEVs (including MaaS-type approaches to service provision)
depends essentially on assumptions about the penetration of shared mobility (vehicle sharing and ride
sharing—i.e., sharing across time and in space) and the consequences thereof, as compared to personal
ownership. Optimistic scenarios are based on the assumption of a high level of penetration of shared
mobility solutions and pessimistic scenarios on a low level of penetration, with personal vehicle use
remaining dominant. We use optimistic and pessimistic scenarios below and suggest the major likely
consequences of each, in terms of matters likely to impact significantly on user benefits and external
costs/benefits, and hence on societal goal achievement. Neither scenario in its entirety is expected to be
the eventual outcome but proposing two distinctly different futures enables some key risks and
opportunity areas to be identified and policy measures to be framed to increase the likelihood of better
outcomes being realized.

Table 5.1 summarizes our assessment of the broad outcomes associated with each of the two scenarios,
drawing partly on McKinsey & Bloomberg NEF (2016), Isaac (2016), Cervero et al. (2017) and Litman (2018)
and adding our own insights. The time frame for the table is such as permits widespread adoption of AEVs.
As noted elsewhere, cyber security and privacy considerations are not included in this assessment. The
following discussion focuses on user benefits and externalities. The subsequent discussion about potential
impacts on public transport later in this section of the submission includes shorter time horizons.

AN OPTIMISTIC SCENARIO
The optimistic scenario assumes that there is substantial penetration of shared mobility, in part because
policy settings explicitly target this outcome. We first consider user benefits from AEVs and then external
effects. The discussion on the optimistic scenario in this section is more detailed than that of the
pessimistic scenario because many comparisons between the two scenarios are included in this section.

User impacts

In the optimistic scenario, cheap, accessible, low/zero emission driverless vehicles are widely available on-
call, either for single use or shared use but shared use mode predominates (perhaps shared in peak periods
and operating point-to-point off-peak), mainly because the lower marginal user costs associated therewith
outweigh potential disadvantages in terms of (for example) inconvenience, as compared to private
©Bus Industry Confederation Inc. Last Updated 8/12/2018 Mass Trans Cities/AVs_on_Denmand     Page 6 of 30
Submission to the House Standing Committee on Infrastructure, Transport and Cities Inquiry
Bus Industry Confederation

ownership. Shared mobility brokers and/or providers (MaaS) work hard at ensuring convenience and
reliability are service hallmarks. In terms of user costs, RethinkX (2016) projects this shared AV cost at four
to ten times cheaper per mile than buying a new car and two to four times cheaper than operating an
existing vehicle. Litman is much less optimistic on cost reduction potential from shared mobility but still
sees savings. Travel time reliability benefits are also likely to occur with AEVs, with significant gains at a
penetration rate of 25% or more (Atkins 2016).

Availability, convenience and cost of accessing AEVs are such that people see less need to own their own
vehicles. Those who continue to own their own vehicles increasingly make them available for use by others.
Also, giving up a substantial element of private vehicle ownership frees up part of the household budget for
other uses. Removing the need for a driver means that travel time can be used productively, if the
passenger so wishes (research is taking place on ways to reduce car sickness associated with working in the
vehicle), or to catch up on lost sleep. On the negative side, cheaper travel costs will encourage additional
trip making, which may add to congestion pressures unless shared mobility provides sufficient offset.

AEVs can provide new mobility opportunities for people who cannot, or choose not to, drive (for whatever
reason). Older people, youth and people with a disability are often mentioned in this context but there is
no reason why these improved mobility opportunities cannot also extend to other groups experiencing
transport disadvantage, particularly in urban areas. Our research on links between mobility, trip making
and risk of social exclusion has shown the high value of additional trip making by those at such risk (see, for
example, Stanley et al. 2011 a, b; Stanley and Hensher 2011). In the early years of implementation, these
benefits will probably be limited to higher income households, because of higher capital costs of AEVs but,
as shared mobility choices start to proliferate, the inclusion benefit opportunity will be more widely
available. Greater social inclusion is also associated with flow-on external benefits, such as improved
mental health, higher employment levels, lower medical costs, etc.

The cheaper cost of AEV travel, particularly by ride-sharing, and the opportunity for new vehicular trips by
mobility/transport disadvantaged people will combine to mean that the number of person trips increases in
the optimistic scenario. Given sufficient penetration of shared mobility choices, however, this higher
number of person trips can be satisfied with a slower growth in vehicle kilometres travelled, even though
autonomous shared vehicles need re-positioning movements.

External benefits/costs

Vehicle platooning, made possible by vehicle-to-infrastructure and vehicle-to-vehicle communication,
means that effective road/PT system capacity increases with widespread use of AEVs, although separate
right-of-way is likely to be required to maximize this increase. Friedrich (2016), for example, has estimated
the effective road capacity increase achieved by purely autonomous traffic at 40% in city traffic and 80% on
highways, with other estimates even higher. For example, Bierstadt et al. (2014) suggest freeway capacity
could double with 100% AVs and Fernandes and Nunes (2012) show theoretically how lane capacity could
almost quadruple with optimal platooning. This, and the freeing up of parking space attributable to lower
personal ownership of vehicles and a greater reliance on ride sharing, means that scarce urban space can
be released for other community uses, such as local open space, in the optimistic scenario.

©Bus Industry Confederation Inc. Last Updated 8/12/2018 Mass Trans Cities/AVs_on_Denmand     Page 7 of 30
Submission to the House Standing Committee on Infrastructure, Transport and Cities Inquiry
Bus Industry Confederation

Taking these capacity considerations into account alongside expected slower growth in VKT, as compared
to the pessimistic scenario, means that realization of the user benefits from AEVs can be achieved with
lower congestion pressures under the optimistic scenario than in the pessimistic scenario.

The main benefit of AEVs is often cited as safety, widespread use expected to deliver substantially lower
accident rates. The 90% or so scale of reductions often cited (e.g. Fleetwood 2017) are questioned by
Litman (2018) but significant benefits are still in prospect, depending partly on the regulatory environment
that is put in place. The greater use of electric AVs, fuelled by clean energy sources, and slower growth in
VKT under a high penetration rate of shared mobility, should combine to deliver lower emissions of GHGs
and local pollutants, with associated health benefits.

Table 5.1: Scenarios for future mobility

 Societal impact criteria                              Optimistic/utopian             Pessimistic/dystopian future
                                                       future
 USER BENEFITS

 . Trips (i.e. person trips)                           > than in pessimistic          < than in optimistic scenario
                                                       scenario

                                                       < than in pessimistic
 . Travel distance (person kilometres)                 scenario                       > than in optimistic scenario

 EXTERNALITIES

 Economic

 . Productivity/output                                 Higher                         Lower

 . Employment                                          ?                              ?

 . Congestion                                          Lower                          Higher

 . Government spending/borrowing requirements          Lower                          Higher

 Environmental

 . GHG emissions                                       Lower                          Probably lower but > optimistic

 . Air pollution                                       Lower                          Ditto

 . Open space availability near housing                More                           Less

 Social

 . Safety                                              Lower accident rate            Lower but > optimistic

 . Social inclusion                                    Greater inclusion              No change or worse

©Bus Industry Confederation Inc. Last Updated 8/12/2018 Mass Trans Cities/AVs_on_Denmand            Page 8 of 30
Submission to the House Standing Committee on Infrastructure, Transport and Cities Inquiry Bus Industry Confederation Cross-cutting and/or intermediate impacts . Expanded travel choices Yes For some . Freeing up space for place making Yes Possibly but < optimistic . Urban sprawl Less pressure Increased pressure . VKT by private car. < than pessimistic scenario > than optimistic scenario PROCEDURAL CRITERIA Governance . Integrated planning/policy A requirement for delivery Less likely . Community engagement A requirement for delivery Less likely With vehicle use in the optimistic scenario now paid for on a more direct pay-by-use basis, active transport is likely to account for a higher mode share than in the pessimistic scenario, with multiple societal benefits (e.g., improved health, lower congestion). The higher mode shares for active travel will, in turn, be supportive of more compact settlement patterns than in the pessimistic scenario. One implication is likely to be relatively higher urban productivity from clustering in the optimistic scenario. Also, the more compact urban form will mean a lower level of infrastructure spend on the urban fringe and beyond, easing government borrowing requirements. It is important at this point to emphasize that that some key external benefit issues tied up in AEV discussions, such as GHG emissions savings and lower local air pollution, are important policy matters in their own right and need to be resolved in both scenarios. Similarly, much of the social inclusion benefits of AVs (and AEVs) are likely to be available under both scenarios, because of the presence of driverless vehicles in each. Second order differences may arise, however, in terms of the scale of benefits as between the two scenarios and in the rate at which these benefits arise during the transition pathway. For example, the higher levels of VKT expected under the pessimistic scenario will mean higher GHG emissions and air pollution, to the extent that this scenario has a higher level of VKT than the optimistic scenario, albeit that GHG emissions on both should be well below business-as-usual projections. Similarly, the optimistic scenario should be expected to deliver bigger inclusion benefits because it is expected to mean lower unit costs of travel (because of greater penetration of shared mobility) and less contrary pressures from accelerated urban sprawl, with fewer associated expected adverse impacts on PT availability (harder to ensure in lower density settings), all adding up to net relative inclusion gains for the optimistic scenario. ©Bus Industry Confederation Inc. Last Updated 8/12/2018 Mass Trans Cities/AVs_on_Denmand Page 9 of 30
Submission to the House Standing Committee on Infrastructure, Transport and Cities Inquiry
Bus Industry Confederation

A PESSIMISTIC SCENARIO
Much of the discussion in the optimistic scenario applies to this section. The pessimistic scenario assumes
that attachment to private vehicle ownership and use remains strong, such that vehicle sharing and ride
sharing play only relatively small roles in future mobility provision. McKinsey Bloomberg NEF set up this
kind of scenario as follows:

         The attractiveness of the private vehicle. The advent of desirable and highly personalised cars –
         which would frequently also be electric – may maintain consumers appetite for a private vehicle. In
         this vision of the future, consumers are likely to value both their privacy when travelling and the
         independence of owning their own car. Accordingly, car sharing, ride hailing and ride sharing
         remain complementary options but do not replace commutes on a large scale. (McKinsey
         Bloomberg NEF 2016, p. 34).

 In this setting, the personal appeal of private ownership, reinforced by the perceived lower cost of AEVs
and opportunity to use travel time productively lead to increased personal trips, with vehicle kilometres
increasing at least as fast as personal trips but most probably much faster, as car owners avail themselves
of the opportunity to call up their car when they want it (e.g., to collect them), send the vehicle to find its
own parking space or to serve travel needs of family members or friends. With the added demand from
those for whom AEVs provide a new travel opportunity (social inclusion benefit), growth in VKT will thus be
faster in the pessimistic scenario than in the optimistic scenario, but the number of person trips may not
increase as much as in the optimistic scenario. The pessimistic scenario has more trips on road but probably
less across all modes. These various influences mean that traffic congestion is likely to increase relative to
the optimistic scenario but also probably in absolute terms, more than offsetting the benefit effect of AEVs
in terms of increasing effective road capacity. They also mean that car parking space will be required in
greater quantity than in the optimistic scenario, reducing the opportunity to convert such space to other
valuable community uses.

The opportunity to work-in-vehicle, or rest/sleep while travelling, instead of having to deal with the driving
task, will be seen by some people as an opportunity to change place of residence, most likely to consume
additional space by moving to the peri-urban area or even beyond, extending urban sprawl. This will be a
compounding factor increasing VKT under the pessimistic scenario, also increasing attendant risks of
greater social exclusion for those with fewer mobility choices and increased costs of infrastructure and
service provision. The opportunity to live further out will be most available to those on higher incomes, the
sprawl effect, however, tending to worsen public transport travel opportunities available to those on lower
incomes.

Increased sprawl under the pessimistic scenario will be associated with reduced urban productivity, BIC
Policy Paper 5 showing how productivity levels decline with increasing distance from the CBD (Stanley and
Brain 2015). Also, the infrastructure costs of accelerated urban sprawl under the pessimistic scenario mean
added pressure on government borrowing requirements. We see the consequences of greater urban
sprawl as potentially the biggest single risk from widespread adoption of AEVs.

Employment impacts of AEVs are hard to assess as between the two scenarios. The removal of the need for
a driver will clearly cause significant job loss in sectors such as freight, bus and taxi but offsets of some
unknown proportion should follow from higher urban productivity associated with the optimistic scenario.
©Bus Industry Confederation Inc. Last Updated 8/12/2018 Mass Trans Cities/AVs_on_Denmand     Page 10 of 30
Submission to the House Standing Committee on Infrastructure, Transport and Cities Inquiry Bus Industry Confederation IMPLICATIONS FOR PUBLIC TRANSPORT Markets subject to most pressure for change Given the particular interests of BIC and its members, we consider the way that AEVs might impact on public transport in coming years. Removing the need for a driver makes AEVs an appealing proposition for much public transport and the potential low cost of shared AEVs opens up market opportunities for such vehicles to provide services that are currently regarded as ‘public transport’. For example, micro transit (6- 12 passengers) could provide frequent, demand-responsive service (Litman 2018). However, shared mobility solutions will be somewhat harder to deliver in the low density settlement patterns that characterize Australian cities and regions than in higher density settings, because of service economics. In this section we present a brief outline of public transport service economics, since some existing PT services (i.e., shared mobility) may be at considerable risk as MaaS/AEV use grows. In service cost terms, public transport service provision confronts a constant trade-off tension between pursuing patronage or ridership, which tends to produce relatively low costs per passenger kilometer and delivers economic and environmental benefits, versus service coverage for social inclusion purposes, where costs per passenger kilometre tend to be high. This market distinction is often described as being between mass transit services and social transit, or between ridership and coverage. Figure 5.1 characterizes service by mass transit and social transit across a city and links this to characteristics of urban structure that have been shown to affect PT patronage and car use (Ewing and Cervero 2010). In outer urban (and regional) areas, land use density and mix (diversity) are usually low and so is PT service connectivity but distance from a city’s CBD is relatively high (shown in reciprocal form in Figure 5.1 as 1/Distance from CBD being low). PT service characteristics in this setting are typically relatively low frequency service levels, shorter span of operating hours, less direct routes and relatively poor travel time compared to car (including access/egress/wait stages). Accessibility is also usually poorer in low density areas, in both the sense that stops may be less accessible than in better served areas and in the broader sense that fewer access opportunities will be available by PT, within any given travel time. As distance from the fringe reduces (i.e., the CBD is closer), densities increase, land use diversity (mix) typically increases and PT connectivity improves, because PT services operate at higher frequency, over longer spans, with more direct routes. PT door-to-door travel time improves somewhat relative to that by car. ©Bus Industry Confederation Inc. Last Updated 8/12/2018 Mass Trans Cities/AVs_on_Denmand Page 11 of 30
Submission to the House Standing Committee on Infrastructure, Transport and Cities Inquiry
Bus Industry Confederation
Figure 5.1: Aligning PT service with land use
PT (/CT) service characteristics
Social transit (Coverage) Mass Transit (Ridership)
Frequency
Span of hours
Accessibility
Route directness
Car/PT travel time ratio
Low High
Strategic land use influencers
Density
Diversity (land use mix)
1/Distance from CBD
Connectivity
PT operating cost per passenger and per passenger kilometer tend to be relatively lower for mass transit
services, where scale economies are most likely, and higher for the social transit service, recognizing that
different PT modes may perform some or all of these respective services. Thus, for example, Victorian
2016-17 Budget Paper No. 3 (DTF 2016) suggests that 2015-16 Melbourne public transport costs, mainly
operating, were $5.28 per passenger for bus (of which perhaps one fifth is capital cost), $3.35/passenger
for train (payments for metropolitan train services) and $1.06/passenger for tram (payments for tram
services). Conversely, however, capital costs for mass transit, particularly rail and tram/light rail, are high
relative to social transit, for reasons such as the high cost of land acquisition and/or tunneling
(purchase/construction of dedicated right-of-way), fleet costs and signaling systems. For example,
Melbourne’s Metro Rail Tunnel project has an estimated cost of $11 billion, none of which is reflected in
the $3.35/passenger cost.
The high capital costs and associated high patronage of rail mass transit services to central cities provides
them with significant natural monopoly characteristics, which suggests multiple sources of supply are
unlikely.1 The agglomeration economies, congestion cost savings and environmental benefits (external
benefits) associated with such services speak to the importance of strong governmental control over
service provision, rather than leaving them to the dictates of the private marketplace, where under-
provision would be expected, relative to the scale of external benefits. We conclude that these natural
monopoly characteristics and external benefits are such that, in coming years, the Australian mass (trunk)
transit market should be remain as public transport as we currently understand it. There is a need to
include these trunk services in MaaS bundles, for which they will provide a fundamental ingredient. Also,
given the important service role they will inevitably play therein, providers of mass transit could decide to
take on a role as MaaS brokers. There is interest, for instance, from Metro Trains Melbourne in access
1
Although vertical separation of track and services can be used to reduce the degree of natural monopoly.
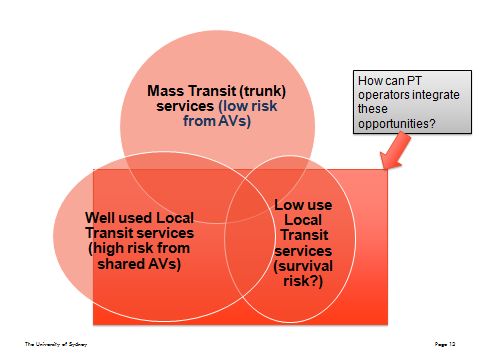
©Bus Industry Confederation Inc. Last Updated 8/12/2018 Mass Trans Cities/AVs_on_Denmand Page 12 of 30Submission to the House Standing Committee on Infrastructure, Transport and Cities Inquiry Bus Industry Confederation contracts to expand their service offering to cover the first/last mile to/from stations, through innovative ridesharing programs and partnerships with ride-hailing providers (Wong and Hensher 2018). Developments in other markets, however, are less encouraging, as independent MaaS operators attempt to displace public transport with intermediate modes where the profit margin is higher and to sell more expensive mobility packages. This issue is the focus of present research at ITLS on the broker-supplier interface of MaaS service delivery. Social transit services are much less likely to generate agglomeration economies, congestion savings or environmental benefits but can deliver significant social inclusion benefits, which our research shows has a high monetary value. Importantly, these services can be provided by smaller units than mass transit services, which makes them more open to competition from a new provider than is the case with mass transit. It is these local social transit services that we see are most likely to face competition from expanded personal travel opportunities offered through MaaS-based shared mobility services. Significantly, the valuable social inclusion benefits from social (local) transit are also likely to be available from an alternative form of local service provision, at least to some extent; they are not unique to local bus services, for example. It thus comes down to who can provide an adequate level of social (local) transit-like service most effectively, efficiently and sustainably. This discussion can be summarized graphically, as in Figures 5.2(a) to (d). In simple terms, public transport can be categorized as either mass transit (trunk services) or local (social) transit. Some of the latter services are well patronized and others are less so, as in Figure 5.2(a). There is a general tendency at present for state governments to shift resources into expanding mass transit and well patronized local services, as in Figure 5.2(b), sometimes to the detriment of service levels on less well patronized social (local) transit service. Roll out of MaaS and AEVs can be expected to put increased pressure on the better patronized local transit services, where demand is strongest, probably replacing them with shared car/small bus-based services, particularly when these become driverless and lower cost (Figure 5.2(c)). This development direction reflects a blurring of the boundaries between PT as we have known it and private transport. Local transit services that have low patronage levels are at risk of losing all or most service in this context, particularly if governments rely on the market to provide most local PT-like services, expecting this to be at low cost (through MaaS with AEVs). We see this as a major risk exposure in terms of social exclusion: governments seeing MaaS/AEVs as almost the ultimate deregulation, with the market providing services to all at a very low cost. This greatly overestimates, we believe, what might be possible in terms of commercially-based service offerings in low volume markets. Risks are less if service delivery agreements are used to assure service continuity in some form, as discussed below. Fare discounts may remain for some types of passengers but there may be fewer services available locally, if patronage levels are poor, on which to take advantage of these discounts. One likely PT operator response to this evolving setting is suggested in Figure 5.2(d), where the mass transit operator seeks to extend their influence across the full service spectrum, absorbing the MaaS broking role within their business model. Within this model, the PT operator may seek to directly provide a wider range of services or else sub-contract others to provide some elements. In any event, low patronage local services will remain at greatest risk. ©Bus Industry Confederation Inc. Last Updated 8/12/2018 Mass Trans Cities/AVs_on_Denmand Page 13 of 30
Submission to the House Standing Committee on Infrastructure, Transport and Cities Inquiry
Bus Industry Confederation

Some operator cross-subsidy of service costs on lowly patronized social transit routes, from their revenue
streams on more commercially viable services, might take place, especially if operators seek to grow
market share with a view to the long term. Nonetheless, if service provision at the low patronage local end
is left entirely to the private market place, then exclusion risks will increase, particularly in fringe
urban/regional areas and in rural/regional settings, where demand densities are least supportive of
commercially viable offerings for shared mobility. Alternatively, service delivery agreements could be used,
between authorities, trunk operators and local operators (including MaaS providers and/or particular
shared mobility providers), to ensure a range of service offerings continues.

The extent to which existing and developing local PT services are under threat from new (MaaS-based)
service offerings will depend in part on the way future urban development takes place. Australian capital
city integrated land use transport strategies are increasingly being geared to deliver more compact cities,
involving increased densities in outer growth areas. For example, the Ministerial Advisory Committee for
PlanMelbourne 2017-2050, on which one of the present authors was a member, proposed a minimum 25
dwellings per hectare for Melbourne’s growth areas and Toronto is now working to new Greenfield
densities of around this level. If these densities can be achieved, the boundaries between social transit and
mass transit will be narrowed, tending to sustain a higher level of mass transit in the form we currently
know it than if lower densities persist but still likely to see substantial involvement of MaaS and disruption
of existing PT at local service level by shared mobility services.

              Figure 5.2(a): Public transport route service markets – a simple characterization.

                                              Mass Transit
                                                (trunk)
                                               services

                              Well used                               Low use
                                Local                                   Local
                               Transit                                 Transit

©Bus Industry Confederation Inc. Last Updated 8/12/2018 Mass Trans Cities/AVs_on_Denmand     Page 14 of 30
Submission to the House Standing Committee on Infrastructure, Transport and Cities Inquiry
Bus Industry Confederation
Figure 5.2 (b): Current tendency for PT service development
Expand Mass
Transit services:
economic/environ
ment reasons
Sustain/ Contract
expand well low use
Local
used Local Transit
Transit services services
Figure 5.2(c): Possible consequence of shared mobility growth, by about 2030
Further expand
Mass Transit
(trunk) services
Expand
well used LTS?
Local
Transit
©Bus Industry Confederation Inc. Last Updated 8/12/2018 Mass Trans Cities/AVs_on_Denmand Page 15 of 30Submission to the House Standing Committee on Infrastructure, Transport and Cities Inquiry
Bus Industry Confederation
Figure 5.2(d): Likely PT operator response
Whilst the suggested future of PT operators absorbing the MaaS broking role within their business model
constitutes a longer term development, much innovation is already happening, with forays into
intermediate modes and new models of providing local (coverage) transit. Whilst this is evident from the
innovative work of multinational multimodal operators (e.g., Transdev, Keolis) in overseas markets, local
Australian operators are also keenly exploring this space. In NSW, on demand services have being trialed
since late 2017 in the form of government-led pilots, with various models deployed in Metropolitan
Sydney, Outer Metropolitan Sydney and (from late 2018) in Rural and Regional NSW. Existing PT operators
are partnering with technology providers to deliver these new innovative services (Table 5.2). Whilst this
first wave of services has been government-led, bus operators are rolling out their own on demand services
independent of government as well. There are varying reasons and levels of enthusiasm for this, with the
cynical seeing it as a way to impress and keep/win future tenders, given government interest in on demand
services. Indeed, on-demand public transport is being integrated as part of conventional bus service
contracts, as evidenced by the recent SMBSC2 Region 6 contract offering.
2
Sydney Metropolitan Bus Service Contracts
©Bus Industry Confederation Inc. Last Updated 8/12/2018 Mass Trans Cities/AVs_on_Denmand Page 16 of 30Submission to the House Standing Committee on Infrastructure, Transport and Cities Inquiry
Bus Industry Confederation
Table 5.2: Public (bus) transport operators collaborating with technology providers to deliver on
demand services
Bus Operator Platform Provider(s) Service Profile
Keolis Downer Routematch, Via Keoride on Sydney’s Northern
Beaches and Macquarie Park,
Newcastle On Demand
Transit Systems Bridj (acquisition) Weatherill Park (Sydney), SMBSC
Region 6 (future)
Premier Illawarra TaxiCaller Premier Illawarra On Demand
Interline Bus Services Thoreb Australia Interline Connect in Edmondson
Park (Sydney)
Busways Via NSW North Coast (Rural and
Regional On Demand tender)
Forest Coach Lines TaxiCaller, Tuup (former) NSW North Coast (Rural and
Regional On Demand tender)
One of the key issues in any business collaboration is that of branding and customer ownership. There
exists a view that transportation network companies delivering intermediate modes are keen to integrate
additional modes (including public transport) as part of their existing branding, whilst bus operators are
wary of losing their branding and identity in any MaaS-type service offering. This concern was raised
prominently at the Thredbo 15 conference3 in Stockholm (August 2017) by Workshop 7 participants on the
‘uberisation’ of public transport and MaaS (Mulley and Kronsell 2018). Research at ITLS is further
investigating the conditions for stakeholder support/investment (including from both mode-specific
operators and non-mobility providers) in MaaS broker businesses including how brand issues might affect
bidding power (Hensher 2018).
3
The International Conference Series on Competition and Ownership in Land Passenger Transport, commonly known
as Thredbo (http://www.thredbo-conference-series.org)
©Bus Industry Confederation Inc. Last Updated 8/12/2018 Mass Trans Cities/AVs_on_Denmand Page 17 of 30Submission to the House Standing Committee on Infrastructure, Transport and Cities Inquiry
Bus Industry Confederation
PUBLIC TRANSPORT SERVICE SUBSIDIES
Discussion in the previous section noted that fare concessions may continue under a public transport future
in which MaaS, using AEVs, provides a significant share of local PT. Those fare concessions are usually
provided to assist groups of people, likely to be transport disadvantaged, to have increased travel
opportunities, with seniors and young people/children usually eligible, together with a range of others (e.g.,
health care holders, disability support pensioners). There is no reason, a priori, to expect that such fare
concessions will be any less relevant in coming years than they are today, to help assure better mobility
opportunities for potentially transport disadvantaged groups. We thus assume that fare concessions will
continue. The question remains, though, what might happen to public transport service subsidies currently
provided by state governments to support PT operations?
The answer to this question depends in part on future road pricing reform. Workshop participants at the
Thredbo 15 Conference (Workshop 5) developed the following formula, to enable estimation of the level of
cost recovery that should be sought from system users via fares (Stanley and Ljungberg 2018):
(1) Amount to be re-covered by user fares = MSC – PTEB – MSLC
where:
MSC = (Efficient) Marginal social cost of PT service
PTEB = the net external benefits of PT (system-external benefits, such as agglomeration
economies, health benefits and environmental benefits, should be funded by beneficiaries if
possible; system-internal benefits, particularly Mohring network scale benefits4, should be funded
by government)
MSLC = Minimum (safety net) service level cost (which should be funded by government).
4
The Mohring effect (Mohring 1972) is listed as a potential benefit of public transport in the Externalities: system-
internal category. This benefit item essentially refers to scale or network benefits that may sometimes accrue to PT
users from increased PT service levels. For example, more frequent PT services, in response to increasing demand,
imply shorter waiting times, with marginal waiting costs less than average waiting costs. For example, Jansson,
Holmgren and Ljungberg (2015) suggest that 30-75% of urban PT marginal costs might potentially be eligible for
subsidization in an optimal pricing model, solely because of the Mohring effect.
©Bus Industry Confederation Inc. Last Updated 8/12/2018 Mass Trans Cities/AVs_on_Denmand Page 18 of 30Submission to the House Standing Committee on Infrastructure, Transport and Cities Inquiry Bus Industry Confederation Public transport service subsidies are currently justified, in large part, because road users do not meet the societal costs attributable to their travel choices, including congestion, air pollution, GHG emissions, accident costs, etc. If road use was priced so that users were required to fully meet the marginal social costs attributable to their road use, then a large part of the system-external benefit component of PTEB, that essentially relates to road use being improperly priced, would drop out of the PT fare setting equation, implying higher fares. Lower service costs from shared mobility solutions may mean, however, that PT fares may not need to rise. Australian urban PT cost recovery rates around 30% are common on marginal costs and, recognizing that some of the elements in equation (1) will remain under road pricing reform (PT system-internal external benefits plus social inclusion benefits), suggests the potential for fares to be at broadly similar levels to today in a system where shared mobility solutions provide much of the local transit task. 5 Australian Governments at federal and state level have long resisted road pricing reform, in spite of numerous inquiries proposing implementation. However, the erosion of fuel tax revenues, as EVs increasingly penetrate the vehicle market and as fuel efficiencies of ICEs further improve, will force governments to confront this issue in the medium term, with mass, distance, location-based pricing probably the most efficient solution. Furthermore, we argue that road pricing reform is a crucial weapon in the policy armoury required to maximize the likelihood that AEVs will deliver net societal benefits, through the incentives that pricing reform will provide to solutions that involve shared mobility (Scenario 1). We therefore make the heroic assumption that, within a decade or so, road user charges will much more closely reflect the societal costs attributable to road use and that PT fares will need to be more cost reflective in response. Considering equation (1), in a future road pricing setting where user charges fully reflect the social costs associated with road use, there remains a long-term argument to support PT and PT-like services because of (1) the continuing wider economic benefits (e.g., agglomeration economies) that depend on trunk PT services, (2) network economies and (3) social inclusion benefits. In the case of (2), Mohring network external benefits, subsidization of trunk services will be the main policy direction and subsidy arrangements should be reflected in mass transit service contracts. For (3), social inclusion benefits, the focus for incidence is mainly on local transit services, including those lowly patronized services that will be at greatest risk under a future with MaaS shared mobility services playing a much larger role. Should operators (who could be new local shared mobility providers rather than existing PT providers) be supported to continue to provide some services that cater for this market in particular service areas, with service rights the subject of a competitive tendering process or negotiated performance-based contracts, as we have argued should continue in the mass transit market? Alternatively, should social inclusion support be provided to (particular) users through user-side subsidies, who are then left to choose how to use that support, along the lines of the National Disability Insurance Scheme model? 5 In support of this proposition, Thredbo 15 Workshop 5 participants concluded that, taking account of the potential scale of externalities: system-internal benefits, from the Mohring effect, and the value of (user) social inclusion benefits, cost recovery rates from fares for urban PT of well under 50% should commonly be expected, with rural fare cost-recovery rates lower than urban. ©Bus Industry Confederation Inc. Last Updated 8/12/2018 Mass Trans Cities/AVs_on_Denmand Page 19 of 30
Submission to the House Standing Committee on Infrastructure, Transport and Cities Inquiry
Bus Industry Confederation
If social inclusion is seen as a societal priority, then some base level of shared mobility service to support
or underwrite this outcome is warranted. We see no other way of assuring minimum local mobility
opportunities are available to ‘at risk’ people. By implication, local shared mobility contracts should be
developed to support provision of base social transit service levels, which would be expected to vary by
demographic/land use setting. For example, expectations should realistically be for a lesser service level in
a rural area than in a town. Requisite minimum service levels need to be set out in the contracts and might
be expressed, for example, in terms of
seat kilometres to be supplied per time period/spatial setting, where time periods and spatial
settings are specified, or
the maximum wait time for a demand-responsive service, within particular locations and time
periods.
Any such clauses would require mechanisms to be in place (e.g., bonuses, penalties), to help assure
compliance. In pricing such shared mobility contract services, operators would be expected to take account
of opportunities for cross-subsidization from more commercially viable services, to increase their chances
of placing a successful bid.
In the interests of more efficient, integrated service delivery at minimum call on the public purse, shared
mobility service contracts should be as broad as possible, generally seeking to encompass route type PT
services, school services and community transport service offerings. Depending on the legal context in a
particular jurisdiction, shared mobility contracts would be open to bidding by mass transit operators, local
transit operators and other shared mobility providers, including MaaS brokers if they so wished. They
would be area-based contracts, to provide sufficient scale to achieve some service economies, with
population catchments being the basis for area definition where they exist (e.g., in regional and rural
areas). Fare concession reimbursements to particular categories of user would continue to be relevant to
such services (and others), preferably funded from a welfare budget!
An alternative way to approach social inclusion benefits is to pay the equivalent of a service subsidy to
particular categories of at-risk users, probably subsuming existing fare concessions, and enable recipients
to use the money thus allocated to purchase shared mobility services on the market. This would require
identification of specific categories of eligible customers, for whom the support would be available, and a
means of identifying these users when they use a shared mobility service. The latter would be easy to
achieve through an app-based approach, provided eligible users all had access to such technology (most,
but not all, will). Shared mobility providers would then claim on the state government for services
provided, as measured through the app-based system.
However, identification of people at risk of mobility-related social exclusion is no easy task. At-risk groups
can be readily listed, such as youth, older people, people with a disability, recent arrivals, etc., but risks of
mobility-related social exclusion do not apply to all members of such groups. Household income is not
always a useful indicator, since young people from high-income households can be transport
disadvantaged. Also, making service subsidy funds available only to particular identified categories of users
creates a risk of service not being available to some people who do not fit neatly into the defined
categories but are, nonetheless, at real risk of mobility-related social exclusion. Similarly, some people who
are currently eligible for fare concessions have high incomes and are probably not at much risk of mobility-
©Bus Industry Confederation Inc. Last Updated 8/12/2018 Mass Trans Cities/AVs_on_Denmand Page 20 of 30You can also read