Decision Regulation Impact Statement - Household Refrigerators and Freezers - Energy Rating
←
→
Page content transcription
If your browser does not render page correctly, please read the page content below

Decision Regulation Impact
Statement – Household
Refrigerators and Freezers

Regulatory reform opportunities and improving energy efficiency outcomes

November 2017

A joint initiative of Australian, State and Territory
and New Zealand Governments
This work is licensed under the Creative Commons Attribution 3.0 Australia Licence.
To view a copy of this license, visit http://creativecommons.org/licences/by/3.0/au
The Department of the Environment and Energy on behalf of the Equipment Energy Efficiency (E3)
Program asserts the right to be recognised as author of the original material in the following manner:

© Commonwealth of Australia (Department of the Environment and Energy) 2017.
The material in this publication is provided for general information only, and on the understanding that
the Australian Government is not providing professional advice. Before any action or decision is taken on
the basis of this material the reader should obtain appropriate independent professional advice.
This document is available at www.energyrating.gov.au
While reasonable efforts have been made to ensure that the contents of this publication are factually
correct, the E3 Program does not accept responsibility for the accuracy or completeness of the content, and
shall not be liable for any loss or damage that may be occasioned directly or indirectly through the use of,
or reliance on, the contents of this publication.

                                               Decision RIS – Household refrigerators and freezers             ii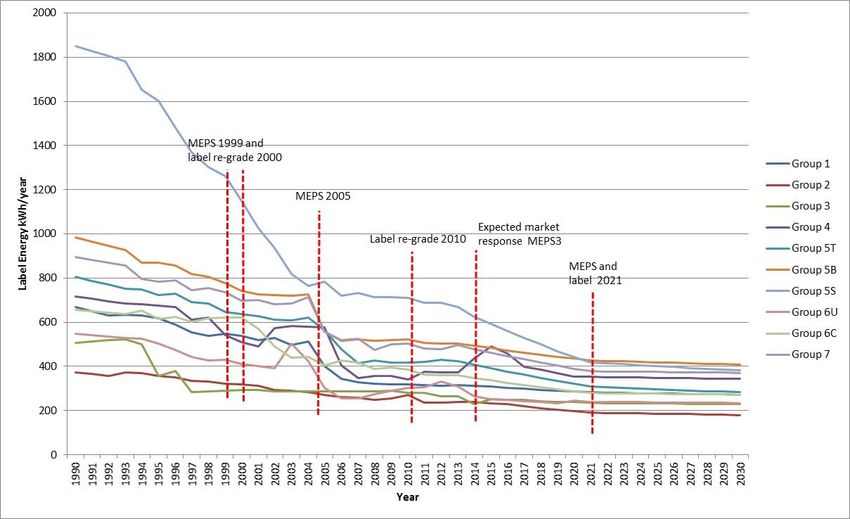
Contents

EXECUTIVE SUMMARY ................................................................................................................................................... VI
1.     INTRODUCTION ......................................................................................................................................................... 9
       1.1 Background ................................................................................................................................................................9
       1.2 Regulatory Environment ...........................................................................................................................................9
       1.3 The Market ............................................................................................................................................................... 14
2.     THE PROBLEM......................................................................................................................................................... 21
       2.1 MEPS ........................................................................................................................................................................ 21
       2.2 Test standard ...........................................................................................................................................................23
3.     OBJECTIVE .............................................................................................................................................................. 24
4.     OPTIONS .................................................................................................................................................................. 25
       4.1 Option A: BAU .........................................................................................................................................................25
       4.2 Option B: Adopt MEPS3 ..........................................................................................................................................25
       4.3 Option C: Adopt MEPS3 and IEC test standard .....................................................................................................26
5.     IMPACTS .................................................................................................................................................................. 30
       5.1 Option A: BAU ........................................................................................................................................................ 30
       5.2 Option B: Adopt MEPS3 ......................................................................................................................................... 30
       5.3 Option C: Adopt MEPS3 and IEC test standard .....................................................................................................34
6.     CONCLUSION........................................................................................................................................................... 37
       6.1 Recommended option.............................................................................................................................................. 37
7.     IMPLEMENTATION AND REVIEW........................................................................................................................... 38
       7.1 Implementation ...................................................................................................................................................... 38
       7.2 Energy Rating Label design .................................................................................................................................... 38
       7.3 Review ...................................................................................................................................................................... 41
8.     CONSULTATION ...................................................................................................................................................... 42
       8.1 Past Consultations ...................................................................................................................................................42
ATTACHMENT A – TRENDS ........................................................................................................................................... 44
   A.1 Sales Trends ............................................................................................................................................................ 44
   A.2 Stock Trends ............................................................................................................................................................45
   A.3 Price Trends ............................................................................................................................................................ 46
ATTACHMENT B – MODELLING .................................................................................................................................... 51
   B.1 Cost benefit analysis key parameters and inputs ................................................................................................... 51
   B.2 Sensitivity analysis ...................................................................................................................................................54
   B.3 Charts .......................................................................................................................................................................56
ATTACHMENT C – ELECTRICITY PRICES AND GHG EMISSIONS FACTORS ........................................................... 61
ATTACHMENT D – CONSULTATIONS ........................................................................................................................... 63
ATTACHMENT E – CONSULTATION RIS SUBMISSIONS............................................................................................. 71
ATTACHMENT F – MEPS3 LEVELS ............................................................................................................................... 75
ATTACHMENT G – PERFORMANCE AND TEST PARAMETERS ................................................................................. 76
REFERENCES ........................................................................................................................................81

                                                                                      Decision RIS – Household refrigerators and freezers                                               iii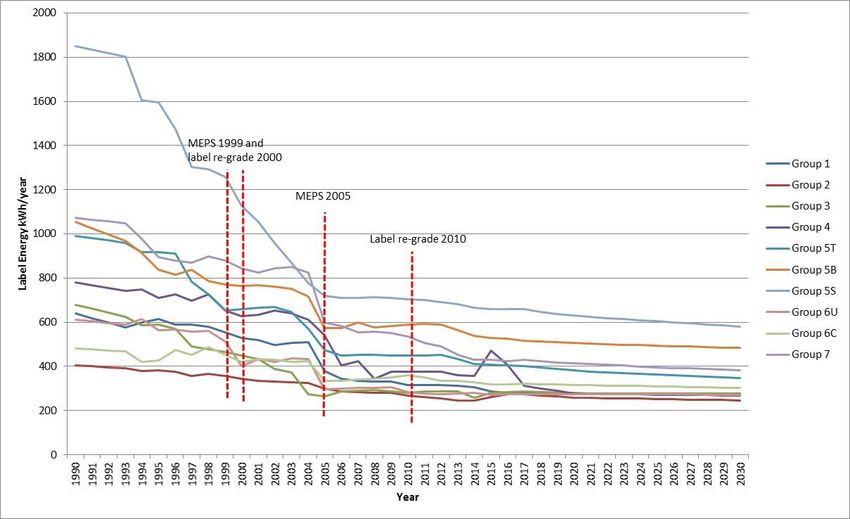
LIST OF FIGURES
Figure 1: Improvements to refrigerator and freezer efficiency – Australia (1993-2017) ............................................. 13
Figure 2: Improvements to refrigerator and freezer efficiency – New Zealand (2002-2016) ..................................... 13
Figure 3: Refrigerator sales by star rating – Australia (2005-2017) ............................................................................ 16
Figure 4: Freezer sales by star rating – Australia (2005-2017) .................................................................................... 16
Figure 5: Refrigerator and freezer sales by star rating – New Zealand (2011-2016) ....................................................17
Figure 6: Refrigerator energy and real price trends – Australia (1993-2017) .............................................................. 19
Figure 7: Freezer energy and real price trends – Australia (1993-2017) ......................................................................20
Figure 8: Nations with MEPS and/or ERLs ................................................................................................................... 22
Figure 9: Refrigerator ownership trends and projections – Australia and New Zealand ............................................ 36
Figure 10: Freezer ownership trends and projections – Australia and New Zealand .................................................. 36
Figure 11: ERL designs .................................................................................................................................................... 39
Figure 12: Annual sales of refrigerators and freezers – Australia and New Zealand ................................................... 44
Figure 13: Refrigerator stock – Australia and New Zealand ......................................................................................... 45
Figure 14: Freezer stock – Australia and New Zealand ................................................................................................. 45
Figure 15: Average group 1 prices – Australia ................................................................................................................ 46
Figure 16: Average group 2 prices – Australia ............................................................................................................... 46
Figure 17: Average group 3 prices – Australia ............................................................................................................... 47
Figure 18: Average group 4 prices – Australia ............................................................................................................... 47
Figure 19: Average group 5B prices – Australia ............................................................................................................. 48
Figure 20: Average group 5S prices – Australia ............................................................................................................ 48
Figure 21: Average group 5T prices – Australia ............................................................................................................. 49
Figure 22: Average group 6C prices – Australia ............................................................................................................ 49
Figure 23: Average group 6U prices – Australia ............................................................................................................ 50
Figure 24: Average group 7 prices – Australia ............................................................................................................... 50
Figure 25: Refrigerator sales trend by group – Australia .............................................................................................. 56
Figure 26: Freezer sales trend by group – Australia...................................................................................................... 56
Figure 27: Refrigerator sales trend by group – New Zealand ....................................................................................... 57
Figure 28: Freezer sales trend by group – New Zealand ............................................................................................... 57
Figure 29: Energy consumption by group for Option A (BAU) – Australia ................................................................. 58
Figure 30: Energy consumption by group for Option C (MEPS3 + IEC) – Australia .................................................. 58
Figure 31: Energy consumption by group for Option A (BAU) – New Zealand ........................................................... 59
Figure 32: Energy consumption by group for Option C (MEPS3 + IEC) – New Zealand ........................................... 59
Figure 33: Refrigerator lifetime ......................................................................................................................................60
Figure 34: Freezer lifetime ..............................................................................................................................................60

LIST OF TABLES
Table 1: Cost/benefit estimates – Australia (appliances installed from 2015-2030) .................................................. vii
Table 2: Cost/benefit estimates – New Zealand (appliances installed from 2015-2030) ........................................... vii
Table 3: Household refrigerating appliance classes/groups .......................................................................................... 11
Table 4: Typical refrigerator and freezer characteristics – Australia (2017) ................................................................ 14
Table 5: Refrigerator sales – Australia (2017) ............................................................................................................... 15
Table 6: Freezer sales – Australia (2017) ....................................................................................................................... 15
Table 7: Refrigerator sales – New Zealand (2016) ......................................................................................................... 15
Table 8: Freezer sales – New Zealand (2016) ................................................................................................................ 15
Table 9: Average prices – Australia ($2017) ...................................................................................................................17
Table 10: Group 2 star/price comparison – Australia (2016-2017).............................................................................. 18
Table 11: Group 5B star/price comparison – Australia (2016-2017) ............................................................................ 18
Table 12: Group 5T star/price comparison – Australia (2016-2017) ............................................................................ 18
Table 13: Group 6C star/price comparison – Australia (2016-2017) ........................................................................... 19
Table 14: Group 6U star/price comparison – Australia (2016-2017) ........................................................................... 19
Table 15: Estimated converted (standardised) MEPS levels (kWh/annum) ................................................................ 21
Table 16: Proposed ERL algorithm parameters ............................................................................................................. 28
Table 17: International adoption of IEC test parameters .............................................................................................. 29
Table 18: Expected energy reduction by group, 2014 to 2021 – Option B (sales weighted) ....................................... 31
Table 19: Average retail price increase and energy savings for Option B in 2021 – Australia .................................... 32

                                                                                Decision RIS – Household refrigerators and freezers                                        iv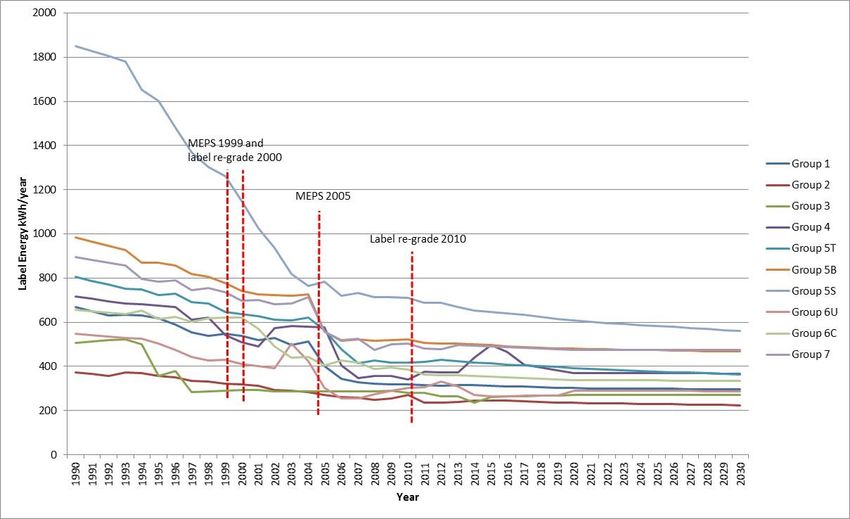
Table 20: Average retail price increase and energy savings for Option B in 2021 – New Zealand ............................. 32
Table 21: Evaluation of impacts – Option B (MEPS3) .................................................................................................. 33
Table 22: Evaluation of impacts – Option C (MEPS3 + IEC test standard) ................................................................. 35
Table 23: Indicative implementation timeline ............................................................................................................... 39
Table 24: Modelling assumptions and parameters........................................................................................................ 51
Table 25: Energy-price coefficients – Australia ............................................................................................................. 53
Table 26: Discount rate sensitivity analysis – Australia ................................................................................................ 54
Table 27: Discount rate sensitivity analysis – New Zealand ......................................................................................... 54
Table 28: GHG sensitivity analysis – Australia – A$11.82/tonne CO2-e ..................................................................... 55
Table 29: GHG sensitivity analysis – Australia – A$35.00/tonne CO2-e .................................................................... 55
Table 30: GHG sensitivity analysis – New Zealand – NZ$25.00/tonne CO2-e .......................................................... 55
Table 31: Residential electricity tariffs – Australia (real Au 2017 cents/kWh) ............................................................ 61
Table 32: Long-run marginal electricity cost – New Zealand (real NZ 2017 cents/kWh) ........................................... 61
Table 33: GHG emission factors for electricity – Australia and New Zealand (kg CO2-e/kWh) ................................ 62
Table 34: Summary of Stakeholder Submissions .......................................................................................................... 72
Table 35: MEPS cut-off level factors............................................................................................................................... 75
Table 36: Generally agreed performance parameters (Option B) ................................................................................. 76
Table 37: Generally agreed performance parameters (Option C) ................................................................................. 77
Table 38: Generally agreed test parameters (Option C) ................................................................................................ 78
Table 39: Test parameters that are proposed to not be included ................................................................................ 80

                                                                             Decision RIS – Household refrigerators and freezers                                    v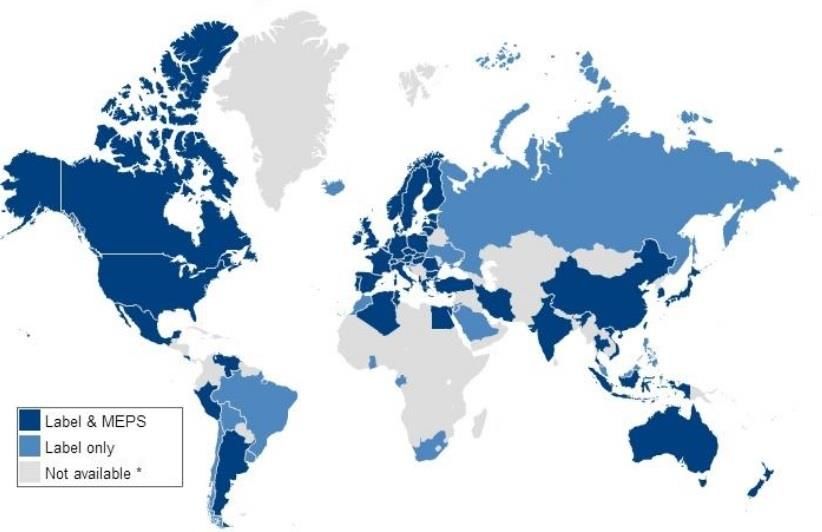
Executive Summary

Background
This decision Regulation Impact Statement (RIS) proposes changes to energy efficiency regulations applicable to
household refrigerators and freezers.

In 2016, around 1,050,000 refrigerators and freezers were sold in Australia, with an estimated refrigerator stock of
12.5 million units and a freezer stock of 3.3 million. In 2016, New Zealand refrigerator and freezer sales totalled
approximately 212,8001 and stock levels were estimated to be approximately 2.3 million and 1.1 million
resepectively.2

Regulations in both countries require that household refrigerators and freezers supplied to consumers meet
minimum energy performance standards (MEPS) and also display the Energy Rating Label (ERL). MEPS specify
the minimum level of energy performance that products/appliances must meet or exceed before they can be
offered for sale. The ERL provides consumers with a product’s energy performance information at point-of-sale
that enables them to compare similar products using their star ratings and estimated annual energy consumptions.

MEPS requirements were first introduced in 1999 in Australia (2002 in New Zealand) and were upgraded in 2005
in both countries. The ERL was introduced nationally in Australia in the early 1990s (2002 in New Zealand) and
was re-graded in Australia in 2000 and in both countries in 2010. These policy actions have been taken to reduce
energy use, lower greenhouse gas (GHG) emissions and provide consumers with improved purchasing
information.

Problem
Although the current regulations have largely achieved their objective of promoting the development and use of
more energy efficient refrigerators and freezers than would have been the case under business as usual (BAU),
regulatory failures exists because:
•      Current MEPS levels are set too low for Australia’s and New Zealand’s markets. In an environment where we
       now have access to a wider variety of cheaper and more efficient appliances, increased electricity costs mean
       that it is cost effective to mandate tighter MEPS levels. This will reduce consumers’ net costs of refrigeration
       ownership and also reduce the negative externality of GHG emissions.
•      Requiring suppliers to test their appliances to the Australian and New Zealand regionally-specific test
       standard for refrigerators and freezers makes appliance testing more complex than necessary, resulting in an
       unnecessarily high regulatory burden.

Consequently, there is scope to align Australia’s and New Zealand’s MEPS levels with those adopted by the United
States (US) in 2014, referred to as MEPS3. Further, referencing the International Electrotechnical Committee
(IEC) test standard (IEC 62552:2015 parts 1-3), rather than the regionally-specific Australian and New Zealand
test standard, will simplify product testing and lead to an efficiency improvement.

Objective
The objective of the proposed government actions is to resolve issues with the regulations that impede the supply
and purchase of energy efficient or effective household refrigerators and freezers. Without government action,
these market distortions and unnecessary costs would continue. Resolving the issues would also contribute to
government objectives to improve energy productivity and reduce GHG emissions.

1   Energy Efficiency and Conservation Authority (EECA) 2017
2   These stock levels exclude household products used in commercial settings for domestic purposes (e.g. offices), which could account
    for an additional 10 per cent of the stock.

                                                                Decision RIS – Household refrigerators and freezers                       vi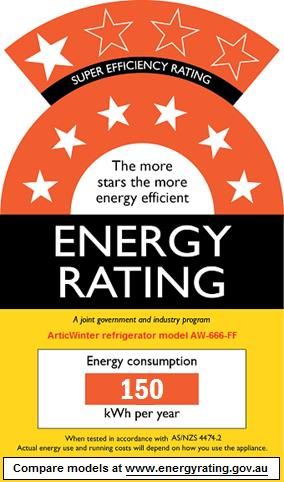
Policy options
In this RIS, a number of policy options (Options A, B and C) have been identified:
•      Option A: No changes to the existing regulatory requirements - BAU
•      Option B: Adopt MEPS3
•      Option C: Adopt MEPS3 and the IEC test standard and provide better information on the ERL.
Specific details concerning each option are provided in the Options section.

Cost benefit analysis
The estimated impacts of the proposals are shown in Table 1 and Table 2.
Table 1: Cost/benefit estimates – Australia (appliances installed from 2015-2030)

                                               GHG
                    Energy Saved                                    Total
                                            Emission                                Total Costs         Net Benefit          Benefit
                     (cumulative                                   Benefits
     Option                                 Reduction                                   (NPV,             (NPV,               Cost
                       to 2030)                                     (NPV,
                                           (cumulative                                  A$M)              A$M)                Ratio
                         GWh                                        A$M)
                                           to 2030) Mt
    Option B             4,098                   3.5               $1,180.6             $300.6             $879.9               3.9
    Option C             5,605                   4.7               $1,655.9             $401.7             $1,254.3             4.1
Notes: Discount rate = seven per cent real; AU$ 2017

Table 2: Cost/benefit estimates – New Zealand (appliances installed from 2015-2030)3

                                               GHG
                    Energy Saved                                    Total
                                            Emission                                Total Costs         Net Benefit          Benefit
                     (cumulative                                   Benefits
     Option                                 Reduction                                  (NPV,              (NPV,               Cost
                       to 2030)                                     (NPV,
                                           (cumulative                                 NZ$M)             NZ$M)                Ratio
                         GWh                                       NZ$M)
                                           to 2030) Mt
    Option B               995                  0.104                $82.1               $39.1              $43.0               2.1
    Option C              1,120                 0.116                $93.7              $45.0               $48.7               2.1
Notes: Discount rate = six per cent real; NZ$ 2017

Consumers will receive the overwhelming majority of the benefits quantified in Options B and C through reduced
consumers’ energy consumption and ongoing electricity cost savings. For example, if Australia and New Zealand
were to adopt MEPS3 levels, consumers could expect to save approximately A$145 in reduced energy costs over the
life of an average refrigerator.4

Option C provides an opportunity to use parts of the IEC test method to enhance the information provided on the
ERL concerning energy consumption during normal use in Australian and New Zealand homes. This will provide
consumers with better information on the appliances’ likely energy consumption and also encourage
manufacturers to optimise appliances’ efficiency under these conditions.

In addition, because Option C would only require that industry use the IEC 62552 test standard, rather than the
unique Australia/New Zealand test standard, it would simplify product testing and lead to an efficiency
improvement.

Option C remains effective if the discount rate is increased to 10 per cent in the Australian case (benefit cost ratio
of 3.46:1) or increased to eight per cent in the New Zealand case (benefit cost ratio of 1.77:1).

3   New Zealand modelling results are based on partial economic modelling whereas the Australian results are based on financial
    modelling of consumer impacts. See Attachment B for further details.
4   Based on: the purchase price of an average 5B refrigerator (i.e. a refrigerator compartment on the top of the unit and freezer
    compartment on the bottom); a simple payback period of about two years and ten months; a product life of approximately 16 years;
    and an electricity tariff of 28 cents/kWh.

                                                               Decision RIS – Household refrigerators and freezers                     vii
Recommendation
The Energy Efficiency Advisory Team, which manages the Equipment Energy Efficiency (E3) Program,
recommends adopting policy Option C because it would:
•    deliver the greatest net benefit to the Australian and New Zealand economies - A$1,254.3 million and
     NZ$48.7 million respectively
•    provide the best benefit cost ratios – 4.1:1 and 2.1:1 respectively
•    significantly reduce Australia’s and New Zealand’s cumulative greenhouse gas (GHG) emissions to 2030 –
     4.7 Mt and 116 kt respectively.5

Option C has also received general support from industry and other stakeholders.

The cost-benefit analysis in this RIS has also shown that there will be significant additional costs on consumers if
the current MEPS levels for refrigerators and freezers remain unchanged.

Implementation and Review
The main implementation risk from the proposed policy option is that suppliers may not have sufficient time to
adjust to the proposed new regulations. This could affect the availability of products, market competition or
compliance with the new regulations. This risk has been largely addressed by lengthening the proposed
implementation time from one year to two years.

Further, this risk would be also mitigated by introducing a procedure whereby the Regulator would assess whether
products with existing registrations be deemed to be compliant with MEPS3 levels and can continue to be sold for
the remainder of their registration periods without being required to re-test to the IEC test standard. This
approach would significantly reduce both regulatory and administrative burdens during the transition period. It
would also help to ensure that there would be an adequate breadth of product offerings and that consumers would
continue to have access to a competitive market.

If the Council of Australian Governments (COAG) Energy Council approves to change the regulations, the
Australian legal instrument, the Greenhouse and Energy Minimum Standards (Household Refrigerating
Appliances) Determination 2012 (the Determination) would be revised for approval by the Commonwealth
Minister for the Environment and Energy. In New Zealand, a policy option needs to be approved by Cabinet before
being adopted under the Energy Efficiency (Energy Using Products) Regulations 2002. If approved, the updated
regulations would be subject to compliance monitoring and review in both countries.

To help consumers understand changes that will occur to the ERL once the Determination becomes effective, E3
will continue to engage with retailers and consumer groups via established processes so that they, and ultimately
consumers, can understand what the labelling changes mean and how to best select more efficient appliances.
Relevant information will also be provided on the E3 website.

For Australia, a regulatory offset has not been identified to accompany Option C. However, the Commonwealth
Department of the Environment and Energy is seeking to pursue net reductions in compliance costs and will work
with affected stakeholders and across Government to identify regulatory burden reductions where appropriate.

Consultation
Extensive consultation processes have been undertaken between 2011 and 2017, including numerous stakeholder
forums and bilateral meetings. During 2017, stakeholder feedback was sought on the policy options presented in a
consultation RIS that was released on 13 April 2017. Submissions were invited over a six and a half week period
and six public and one confidential submissions were received. Over this period, E3 officials also held public
briefing sessions in Sydney, Melbourne and Auckland where policy and modelling briefings were given and
stakeholders were encouraged to provide feedback on the regulatory options presented. In August 2017, a
stakeholder meeting was held to discuss issues that had been raised by stakeholders. The policy positions in this
decision RIS are based on an understanding and consideration of the full range of stakeholders’ views that have
been presented.

5   GHG emissions have been accounted for as carbon dioxide equivalent units (CO2-e).

                                                             Decision RIS – Household refrigerators and freezers   viii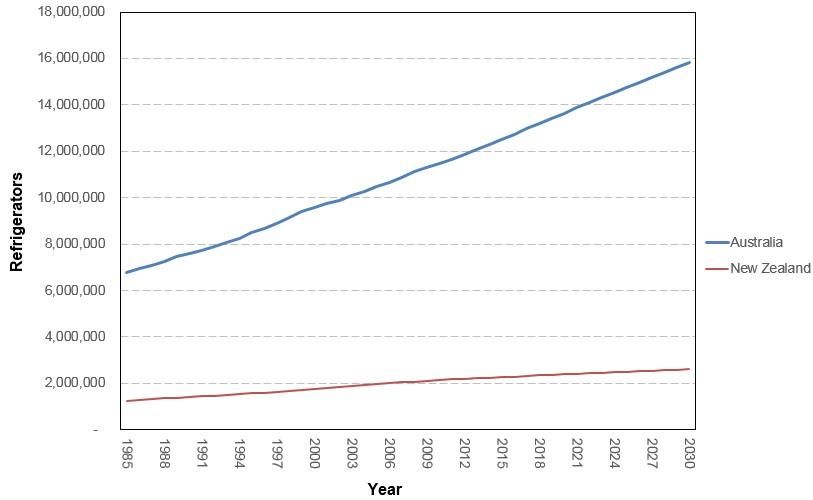
1. Introduction

1.1       Background
This decision Regulation Impact Statement (RIS) examines options designed to encourage improvements in the
energy efficiency of household refrigeration appliances sold in Australia and New Zealand. Household refrigerators
and freezers are also used in commercial settings such as offices and factories for domestic-type purposes. It is
estimated that up to 10 per cent of the stock of household refrigerating appliances may be used in commercial
settings. However, these units are not considered within the modelling scope of this RIS because there is no
accurate estimation of their stock numbers. Therefore, future energy savings and reductions in greenhouse gas
emissions from these units that could be realised from instituting options in this RIS would be additional,
non-quantified benefits of the regulatory proposals herein.

A refrigerator is a cooling appliance used for keeping food fresh by the process of refrigeration. A freezer is either a
stand-alone appliance or a compartment of the refrigerator used to store food or other perishable items at
temperatures below zero degrees Celsius (°C). Refrigerators and freezers have an insulated cabinet with a
refrigeration circuit that uses the vapour compression cycle6 to extract heat from the internal compartments and
rejects this to the surrounding room. Internal temperatures are maintained within narrow ranges that are suitable
for the specified compartment type.

A refrigerator/freezer can be a significant energy consumer in many households as nearly all households contain at
least one refrigerator that is operating 24 hours a day, seven days a week. They are seen as an important long-term
household investment. Refrigerators and freezers contribute on average to approximately 10 per cent of
households’ electricity demand in Australia and New Zealand.7 8

1.2       Regulatory Environment
Australia
In 2012, the Greenhouse and Energy Minimum Standards Act 2012 (GEMS Act)9 came into effect, creating a
national framework for product energy efficiency in Australia. The GEMS Regulator replaced the previous state
regulators, and is the sole party responsible for administering the legislation in Australia. The specific
requirements for each product regulated under the GEMS Act are set out in legislative instruments called GEMS
determinations that are specific to relevant product types. Refrigerators and freezers are covered by the
Greenhouse and Energy Minimum Standards (Household Refrigerating Appliances) Determination 2012 (the
Determination) and they must meet certain regulatory requirements before they can be supplied or sold in
Australia. The Determination references the standard AS/NZS 4474.2 for many of the technical requirements.

New Zealand
Since 2002, New Zealand has regulated the energy performance of products through the Energy Efficiency
(Energy Using Products) Regulations 2002, which are administered by the Ministry of Business, Innovation and
Employment (MBIE). MBIE incorporates changes to MEPS based on advice from the Energy Efficiency and

6 It is recognised that are other refrigeration cycle types but this RIS does not consider appliances that do not utilise the vapour
  compression cycle because the Determination excludes them from regulation.
7 Department of the Environment, Water, Heritage and the Arts (2008) and Energy Consult (2015)

8 BRANZ (2010)

9 Australian Government (2012)1

                                                                  Decision RIS – Domestic refrigerators and freezers                   9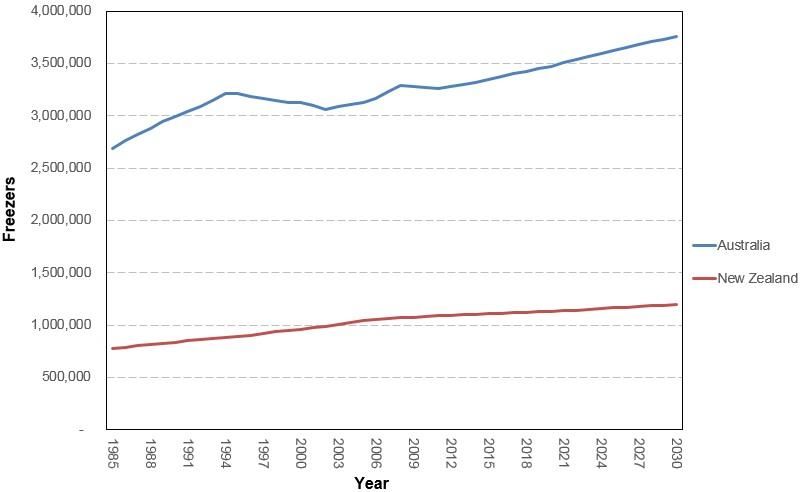
Conservation Authority (EECA), developed with Australian regulators under the joint trans-Tasman E3 Program.
The New Zealand Regulations reference the standard AS/NZS 4474.2 for many of the technical requirements. The
Regulations generally mirror the requirements of the Determination.

In Australia and New Zealand, energy efficiency regulations have been introduced to address market failures
associated with household refrigerators and freezers; namely:
•        The Energy Rating Label (ERL) was introduced nationally in 1992 in Australia10 (and in 2002 for
         New Zealand) to address an information failure because it was agreed that consumers had inadequate
         information concerning the relative energy efficiency and energy consumption of appliances when making
         purchasing decisions.
•        Minimum energy performance standards (MEPS) were introduced in 1999 in Australia for a number of
         reasons including limiting negative externalities11 due to greenhouse gas (GHG) emissions generated from the
         operation of appliances and to reduce energy use. New Zealand adopted MEPS in 2002 to raise the energy
         efficiency of products sold in New Zealand in order to reduce energy consumption and related emissions and
         deliver a net national benefit. MEPS have also proven to be an effective tool to reduce the energy consumption
         of consumer market segments that are unresponsive to labelling.

1.2.1 Energy Rating Labelling
The ERL provides consumers with energy performance information at point-of-sale on a range of products
(including refrigerators and freezers) that are regulated under GEMS and the New Zealand Regulations.
Consumers can use the ERL to compare the star ratings and estimated annual energy consumptions of similar
product models and therefore have the information choose the most efficient products that meet their needs.

Energy labelling formulae (known as algorithms) are used in conjunction with test methods prescribed in the
relevant determinations/regulations to calculate appliances’ energy star ratings. This ensures that the lowest
performing products are allocated low star ratings and better performing products are awarded more stars.

The ERL star ratings for all appliances are reviewed from time to time and the star rating algorithms changed to
ensure there are appropriate incentives for manufacturers to continually improve appliance efficiency. In 2005
when refrigerator and freezer MEPS were raised it was also noted that the majority of products had star ratings
clustered around the range of 3.5 to 5.0 stars. In 2010, the refrigerator and freezer algorithm used to generate star
ratings was revised in order for the ERL to continue to be an effective tool. At that time, all refrigerators and
freezers ERL star ratings were decreased by approximately 2.0 stars to encourage the supply of more efficient
appliances.

1.2.2 Minimum energy performance standards
MEPS specify a minimum level of energy performance that appliances, such as refrigerators and freezers, must
meet or exceed before they can be supplied to consumers. MEPS are mandatory for household refrigerators and
freezers in Australia and New Zealand and it has been agreed that they are an appropriate and effective policy
option to increase the energy efficiency of products. The use of MEPS means that inefficient products are
prevented from entering the market and manufacturers are given appropriate signals to increase product
efficiency. For consumers, MEPS mean that all products available in the market meet minimum energy
performance targets and have lower running costs over their lifetime. Importantly, MEPS deliver very significant
energy savings and emissions reductions that culminate in national benefits regardless of whether or not
consumers factor energy performance into their purchase decisions.

The Australian and New Zealand governments work together and consult with industry to determine the
appropriate MEPS levels for products. In 2005, household refrigeration MEPS levels were reviewed and tightened
(to MEPS2) resulting in products that were less efficient being removed from the market, which helped ensure that
manufacturers continued to develop and supply improved energy efficient products.

10   Some Australian states regulated refrigerators and freezers for energy labelling as early as 1986.
11   A negative externality is a cost that is incurred by a third party as a result of an economic transaction. In the case of refrigerators and
     freezers, negative externalities relate to the costs incurred by third parties due to emissions associated with the production and supply
     of electricity to power refrigerators and freezers.

                                                                    Decision RIS – Household refrigerators and freezers                       10
1.2.3 Scope of the Determination and Regulations
The Determination/Regulations cover the sale of new household refrigerating appliances irrespective of the
context in which they are used.12 Table 3 shows the product groups that are covered by the
Determination/Regulations. Refrigerators and freezers are classified into groups according to the configuration
and type of compartments and the defrosting technologies used.
Table 3: Household refrigerating appliance classes/groups
Group Configuration
1 Refrigerator without a low temperature compartment13, automatic defrost
2 Refrigerator with or without an ice making compartment, manual defrost (bar refrigerators)
Refrigerator with or without an ice making compartment, includes a short-term frozen food
3
compartment, manual defrost
4 Refrigerator-freezer, fresh food compartment is cyclic defrost, freezer is manual defrost
5B Refrigerator-freezer, both compartments automatic defrost, bottom mounted freezer
5S Refrigerator-freezer, both compartments automatic defrost, side by side
5T Refrigerator-freezer, both compartments automatic defrost, top mounted freezer
6C Chest freezer, all defrost types
6U Vertical freezer, manual defrost
7 Vertical freezer, automatic defrost
Source: AS/NZS 4474.1:2007, Table 1.1
The following refrigerating products are excluded from the scope of the Determination/Regulations and therefore
are not within the scope of this RIS:
(a) products which have a total gross volume of less than 60 litres and that are designed exclusively for use in
caravans and other vehicles including: mobile homes; campervans; rail cars; and boats;
(b) portable products that have a gross volume of less than 30 litres;
(c) products that have a gross volume of less than 30 litres where the refrigeration function is secondary, such as
boiled and cooled water dispensers;
(d) products that have no options for connection to a 230 volt or 400 volt mains electricity supply at 50 hertz;
(e) products that cool using technologies other than the vapour compression cycle;
(f) wine storage cabinets; or
(g) stand alone ice-makers.14
1.2.4 Standards and Testing
Standards are documents that set out specifications and testing procedures to ensure that products are safe,
reliable and consistently perform the way suppliers claim. Standards also set out specifications to ensure products
meet certain energy performance levels and other energy efficiency requirements. The Determination/Regulations
refer to the following Australian and New Zealand performance and test standards:
• AS/NZS 4474.1:2007 Performance of household electrical appliances – Refrigerating appliances – Part 1:
Energy consumption and performance including amendments 1 and 2 (also known as Part 1). This is the
test standard and includes: all ambient test conditions; the test method, requirements for temperature
performance; test materials and details the method for determining energy consumption.
12 For example, the Determination applies to household refrigerators and freezers used in a commercial context.
13 A ‘compartment’ which means a storage area with a separate external door or an internal sub-compartment.
14 Australian Government (2012)
Decision RIS – Household refrigerators and freezers 11• AS/NZS 4474.2:2009/ Amdt2:2014 Performance of household electrical appliances – Refrigerating
appliances – Part 2: Energy labelling and minimum energy performance standard requirements including
amendments 1 and 2 (also known as Part 2). This is the performance standard and includes: algorithms
for the calculation of the energy efficiency rating; star rating and comparative energy consumption;
performance requirements; details of the energy label; and application requirements. It also contains the
MEPS for refrigerators and freezers.
In Australia, suppliers must have their appliances tested in accordance with the test standard and they are
permitted to have tests performed in Australia or elsewhere. In Australia, the GEMS Regulator is responsible for
monitoring and compliance under the GEMS Act. Product compliance testing must be undertaken at a National
Association of Testing Authorities (NATA) accredited (or equivalent) laboratory.
In New Zealand, EECA is the regulator and manufacturers may test their models in their own laboratories which
do not have to be International Accreditation New Zealand (IANZ) or NATA accredited. However, all check tests
performed by the E3 Program are performed in a recognised and accredited laboratory.
AS/NZS 4474.1 is a regionally unique test standard and suppliers must pay to access this standard so they can
understand the testing requirements if they want to supply products into the Australian or New Zealand markets.
1.2.5 Product Registration
In order to supply products regulated under the GEMS Act and the Energy Efficiency (Energy Using Products)
Regulations 2002, suppliers must register their products online.15 Registrations need to be accompanied by a test
report that demonstrates that products meet MEPS. The results of the test report will also be used to determine the
energy consumption that is provided on the product’s ERL.
Products registered in Australia are considered registered under the New Zealand Regulations and these products
can be supplied in New Zealand. The Trans-Tasman Mutual Recognition Arrangement (TTMRA) provides that
products registered in New Zealand may be sold in Australia without the need for an Australian registration,
provided the product was imported into Australia from New Zealand.
1.2.6 Effectiveness of existing measures
The introduction of refrigerator and freezer MEPS in Australia and New Zealand have in the past compelled
market participants to supply appliances with improved energy efficiency, reducing: consumers’ energy costs;
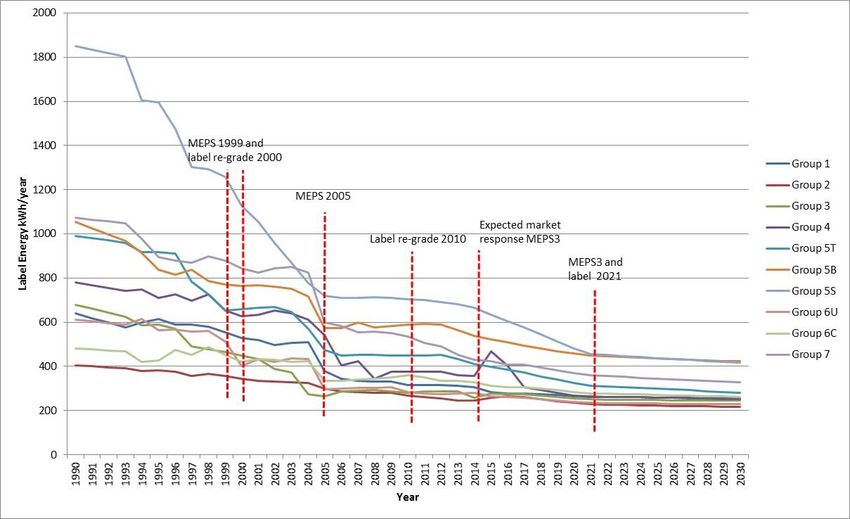
national energy demand; and related greenhouse gas emissions.16 Figure 1 and Figure 2 show that the
announcement and introduction of MEPS in Australia and New Zealand followed by the tightening of MEPS levels
in 2005 (to MEPS2), aligning MEPS levels with world’s best practice, have reduced the energy consumption of
refrigerators and freezers by approximately 50 per cent. ERL parameters have also been adjusted to help ensure
that consumers have relevant information that accurately represents the relative energy efficiency of products on
the market.
For refrigerators, in Australia, the introduction of MEPS2 in 2005 has resulted in financial savings in the range of
AU$1.83 to AU$2.92 billion in 2014 terms from 2005 to 2014. For freezers, in Australia, MEPS2 achieved financial
savings in the range of AU$246.5 million to AU$410.5 million in 2014 terms between 2005 and 2014.17
To meet more stringent MEPS levels, improvements by manufacturers have included better compressors,
improved insulation, more efficient fans (both reducing the fan motor’s energy use and its heat transfer to the food
compartment) and microchip control of the defrost cycle.
Figure 1 to Figure 3 show that since initial gains from the introduction of MEPS2 in 2005, there have been
relatively modest improvements in the energy efficiency of refrigerators and freezers supplied to Australia and
New Zealand. Efficiency improvements from 2013 can be attributed to a number of factors:
15 http://www.energyrating.gov.au/suppliers/registration
16 For example, Sustainable Victoria recently published its Refrigerator Retrofit Trial report that shows significant energy savings can
be achieved when replacing older refrigerators (often pre-MEPS) with newer, more efficient appliances.
17 Unpublished Department of the Environment and Energy figures
Decision RIS – Household refrigerators and freezers 12• The ERL regrade in 2010 encouraging the supply of more efficient models
• Announcement of MEPS3 in 2013
• The supply of more efficient appliances from overseas markets where governments have mandated tighter
MEPS levels, such as the United States of America (US) and Europe.
Figure 1: Improvements to refrigerator and freezer efficiency – Australia (1993-2017)
Source: Energy Efficient Strategies estimates (2017)
Figure 2: Improvements to refrigerator and freezer efficiency – New Zealand (2002-2016)
Source: Energy Efficiency and Conservation Authority (2016)
Notes: Data beginning from 2002 when these appliances were first regulated. Actual sales data is required to be
collected by EECA on an annual basis
Decision RIS – Household refrigerators and freezers 131.3 The Market
Australian manufacturing of whitegoods, including refrigerators and freezers, ceased in April 2016 and
New Zealand also ceased whitegoods manufacturing in late 2016. Since then, all refrigerating appliances have been
imported into Australia and New Zealand with refrigerators predominantly coming from China, Thailand,
South Korea, the US, Germany, Brazil, Japan, Mexico and Taiwan. The majority of freezers are imported from
China. Manufacturers and importers bring in appliances and supply them to retailers who sell to consumers.
1.3.1 Characteristics of appliances
Approximately 120 brands of refrigerators and freezers are registered for supply in Australia and New Zealand.
Major refrigerator brands include: Fisher and Paykel, Hisense, LG, Samsung and Westinghouse. Major freezer
brands include: Changhong, Fisher and Paykel, Haier, Hisense and Westinghouse. There are approximately 1,200
models of refrigerators and 370 models of freezers registered for supply in Australia and New Zealand.18
The average storage volumes of these appliances have continued to increase slightly over the past 20 years. In
2017, the average total volume of a refrigerator (refrigerator/freezer configuration) purchased in Australia was
417 litres and average freezer volume was 214 litres, as shown in Table 4. In New Zealand, the typical average
refrigerator volume tends to be slightly smaller than in Australia whereas the typical New Zealand freezer volume
tends to be slightly larger.
Table 4: Typical refrigerator and freezer characteristics – Australia (2017)
Characteristic Refrigerator Freezer
Fresh food volume (litres) 288 -
Freezer volume (litres) 122 214
Other volume (litres) 7 -
Average total volume (litres) 417 214
Label energy usage (kWh/year) 399 319
Average star rating (rounded) 3.0 2.5
Price (AU$2017) $1,063 $566
Source: Energy Efficient Strategies (2016) Whitegoods Efficiency Trends, pages 30 and 40, updated with 2017 GfK data
1.3.2 Stock
In 2016, the estimated Australian stock of household refrigerators was approximately 12.5 million units and freezer
stock was 3.3 million. New Zealand stock levels are estimated to be 2.3 million and 1.1 million respectively.19 Stock
estimates have been derived using Australian Bureau of Statistics and Statistics New Zealand data and estimates of
household refrigerator and freezer ownership levels. Stock levels are a function of sales adding to existing stock
and old appliances being retired. Industry estimates that the average refrigerator life is approximately 15-17 years
while freezers have a life expectancy of approximately 21-25 years.
1.3.3 Sales
In 2017, the five major refrigerator brands accounted for approximately 79 per cent of Australian sales and the five
major freezer brands accounted for approximately 93 per cent of sales.20 According to 2016 sales data,
approximately 900,000 refrigerators and 150,000 freezers were sold in Australia valued at approximately
$1.11 billion.21 As shown in Table 5, groups 5T and 5B dominate Australia’s refrigerator market with
18 The number of models refers to the number of registrations that include family of models registrations that rely on a single test report.
19 See Attachment A for time-series estimates of stock levels and Attachment B for stock assumptions.
20 GfK retail sales data which includes most products installed in offices and factories but does not cover direct wholesale purchases by
large companies (e.g. developers or hotel chains). However, this data covers approximately 95 per cent of the market and is the best
available source of sales data.
21 GfK sales data and Energy Efficient Strategies (2016) Whitegoods Efficiency Trends, Detailed Output Tables - updated with GfK data
to mid 2017.
Decision RIS – Household refrigerators and freezers 14approximately 77 per cent of sales, with group 2 (small bar refrigerators) capturing approximately 10 per cent and
group 5S holding about eight per cent.22
Table 5: Refrigerator sales – Australia (2017)
Refrigerator Group Percentage of Sales
1 4.0%
2 10.4%
3 0.6%
4 0.2%
5B 38.9%
5S 7.6%
5T 38.2%
Source: GfK sales data
As shown in Table 6, group 6C (chest freezers) accounts for about 52 per cent of Australia’s freezer sales and
group 7 (frost free vertical) holds about 29 per cent of sales.
Table 6: Freezer sales – Australia (2017)
Freezer Group Percentage of Sales
6C 51.5%
6U 19.8%
7 28.7%
Source: GfK sales data
In 2016, approximately 212,800 refrigerators and freezers were sold in New Zealand. 23 As shown in Table 7,
groups 5T and 5B lead the New Zealand refrigerator market with approximately 66 per cent of sales, group 2
captures approximately 15 per cent and group 5S holds 8 per cent.24
Table 7: Refrigerator sales – New Zealand (2016)
Refrigerator Group Percentage of Sales
1 3.8%
2 15.4%
3 0.8%
4 5.7%
5B 47.3%
5S 8.0%
5T 19.1%
Source: Energy Efficiency and Conservation Authority
As shown in Table 8, group 6C accounts for about 62 per cent of New Zealand’s freezer sales and group 6U holds
about 21 per cent of sales.
Table 8: Freezer sales – New Zealand (2016)
Freezer Group Percentage of Sales
6C 61.6%
6U 21.3%
7 17.1%
Source: Energy Efficiency and Conservation Authority
22 See Attachment B for Australian refrigeration and freezer time-series sales data
23 Energy Efficiency and Conservation Authority (2017)
24 See Attachment B for New Zealand refrigeration and freezer time-series sales data
Decision RIS – Household refrigerators and freezers 15Figure 3 and Figure 4 show Australian refrigerator and freezer sales by star rating from 2005 when MEPS2 was
introduced. Consumers have gradually shifted purchasing preferences to more efficient products. In 2017,
approximately 60 per cent of refrigerators sold carried three or more stars and about 65 per cent of freezers carried
three or more stars.
Figure 3: Refrigerator sales by star rating – Australia (2005-2017)
Source: GfK sales data. 2017 sales are based on six months of data that has been scaled up
Figure 4: Freezer sales by star rating – Australia (2005-2017)
Source: GfK sales data. 2017 sales are based on six months of data that has been scaled up
Decision RIS – Household refrigerators and freezers 16Figure 5 shows that New Zealand consumers have been shifting their purchasing decisions towards more efficient
appliances. In 2016, approximately 45 per cent of appliances sold carried 2.5 or more stars.
Figure 5: Refrigerator and freezer sales by star rating – New Zealand (2011-2016)
Source: Energy Efficiency and Conservation Authority
1.3.4 Prices
The real average prices of household refrigerating appliances in all product groups have trended down over time.
Table 9 provides the average price in Australia for the typical refrigeration appliance in each group (detailed
time-series price data is at Attachment A). It is understood that these trends have also been occurring in
New Zealand because the majority of products sold in both markets are identical and the levels of retail
competition in Australia and New Zealand are likely to be similar. There are no trade barriers between Australia
and New Zealand under the TTMRA and all major refrigerator suppliers compete in both markets.
Table 9: Average prices – Australia ($2017)
Group Average price
1 $893
2 $288
3 $374
4 $484
5B $1,563
5S $1,452
5T $753
6C $404
6U $330
7 $1,026
Source: Energy Efficient Strategies (2016) Whitegoods Efficiency Trends,
Detailed Output Tables updated with 2017 GfK data
Decision RIS – Household refrigerators and freezers 17Australian sales data indicates that improved energy efficiency does not necessarily carry a retail price premium. In
some instances refrigerators and freezers with greater efficiencies retail for lower prices. Table 10 shows that
while there is a price premium (per litre) for 2.5 star group 2 refrigerators, 3.0 star appliances generally retailed
cheaper than other star ratings. Similarly, Table 11 and Table 12 show that energy efficient group 5B and 5T
refrigerators do not necessarily carry a price premium, and in some groups, more efficient refrigerators retail
cheaper (e.g. on a per litre basis, a 4.5 star 5B refrigerator is generally sold cheaper than a 2.0 to 3.5 star
refrigerator and a 4.0 star 5T refrigerator is generally sold cheaper than a 3.5 star). These tables need to be
carefully interpreted because some table cells have have few models and, in these cases, characteristics may not be
representative of the group.
Table 10: Group 2 star/price comparison – Australia (2016-2017)
Star Rating 1.0 1.5 2.0 2.5 3.0
Number of Models 23 12 19 11 13
Average Volume (litres) 84.5 88.8 129.1 181.0 170.0
Average Price (2013$) $216 $210 $278 $477 $362
Energy 268.3 242.1 225.5 216.7 189.7
$/litre $2.56 $2.36 $2.16 $2.63 $2.13
Source: Energy Efficient Strategies (2016) Whitegoods Efficiency Trends, page 95 - updated with 2017 GfK data
Table 11: Group 5B star/price comparison – Australia (2016-2017)
Star Rating 1.5 2.0 2.5 3.0 3.5 4.0 4.5
Number of Models 7 46 67 77 65 19 10
Average Volume (litres) 416.7 532.4 621.3 514.3 474.5 441.5 468.3
Average Price (2013$) $1,193 $1,734 $2,222 $1,589 $1,466 $1,048 $1,337
Energy 555.2 610.7 589.9 460.8 394.3 327.2 304.3
$/litre $2.86 $3.26 $3.58 $3.09 $3.09 $2.37 $2.86
Source: Energy Efficient Strategies (2016) Whitegoods Efficiency Trends, page 99 - updated with 2017 GfK data
Table 12: Group 5T star/price comparison – Australia (2016-2017)
Star Rating 1.5 2.0 2.5 3.0 3.5 4.0 4.5 5.0
Number of Models 1 30 55 27 80 9 1 3
Average Volume (litres) 158.6 244.5 305.3 419.5 416.0 419.5 620.9 494.8
Average Price (2013$) $404 $453 $550 $743 $903 $887 $1,291 $1,507
Energy 370.7 406.2 392.7 414.9 354.0 322.6 329.3 269.9
$/litre $2.55 $1.85 $1.80 $1.77 $2.17 $2.11 $2.08 $3.05
Source: Energy Efficient Strategies (2016) Whitegoods Efficiency Trends, page 98- updated with 2017 GfK data
There are similar observations for certain groups of freezers as shown in Table 13 and Table 14 with 3.0 star and
3.5 star group 6C freezers sold cheaper than 2.0 star freezers and 3.0 and 3.5 star group 6U freezers sold cheaper
than 1.5 or 2.5 star freezers, on a price per litre basis.
Decision RIS – Household refrigerators and freezers 18You can also read