Decline in Mobility: Public Transport in Poland in the time of the COVID-19 Pandemic - MDPI
←
→
Page content transcription
If your browser does not render page correctly, please read the page content below
economies
Article
Decline in Mobility: Public Transport in Poland in
the time of the COVID-19 Pandemic
Michał Wielechowski 1 , Katarzyna Czech 2, *          and Łukasz Grz˛eda 1
 1   Department of Economics and Economic Policy, Institute of Economics and Finance, Warsaw University of
     Life Sciences-SGGW, Nowoursynowska 166, 02-787 Warsaw, Poland;
     michal_wielechowski@sggw.edu.pl (M.W.); lukasz_grzeda@sggw.edu.pl (Ł.G.)
 2   Department of Econometrics and Statistics, Institute of Economics and Finance, Warsaw University of Life
     Sciences-SGGW, Nowoursynowska 166, 02-787 Warsaw, Poland
 *   Correspondence: katarzyna_czech@sggw.edu.pl

 Received: 13 August 2020; Accepted: 25 September 2020; Published: 29 September 2020

 Abstract: The aim of the paper is to assess changes in mobility in public transport in Poland, as a
 consequence of the development of the COVID-19 pandemic. We analyse the problem from the country
 and regional (voivodeships) perspective. The data come from Google COVID19 Community Mobility
 Reports, the Ministry of Health of Poland, and the Oxford COVID-19 Government Response Tracker.
 The research covers the period between 2 March and 19 July 2020. The obtained results show that
 there is negative but insignificant relationship between human mobility changes in public transport
 and the number of new confirmed COVID-19 cases in Poland. The strength and statistical significance
 of the correlation varies substantially across voivodeships. As far as the relationship between changes
 in mobility in public transport and the stringency of Polish government’s anti-COVID-19 policy
 is concerned, the results confirm a strong, negative and significant correlation between analysed
 variables at the national and regional level. Moreover, based on one factor variance analysis (ANOVA)
 and the Tukey’s honest significance test (Tukey’s HSD test) we indicate that there are significant
 differences observed regarding the changes in mobility in public transport depending on the level
 of stringency of anti-COVID-19 regulation policy both in Poland and all voivodeships. The results
 might indicate that the forced lockdown to contain the development of the COVID-19 pandemic
 has effectively contributed to social distancing in public transport in Poland and that government
 restrictions, rather than a local epidemic status, induce a greater decrease in mobility.

 Keywords: COVID-19; coronavirus; pandemic; human mobility; public transport; government policy

 JEL Classification: I18; O18; R40; L90

1. Introduction
     COVID-19 is an infectious disease caused by the severe acute respiratory syndrome coronavirus
2 (SARS-CoV-2), a seventh coronavirus that can spread between humans (Andersen et al. 2020).
The World Health Organization (WHO) classified the COVID-19 epidemic as a global pandemic on
11 March 2020 (Maier and Brockmann 2020). The novel coronavirus pandemic has hit the global
economy and societies on an unprecedented scale since the Great Depression (1929–1933), and is
epidemically compared to the Spanish flu of the 1918 (Barro et al. 2020; Laing 2020). The scientists refer
to the COVID-19 pandemic as the giant black swan phenomenon (Goodell 2020; Mazzoleni et al. 2020;
Wind et al. 2020).
     The spread of COVID-19 has resulted in a reduction in economic activity and led to significant
threats to the financial stability of many countries in the world (Boot et al. 2020). The COVID-19

Economies 2020, 8, 78; doi:10.3390/economies8040078                           www.mdpi.com/journal/economies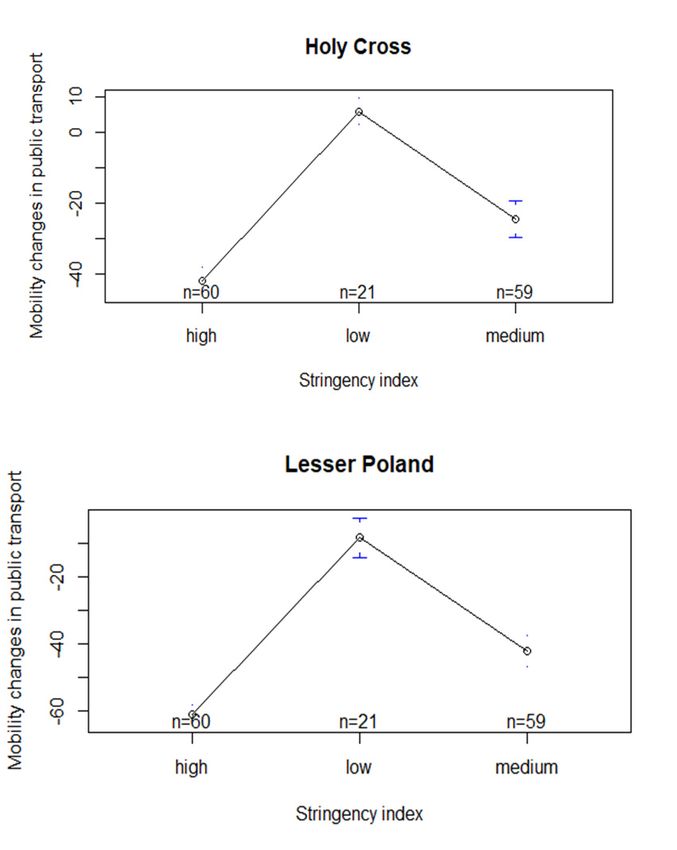
Economies 2020, 8, 78                                                                                2 of 24

crisis has shown both policymakers and the general public that natural disasters can create huge,
global, direct, and adverse economic impacts (Goodell 2020). Nicola et al. (2020) show the strong,
negative consequences of the pandemic in all sectors of the economy including primary, secondary
and service sectors. The coronavirus pandemic has proven to be a formidable challenge for many
European Union countries, including Poland (Czech et al. 2020; Goniewicz et al. 2020). According to
Cochrane (2020), there is a strong need to create and implement a retail economy rescue plan that
would prevent bankruptcies and insolvencies where possible.
      The challenge facing the government is to choose an effective economic policy that meets the
condition of social sensitivity. Jones et al. (2020) emphasize that governments’ responses to the
COVID-19 pandemic show a search for a balance between health and economic goals. According to
Eichenbaum et al. (2020) the implementation of a restrictive policy preventing the spread of the
coronavirus pandemic increases the depth of the recession and fiscal instability, but enables the
achievement of an extremely important and fundamental goal, i.e., saving human lives. On the other
hand, some researchers do not agree with the opinion that such strict restrictions and limitations
should be introduced (Jelnov 2020).
      The spread of the COVID-19 pandemic has caused the implementation of unprecedented measures
restricting travel, movement and activity participation in many countries across the world (De Vos 2020).
A variety of stringency policies, including stay-at-home policy, school, public institutions and workplace
closures, cancellation of mass events and public gatherings, and restrictions on public transport have
affected approximately 90% of the world’s population, contributing to a general reduction in mobility
on an unprecedented scale (Gössling et al. 2020). Tian et al. (2020) indicate that suspending public
transport, closing entertainment venues, and ban on public gatherings are associated with reductions
in case incidence. Jinjarak et al. (2020) show that countries with more stringent government policies
have reported lower COVID-19 mortality growth rates. In their view, the relationship between the
stringency of government policy and the mortality growth is negative and more pronounced in
countries with older population, higher rates of urbanization, greater democratic freedom, and larger
international travel flows. Yuksel et al. (2020) show that anti-COVID-19 policy adherence is not
stable and fluctuates depending on the amount of information on COVID-19 that is available in a
particular region and the level of risk aversion. In their opinion, the degree of social distancing depends
on the government policy, particularly the social campaign affecting perception of the coronavirus
pandemic by people in different regions. Bonaccorsi et al. (2020), Pepe et al. (2020), Pullano et al. (2020)
and Queiroz et al. (2020) indicate significant relationship between human mobility and government
restriction tightening to tackle the COVID-19 pandemic.
      Warren and Skillman (2020) find that the COVID-19 pandemic has resulted in large reduction in
mobility both in the US and globally. They indicate that half of the individuals in the entire state of New
York spent most of their day within less than 100 feet from their initial position. Glaeser et al. (2020)
show a visible decrease in urban mobility in USA accompanied by substantial heterogeneity both across
space and time. Badr et al. (2020) reveal the mobility patterns are strongly correlated with decreased
COVID-19 case growth rates for the most affected counties in the USA. Coven and Gupta (2020)
and Almagro and Orane-Hutchinson (2020) find disparities in mobility responses to the COVID-19
pandemic rooted in income. Oztig and Askin (2020) show that countries with higher population
density are found to be more likely to have more COVID-19 cases than other countries. Moreover,
it should be emphasized that the strength of analysed relations also depends on the mobility reduction,
which differs across nations and regions due to their initial mobility structure (Galeazzi et al. 2020).
      Schlosser et al. (2020) find that in the aftermath of COVID-19 pandemic long-distance travel has
been strongly reduced, having an effect on epidemic spreading processes by “flattening” the epidemic
curve and delaying the spread to geographically distant regions. Cartenì et al. (2020) show that
mobility habits are correlated with the number of COVID-19 infections. Similarly, Yilmazkuday (2020),
based on daily Google mobility data covering 130 countries, claims that government stay-at-home
policy is effective showing that lower mobility is associated with lower COVID-19 cases and deaths.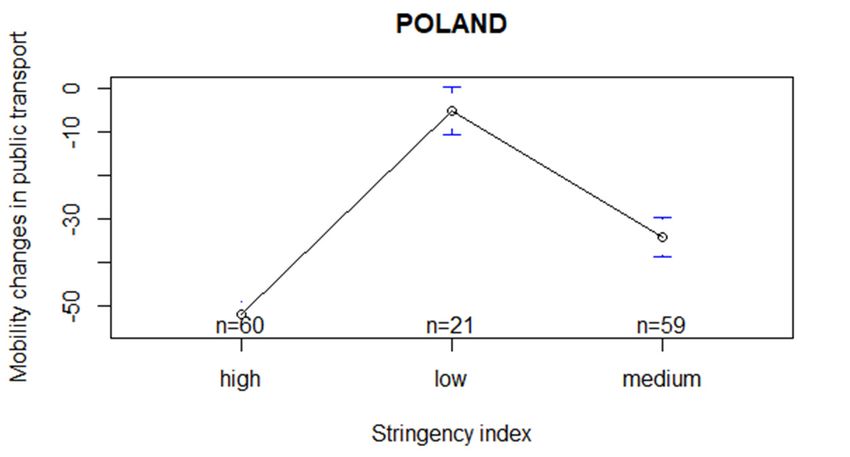
Economies 2020, 8, 78                                                                                 3 of 24

However, Askitas et al. (2020), investigating mobility pattern across 135 countries, find that restrictions
on internal movement, public transport closures and international travel controls do not lead to a
significant decrease in new COVID-19 infections.
      The article addresses the impact of the COVID-19 pandemic on the population-related mobility
in public transport. The number and nature of interpersonal contacts between infected and healthy
individuals affect the transmission of infectious diseases. Confined and crowded environments,
including transport hubs, that are visited by people daily can become hot-spots for spreading infectious
diseases (Goscé and Johansson 2018; Browne et al. 2016; Morawska et al. 2020). Public transportation
vehicles, particularly buses, trams, trains and metros, which are used daily by millions of people,
might contribute to the spread of infectious diseases among their users (Musselwhite et al. 2020;
Troko et al. 2011). However, only a paucity of evidence describes SARS and MERS coronaviruses
transmission events linked to transportation systems or hubs (Browne et al. 2016). Nevertheless,
it is proved that social distancing measures are important in order to contain an emerging disease
(Eubank et al. 2004). Wang (2014) based on daily data from Taipei City in Taiwan found a 50% decrease
in underground ridership during the peak of the 2003 SARS pandemic. Lau (2003), based on Hong Kong,
showed that the proportion of people avoiding congested places, including public transport hubs, s
increased significantly only in the initial phase of the SARS epidemic. The control measures based on
limiting or constraining human mobility are being considered as important in containing the spread of
infectious diseases (Bajardi et al. 2011). The impact of travel restrictions due to an epidemic remained
difficult to measure in the past due to mobile phone data limitations. Peak et al. (2018), based on
routinely collected mobile phone data during the Ebola epidemic in Sierra Leone revealed a dramatic
reduction in human mobility only during a 3-day lockdown, while mobility quickly returned to normal
patterns after the restrictions were lifted.
      There are two main approaches to studying the issue of public transport from the perspective of
the COVID-19 pandemic. On the one hand, scientists investigate the impact of the transport sector on
the spread of COVID-19. Jinjarak et al. (2020) find that higher initial mobility negatively impacts the
epidemic status, particularly the mortality rate. Majority of studies investigate how the transport sector
and the changes in transport mobility affect the COVID-19 pandemic spread in China, the country
were the novel coronavirus appeared (Chinazzi et al. 2020; Kraemer et al. 2020). Zheng et al. (2020)
indicate that COVID-19 cases imported via transportation are a key factor in the pandemic spread.
Linka et al. (2020) suggest that an unconstrained mobility would have significantly accelerated the
spread of the COVID-19 pandemic, particularly in Central Europe, Spain and France. According to
Muller et al. (2020) and Musselwhite et al. (2020) public transport plays a significant role in the
spread of infectious diseases, thus attempts to control the spread of infections via public transportation
reduces the infection speed. On the other hand, researchers examine how the COVID-19 pandemic,
the accompanying combination of government restrictions and social fears of contracting and spreading
COVID-19 when using mass transport modes reduce passenger transport demand and worsen the
overall situation in transport. Aloi et al. (2020) investigate the effects of the pandemic lockdown on
urban mobility. They show that an overall mobility in the northern city of Santander, Spain have fallen
by 76% and the number of public transport users have dropped by up to 93%.
      The medical researchers forecast that subsequent waves of the pandemic may result in new waves
of social distancing in the near future (Wu et al. 2020). De Vos (2020) claims that social distancing
which reduces direct physical interactions between individuals in order to stop the spread of the virus,
has become the new norm in the society. The economic and social effects of the COVID-19 pandemic on
public transport does not concern only service performance, financial viability, health risks, social equity,
and sustainable mobility but goes much further (Tirachini and Cats 2020).
      Our contribution is that by applying Pearson’s and Spearman’s rank correlation coefficients,
factor variance analysis (ANOVA) and the Tukey’s honest significance test (Tukey’s HSD test) we can
investigate the COVID-19 pandemic-driven changes in mobility in public transport in Poland from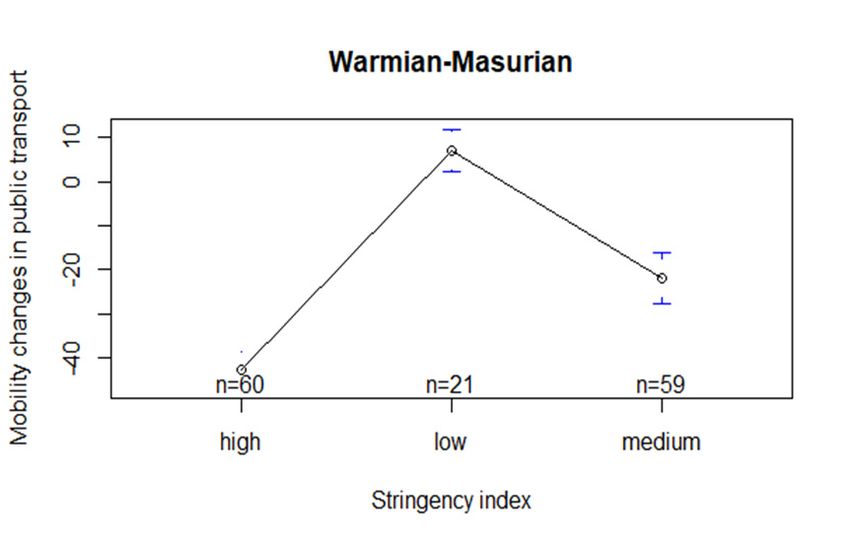
Economies 2020, 8, 78                                                                                          4 of 24

Economies 2019, 7, x FOR PEER REVIEW                                                                           4 of 24

the country and regional (voivodeships) perspective. To our knowledge, there have been no similar
from the country and regional (voivodeships) perspective. To our knowledge, there have been no
studies conducted yet.
similar studies conducted yet.
     The outline of the paper is as follows: the next section presents the aim of the study,
     The outline of the paper is as follows: the next section presents the aim of the study, research
research hypotheses and a description of the material and research methods used. The subsequent
hypotheses and a description of the material and research methods used. The subsequent section sets
section sets out the empirical findings and discussion, with the final section offering our conclusions.
out the empirical findings and discussion, with the final section offering our conclusions.
2. Methodology
2. Methodology
     The aim of the paper is to assess the changes in mobility in public transport in Poland as a
     The
consequenceaim of
                of the
                    the development
                        paper is to assess
                                         of thethe changes in
                                                 COVID-19         mobility The
                                                               pandemic.     in public   transport
                                                                                   expected         in Poland
                                                                                              key factors         as a
                                                                                                            affecting
consequence    of the in
changes in mobility     development      of the
                           public transport      COVID-19
                                              during           pandemic.
                                                      the COVID-19          The expected
                                                                       pandemic               key factors
                                                                                    are the epidemic        affecting
                                                                                                       status   in the
changes   in mobility   in  public transport    during   the COVID-19     pandemic     are  the epidemic
country and the stringency of government restriction policy to tackle the coronavirus. It is in line        status  in
                                                                                                                 with
the country
Warren  and and    the stringency
              Skillman   (2020) who of indicate
                                        government
                                                 that arestriction policyintomobility
                                                         large decrease        tackle the
                                                                                        oncoronavirus.   It has
                                                                                            a global scale  is inbeen
                                                                                                                  line
with
associated with the outbreak of the COVID-19 threat and specific government directives. In orderhas
     Warren    and   Skillman   (2020)  who  indicate   that a large decrease    in mobility  on a global  scale    to
been  associated
achieve  the mainwith     thethe
                     aim of    outbreak
                                 study, weof build
                                             the COVID-19       threat
                                                   three research      and specific government directives. In
                                                                     hypotheses.
order to achieve the main aim of the study, we build three research hypotheses.
Hypothesis 1. The relationship between the changes in mobility in public transport and new laboratory-confirmed
Hypothesis   1. Theinrelationship
cases of COVID-19                 betweenand
                      Poland is negative  thesignificant.
                                              changes in mobility in public transport and new laboratory-
confirmed cases of COVID-19 in Poland is negative and significant.
Hypothesis 2. The relationship between the changes in mobility in public transport and the stringency of Polish
Hypothesis
government’s 2. The relationship
             anti-COVID-19       between
                              policy       the changes
                                     is negative        in mobility in public transport and the stringency of
                                                 and significant.
Polish government’s anti-COVID-19 policy is negative and significant.
Hypothesis 3. There is significant difference in changes in mobility in public transport regarding “low”,
“medium” and3.“high”
Hypothesis     There stringency
                      is significant difference
                                 of Polish      in changes
                                           government’s    in mobility inpolicy.
                                                        anti-COVID-19     public transport regarding “low”,
“medium” and “high” stringency of Polish government’s anti-COVID-19 policy.
     Due to the diverse epidemic status and expected different mobility behaviour in particular
     Due to
provinces  of the diverse
               Poland,  weepidemic
                            verify thestatus and expected
                                        hypotheses         different
                                                    from the  countrymobility
                                                                      as well behaviour   in particular
                                                                               as all 16 voivodeships
provinces ofperspective,
(provinces)    Poland, we i.e.,
                            verify  the hypotheses
                                 Greater           from
                                          Poland, Holy   the country
                                                       Cross,         as well as all 16Lesser
                                                               Kuyavian-Pomeranian,      voivodeships
                                                                                               Poland,
(provinces)  perspective,  i.e., Greater  Poland, Holy Cross,  Kuyavian-Pomeranian,    Lesser
Lower Silesian, Lublin, Lubusz, Łódź, Masovian, Opole, Podlaskie, Pomeranian, Silesian,       Poland,
Lower   Silesian,Warmian-Masurian,
Subcarpathian,     Lublin, Lubusz, Łódź,       Masovian,
                                         and West         Opole,Figure
                                                  Pomeranian.      Podlaskie,  Pomeranian,
                                                                       1 presents             Silesian,
                                                                                   the administrative
Subcarpathian,
division of PolandWarmian-Masurian,
                    into voivodeships. and West Pomeranian. Figure 1 presents the administrative
division of Poland into voivodeships.

      Figure 1. The administrative division of Poland into voivodeships. DS—Lower Silesian; KP—
      Figure 1. The administrative division of Poland into voivodeships. DS—Lower Silesian; KP—
      Kuyavian-Pomeranian; LU—Lublin; LB—Lubusz; LD—Łódź; MA—Lesser Poland; MZ—Masovian;
      Kuyavian-Pomeranian; LU—Lublin; LB—Lubusz; LD—Łódź; MA—Lesser Poland; MZ—Masovian;
      OP—Opole; PK—Subcarpathian; PD—Podlaskie; PM—Pomeranian; SL—Silesian; SK—Holy Cross;
      OP—Opole; PK—Subcarpathian; PD—Podlaskie; PM—Pomeranian; SL—Silesian; SK—Holy Cross;
      WN—Warmian-Masurian; WP—Greater Poland; ZP—West Pomeranian. Source: own elaboration.
      WN—Warmian-Masurian; WP—Greater Poland; ZP—West Pomeranian. Source: own elaboration.

   To determine the changes in mobility in public transport we use Google data from COVID-19
Community Mobility Reports on transit stations category developed by Google. Google has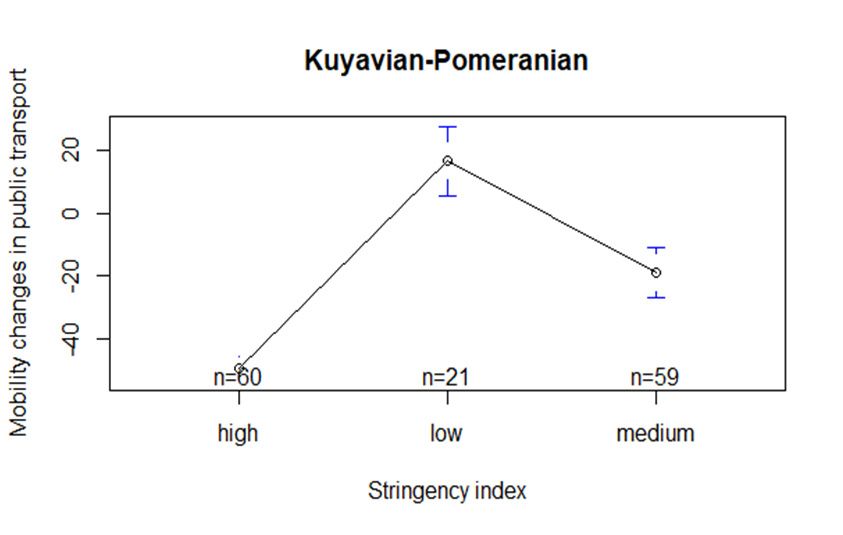
Economies 2020, 8, 78                                                                                5 of 24

       To determine the changes in mobility in public transport we use Google data from COVID-19
Community Mobility Reports on transit stations category developed by Google. Google has developed
the reports in order to assess how peoples’ movements have changed throughout the pandemic.
The reports visualize changes in the number of visits and time spent in certain place categories, such as
such retail and recreation, supermarkets and pharmacies, parks, public transport, workplaces and
residential, in relation to the baseline period prior to the outbreak of the pandemic. Due to different
routines on weekdays and weekends, baseline periods represent a normal value for each day of
the week, given as median value over the five-week period from 3rd January to 6th February 2020
(Google 2020; Ritchie 2020). Google highlights the usage of anonymized data provided by applications
such as Google Maps. COVID-19 Community Mobility Reports identify six categories of public mobility
places (Google 2020): retail and recreation (restaurants, cafes, shopping centres, theme parks, museums,
libraries, and movie theatres), grocery and pharmacy (grocery markets, food warehouses, farmers
markets, specialty food shops, drug stores, and pharmacies), parks (national parks, public beaches,
marinas, dog parks, plazas, and public gardens), transit stations (public transport hubs, including
subway, bus and train stations), workplaces, and residential (places of residence). The data on daily
new laboratory-confirmed cases of COVID-19 in Poland and 16 voivodeships was collected from the
official Twitter account of the Ministry of Health of the Republic of Poland. To measure the stringency
of the government response to the outbreak of the COVID-19 pandemic we use data on the Stringency
index from the Oxford COVID-19 Government Response Tracker developed by the Blavatnik School
of Government (Hale et al. 2020). The index provides a systematic measure of tracking the severity
level of government responses to the COVID-19 pandemic in time across more than 150 countries.
The Stringency index consists of eight individual government response measures, including: school
closing, workplace closing, public events cancellations, restrictions on gathering size, public transport
closing, stay-at-home requirements, restrictions on internal movements, restrictions on international
travel and public information campaign. The index ranges from 0 to 100 (Hale et al. 2020).
       The research covers the period between 2 March and 19 July 2020, i.e., the time since the first
laboratory-confirmed COVID-19 case in Poland up to the latest available data (as of 24 July 2020).
In order to avoid mismatching different people’s mobility routines on weekdays and weekends we
convert daily data into weekly averages. In we apply Pearson’s and Spearman’s rank correlation
coefficients and corresponding significance tests to measure the relationship between: changes in
mobility in public transport and new laboratory-confirmed cases of COVID-19, and mobility changes in
public transport and the Stringency index level changes. Measuring correlation between two or more
variables requires knowledge of their joint distribution. As the joint distribution is normal, the Pearson’s
correlation coefficient is applied. Otherwise, the relationship between variables is calculated based
on Spearman’s rank correlation coefficient. The joint distribution of analysed variables’ normality is
determined with Shapiro Wilk test. The Shapiro-Wilk test is the most powerful normality test that
can be also applied for small sample size and for all levels of skewness and kurtosis of distributions
(Yap and Sim 2011).
       Additionally, we supply our study with one factor variance analysis (ANOVA) and the Tukey’s
honest significance test (Tukey’s HSD test) to check whether the stringency of Polish government’s
anti-COVID-19 policy has significant impact on changes in mobility in public transport both from
country and regional perspective. The Stringency index is assumed to be the factor. Based on the
stringency index daily data we build qualitative variable which has three levels. The first level-“low”,
represents low level of Polish government stringency policy, i.e., the stringency index lower than
40. The “medium” level is assigned to all days when the stringency index is in the range between
41 and 70. The “high” level is attributed to all daily periods with severe anti-COVID regulations,
i.e., the stringency index higher than 71.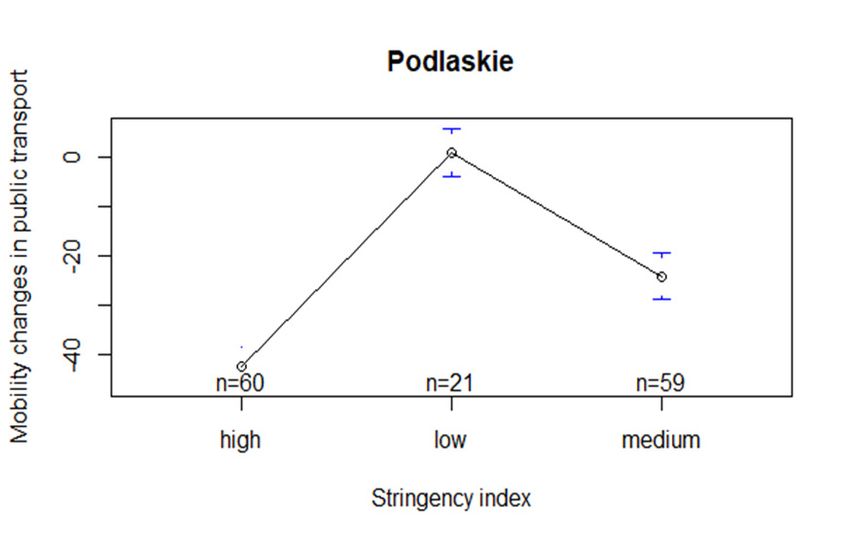
Economies 2020, 8, 78                                                                                                           6 of 24

3. Research Results and Discussion
     The rapid increase in laboratory-confirmed COVID-19 cases across the world result in growing
international concerns. In line with WHO recommendations, the Polish government began
implementing restrictions and limitations aimed at limiting the spread of COVID-19. Table 1 presents
an order of events related to the spread of the COVID-19 epidemic in the world and in Poland, as well
as Polish government anti-COVID-19 restrictions related directly or indirectly to transportation.

      Table 1. The coronavirus pandemic development and the Polish government anti-COVID-19 policy
      regulations related to transportation—timeline.

  Description                                                                                                   Date
  Global perspective
  Unpublished Chinese government report on first cases of a novel coronavirus infections.                       17 November 2019
  The first confirmed case of a novel coronavirus infection in Wuhan, China.                                    8 December 2019
  The first confirmed cases of a novel coronavirus infection in Europe, Italy.                                  23 January 2020
  WHO declares the novel coronavirus outbreak a Public Health Emergency of International Concern.               30 January 2020
  The International Committee on Taxonomy of Viruses (ICTV) names a novel coronavirus: SARS-CoV-2.
                                                                                                                11 February 2020
  WHO announces an official name for the disease caused by the coronavirus: COVID-19.
  WHO announces that COVID-19 can be officially described as a pandemic.                                        11 March 2020
  Poland
  The first laboratory-confirmed case of COVID-19, Lubusz voivodeship.                                          4 March 2020
  Border controls and ban on mass events.                                                                       10 March 2020
  The first reported COVID-19 death, Greater Poland.                                                            12 March 2020
  school closing, restrictions on internal movement                                                             12 March 2020
  The government announces an epidemic threat on the territory of Poland                                        14 March 2020
  Restriction on functioning of selected institutions and workplaces, remote working obligation                 14 March 2020
  Suspension of international passenger air and rail connections, restrictions on cross-border movements        15 March 2020
  The government announces epidemic in Poland.                                                                  20 March 2020
  Restrictions on movement except commuting to work, essential matters of everyday life and
                                                                                                                24 March 2020
  volunteering in the fight against COVID-19.
  Maximal number of passengers on public transport (buses, trams, metro) equal half the number of seats.        24 March 2020
  Restrictions on gathering, stay-at-home policy implementation                                                 31 March 2020
  Mandatory nose and mouth covering in public places                                                            16 April 2020
  The first stage of lifting restrictions related to COVID-19 (possibility of movement for recreational
                                                                                                                20 April 2020
  purposes, easing restrictions in trade and services).
  The second stage of lifting restrictions related to COVID-19 (opening of shopping centres, hypermarkets
                                                                                                                4 May 2020
  and hotels).
  The third stage of lifting restrictions related to COVID-19 (partial abolition of public transport
                                                                                                                18 May 2020
  restrictions to increase the number of passengers to 30% of all seats and standing places).
  The fourth stage (first part) of lifting restrictions related to COVID-19 (lifting the limits of people in
                                                                                                                30 May 2020
  shops, post offices, restaurants, and places of religious worship).
  Partial abolition of public transport restrictions to increase the number of passengers to 100% of seats or
                                                                                                                1 June 2020
  50% of all seats and standing places, resumption of internal passenger flights.
  The fourth stage (second part) of lifting restrictions related to COVID-19 (full opening of hotels,
                                                                                                                6 June 2020
  swimming pools, fitness clubs, and places of culture, enabling gatherings up to 150 persons).
  Lifting restrictions on traffic at borders                                                                    13 June 2020
  Resumption of international passenger flights.                                                                16 June 2020
      Source: own elaboration based on data of the Chancellery of the Prime Minister of Poland (2020) and the Service of
      the Republic of Poland (2020).

    Compared to other European Union (EU) Member States, Poland is one of the last countries to
experience the outbreak of the COVID-19. By 19 July 2020 more than one per mile of Poles have
experienced the coronavirus. At the same time the number of deaths related to COVID-19 has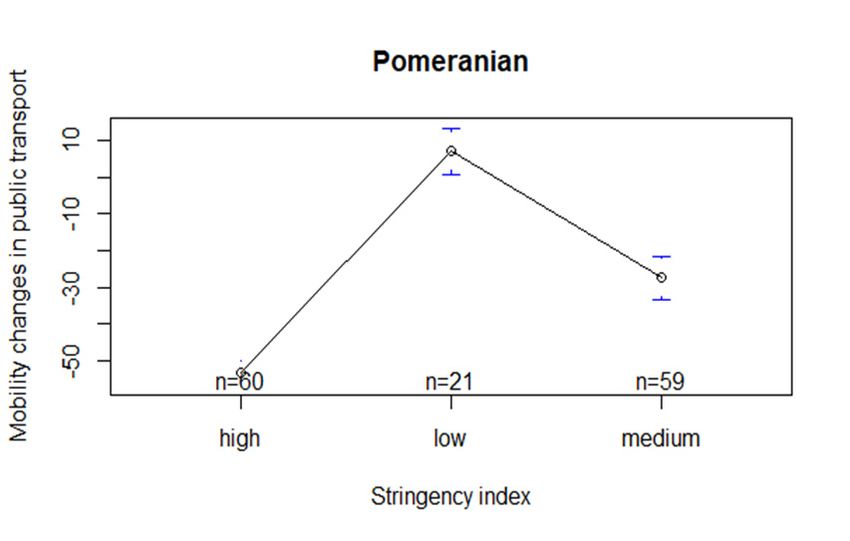
Economies
Economies2019,
2020,7,
8,x78FOR PEER REVIEW 77of
of24
24
Economies 2019, 7, x FOR PEER REVIEW 7 of 24
experienced the coronavirus. At the same time the number of deaths related to COVID-19 has reached
experienced
reached 1623,the coronavirus.
resulting Atcoronavirus
the same time the number of deaths relatedintoPoland
COVID-19 has reached
1623, resulting in a 4% in a 4%
coronavirus mortality
mortality rate. Epidemic
rate. Epidemic statusstatus
in Poland is diverse
is diverse across
across 16
1623,
16 resulting
voivodeships, in a
as 4% coronavirus
Figure 2 depicts. mortality rate. Epidemic status in Poland is diverse across 16
voivodeships, as Figure 2 depicts.
voivodeships, as Figure 2 depicts.
Figure
Figure 2.
2. Laboratory-confirmed
Laboratory-confirmedCOVID-19
COVID-19cases
casesininPoland
Polandby
byvoivodeship,
voivodeship,by
by19
19July
July2020.
2020.Source:
Source:
Figure 2. Laboratory-confirmed COVID-19 cases in Poland by voivodeship, by 19 July 2020. Source:
own
ownelaboration
elaborationbased
basedononMinistry
Ministryofof
Health of of
Health thethe
Republic of Poland
Ministry data
of Health of(2020).
the Republic of Poland
own elaboration based on Ministry of Health of the Republic of Poland data (2020).
data (2020).
The COVID-19 crisis has hit all forms of transport, including both public and private sectors,
The COVID-19 crisis
The COVID-19 crisis has hit
hit all
has Globalall forms
forms of transport, including
of transport, including both
both public
public and private
private sectors,
anddecreased sectors,
nationally and internationally. road transport, by the end of March 2020, has more
nationally
nationally and
and internationally.
internationally. Global
Global road
road transport,
transport, by
by the
the end
end of
of March
March 2020,
2020, has
has decreased
decreased more
more
than 50% compared to the same period in 2019. The flight activity was almost 75% lower by mid-
than 50%
than 50% compared
compared to
to the the same
same period
period in 2019.
in 2019. The flight
The flight activity was almost 75% lower by mid-
April 2020, compared to the same period in 2019 (IEA activity
2020). Awas almost 75%of
combination lower
the by mid-April
government
April 2020,
2020, compared compared to the same period in 2019 (IEA 2020). A combination of the government
restrictions and to the same
social fears period in 2019 (IEA
of contracting and 2020). A combination
spreading COVID-19ofwhen the government
using massrestrictions
transport
restrictions
and social andofsocial
fears fears of
contracting andcontracting
spreading and spreading
COVID-19 when COVID-19
using mass when
transport using masshas
modes transport
caused
modes has caused the reduction in passenger transport demand. Figure 3 presents the monthly
modes has
the reduction caused the
in passenger reduction
transport in passenger
demand. transport
Figure demand.
3 presents the Figure
monthly 3 presents the monthly
numbers of passengers carried by public transport in Poland from January to numbers
June 2020.ofWe passengers
observe
numbers
carried byofpublic
passengers
transport carried
in by public
Poland from transport
January in June
to Poland from
2020. We January
observe toa June 2020. We
substantial observe
decrease in
a substantial decrease in passenger transport in Poland since the COVID-19 pandemic outbreak in
a substantial
passenger decrease
transport in in passenger
Poland since transport
the COVID-19 in Poland sinceoutbreak
pandemic the COVID-19in March pandemic
2020. Byoutbreak
the end in
of
March 2020. By the end of April the total number of passenger in public transport had dropped by
Marchthe
April 2020.
totalBy the end
number of April theintotal number of passenger in public
by 77%transport had dropped by
77% in comparison to of passenger
January public
2020. Due totransport had dropped
the government restrictions in comparison
implementation, to January
the air
77% in comparison
2020. Duetransport to
to the government January 2020. Due
restrictions to the government
implementation, restrictions
the air implementation, the air
passenger had become least used. As a consequence of passenger
subsequenttransport
stages ofhad become
restriction
passenger
least used. transport
As a2020, had
consequence become least used. As a consequence of subsequent stages of restriction
easing in June nearly 21ofmillion
subsequent stages of
passengers in restriction
Poland were easing in June
carried by 2020,
publicnearly 21 million
transport, 38.6
easing in June
passengers 2020, nearly
inthan
Poland 21 million
were(Figure
carried passengers
by public in Poland
transport, were carried
38.6 percent more than by in public
May transport,
(Figure 3). 38.6
percent more in May 3).
percent more than in May (Figure 3).
thousands
50000
thousands
50000
40000
40000
30000
inin
30000
Passengers
20000
Passengers
20000
10000
10000
0
0
Total Railway Road Air
Total Railway Road Air
January February March April May June
January February March April May June
Figure 3. Passenger transport in Poland from January to June 2020 by means of transport, in 1000 persons.
Figure
Source:3.own
Passenger transport
elaboration basedinonPoland
Statistafrom January to June 2020 by means of transport, in 1000
(2020).
Figure 3. Passenger transport in Poland from January to June 2020 by means of transport, in 1000
persons. Source: own elaboration based on Statista (2020).
persons. Source: own elaboration based on Statista (2020).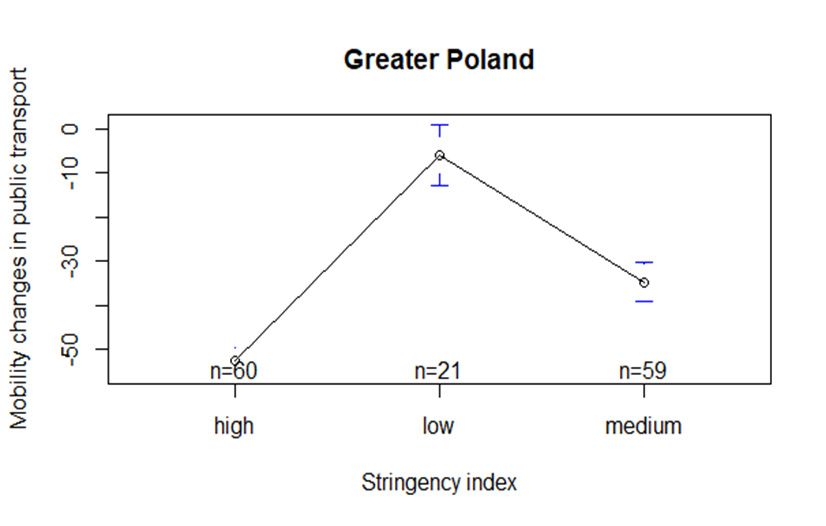
Economies 2020, 8, 78                                                                                                             8 of 24
Economies 2019, 7, x FOR PEER REVIEW                                                                                              8 of 24

      The mobility
      The  mobility isis likely
                          likely to
                                 to be
                                    be affected
                                        affected by
                                                  by the
                                                     the epidemic
                                                          epidemic status
                                                                    status in
                                                                           in the
                                                                              the country
                                                                                  country and
                                                                                            and the
                                                                                                the stringency
                                                                                                     stringency of
                                                                                                                 of
government     restriction   policy to tackle  the coronavirus.  Figure 4 depicts the  average weekly
government restriction policy to tackle the coronavirus. Figure 4 depicts the average weekly changes     changes in
mobility
in        in public
   mobility          transport
              in public           and the
                            transport   andnumber   of average
                                              the number        weekly COVID-19
                                                            of average              new cases.new
                                                                        weekly COVID-19        Google    COVID-19
                                                                                                    cases. Google
Community      Mobility    data  shows   that  peoples’ movements    have changed    dramatically
COVID-19 Community Mobility data shows that peoples’ movements have changed dramatically           throughout  the
throughout the pandemic. According to Troko et al. (2011) every means of transport can be treatedit
pandemic.    According      to Troko  et al. (2011) every  means  of transport  can be treated as a place  where
has
as   become
   a place    difficult
           where   it hastobecome
                             avoid interpersonal    contact.
                                     difficult to avoid      Therefore,contact.
                                                         interpersonal  people should    avoid
                                                                                 Therefore,    public
                                                                                             people    transport
                                                                                                     should      in
                                                                                                             avoid
order  not to  be infected.
public transport in order not to be infected.

                            20                                                                                     500

                                                                                                                         New COVID-19 cases
                            10
     Mobility changes in
     percentage points

                             0                                                                                     400
                           -10
                                                                                                                   300
                           -20
                           -30
                                                                                                                   200
                           -40
                           -50                                                                                     100
                           -60
                           -70                                                                                      0
                                 2/03   16/03   30/03   13/04   27/04   11/05   25/05    8/06   22/06   6/07   20/07
                             Mobility changes in public transport (LHS)                 COVID-19 confirmed cases (RHS)

     Figure 4. Mobility changes in public transport and new laboratory-confirmed cases of COVID-19 in
     Figure 4. Mobility changes in public transport and new laboratory-confirmed cases of COVID-19 in
     Poland from 2 March to 19 July 2020. Source: own elaboration based on data from Google COVID-19
     Poland from 2 March to 19 July 2020. Source: own elaboration based on data from Google COVID-19
     Community Mobility Reports (Google 2020) and Ministry of Health of the Ministry of Health of the
     Community Mobility Reports (Google 2020) and Ministry of Health of the Republic of Poland (2020).
     Republic of Poland (2020).

     Figure
      Figure 44 indicates
                indicates that
                           thatthe
                                theincrease
                                    increaseininthe
                                                 thenumber
                                                      numberofof new
                                                               new   COVID-19
                                                                    COVID-19     cases
                                                                              cases was was   associated
                                                                                          associated     with
                                                                                                      with  the
the sharp   decline  in  the  mobility  of people    in public transport, particularly  till mid-April
sharp decline in the mobility of people in public transport, particularly till mid-April 2020. However,  2020.
However,   since the beginning
since the beginning                of May,
                       of May, a large      a large
                                        increase  inincrease in humanwas
                                                      human mobility    mobility was despite
                                                                           observed,  observed, thedespite the
                                                                                                    constantly
constantly  high   number    of new   laboratory-confirmed    cases of COVID-19.   It may    suggest
high number of new laboratory-confirmed cases of COVID-19. It may suggest that the strength of
                                                                                                      that the
strength  of   the relationship   between    mobility   in public transport  and  the  epidemic    status
the relationship between mobility in public transport and the epidemic status has decreased with the
                                                                                                           has
decreased   with the development of the COVID-19 pandemic in Poland. Table 2 shows estimated
development of the COVID-19 pandemic in Poland. Table 2 shows estimated correlation coefficients
correlation coefficients between changes in mobility in public transport and the number of new
between changes in mobility in public transport and the number of new confirmed cases across the
confirmed cases across the country and in each of the 16 voivodeships. The normality of joint
country and in each of the 16 voivodeships. The normality of joint distribution of analysed variables is
distribution of analysed variables is tested with the Shapiro Wilk test. When estimated p-values are
tested with the Shapiro Wilk test. When estimated p-values are lower than 0.05 level of significance,
lower than 0.05 level of significance, the null hypothesis of normality is rejected. When the joint
the null hypothesis of normality is rejected. When the joint distribution is normal, the Pearson’s
distribution is normal, the Pearson’s correlation coefficient is applied. Otherwise, we use the
correlation coefficient is applied. Otherwise, we use the Spearman’s rank correlation coefficient.
Spearman’s rank correlation coefficient.
      The results presented in Table 2 indicate the existence of negative relationship between mobility
     The results presented in Table 2 indicate the existence of negative relationship between mobility
changes in public transport and new laboratory-confirmed cases of COVID-19, both in Poland
changes in public transport and new laboratory-confirmed cases of COVID-19, both in Poland and in
and in the vast majority of voivodeships. However, the results are significant, at 0.05 significance
the vast majority of voivodeships. However, the results are significant, at 0.05 significance level, only
level, only for Kuyavian-Pomeranian, Lower Silesian, Masovian, Pomeranian and West Pomeranian
for Kuyavian-Pomeranian, Lower Silesian, Masovian, Pomeranian and West Pomeranian
voivodeships, for which the research results are consistent with the first hypothesis presented in the
voivodeships, for which the research results are consistent with the first hypothesis presented in the
paper. The estimated Spearman’s rank correlation coefficient for Poland equals −0.29, while at the
paper. The estimated Spearman’s rank correlation coefficient for Poland equals −0.29, while at the
regional level the correlation coefficients varies substantially from 0.10 to −0.69. The strongest negative
regional level the correlation coefficients varies substantially from 0.10 to −0.69. The strongest
relationship is observed for Lower Silesian, Masovian and West Pomeranian. The obtained results
negative relationship is observed for Lower Silesian, Masovian and West Pomeranian. The obtained
indicate regional differences in the strength and significance of the relationship between changes in
results indicate regional differences in the strength and significance of the relationship between
mobility in public transport and new confirmed cases. Voivodeships that have a significant, strong and
changes in mobility in public transport and new confirmed cases. Voivodeships that have a
negative correlation are those in which increasing number of new COVID-19 cases coincide with
significant, strong and negative correlation are those in which increasing number of new COVID-19
stricter government restrictions, when human mobility in Poland decreased the most. What may
cases coincide with stricter government restrictions, when human mobility in Poland decreased the
be surprising the relationship is insignificant but positive for Silesian, the province most affected by
most. What may be surprising the relationship is insignificant but positive for Silesian, the province
the coronavirus pandemic. It may be due to the fact that in this voivodeship a large number of new
most affected by the coronavirus pandemic. It may be due to the fact that in this voivodeship a large
COVID-19 cases occurred at the time of easing the restrictions.
number of new COVID-19 cases occurred at the time of easing the restrictions.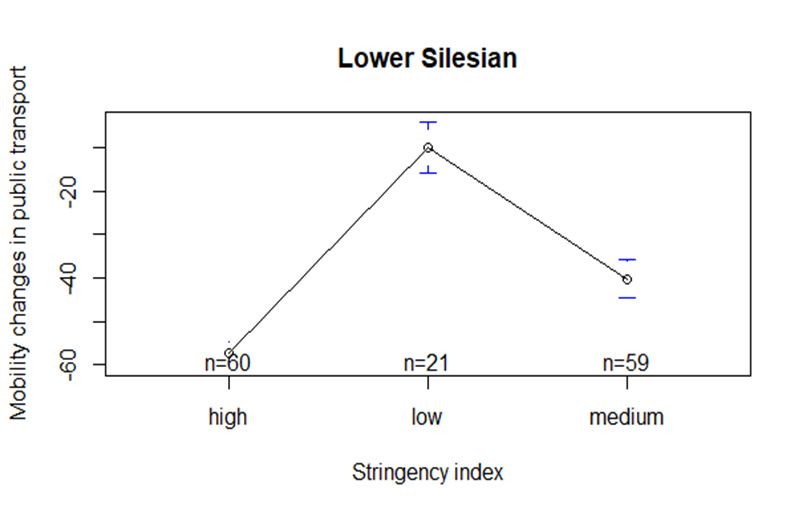
Economies 2020, 8, 78                                                                                                                           9 of 24

      Table 2. The relationship between mobility changes in public transport and new laboratory-confirmed
      cases of COVID-19 in Poland.

        Variable                              Shapiro-Wilk Test Statistic     p-Value     Correlation Coefficient                     p-Value
        POLAND                                           0.87                   0.01               −0.29 S                             0.21
     Greater Poland                                      0.97                   0.76              −0.36 P                              0.15
       Holy Cross                                        0.98                   0.91              −0.11 P                              0.64
     Economies 2019, 7, x FOR PEER REVIEW                                                                                             9 of 24
   Kuyavian-Pomeranian                                   0.75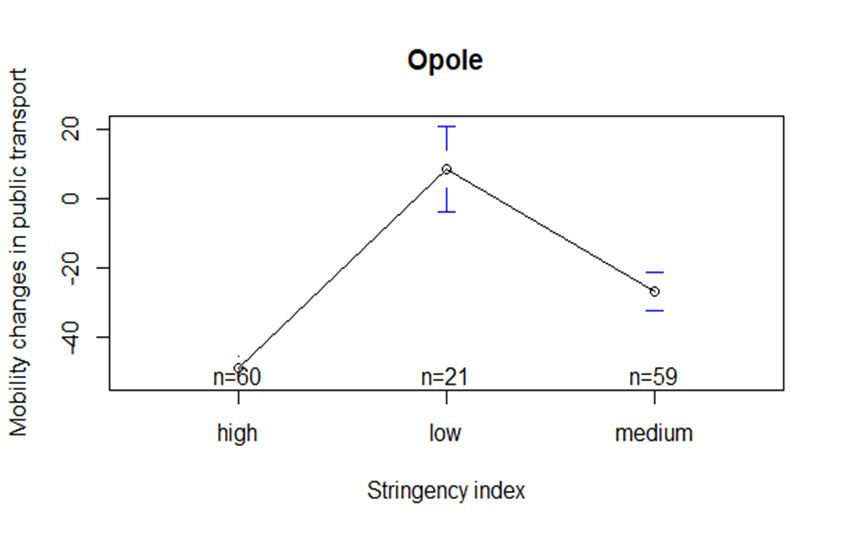
Economies 2020, 8, 78                                                                                               10 of 24

     Table 3 presents the results of Shapiro Wilk test and estimated correlation coefficients between
changes in mobility in public transport and stringency of government restriction policy to tackle the
coronavirus. The study reveals strong, negative and significant relationship both for Poland and all
16 voivodeships. It is consistent with the second hypothesis. It implies that the higher is the severity
level of government responses to the COVID-19 pandemic, the lower is the mobility in public transport.
The estimated Spearman’s rank correlation coefficient for Poland equals −0.84. Correlation coefficients
range from −0.72 to −0.86 across voivodeships.

      Table 3. The relationship between changes in mobility in public transport and the Stringency index
      level changes in Poland.

        Variable           Shapiro-Wilk Test Statistic          p-Value       Correlation Coefficient         p-Value
        POLAND                           0.89                     0.02                 −0.84   S
Economies 2020, 8, 78 11 of 24
Table 4. One factor analysis of variance (ANOVA) between the Stringency index levels and changes in
mobility in public transport.
Region F Statistics p-Value
POLAND 84.72anti-COVID-19 policy becomes more stringent, the mean level of population mobility in public
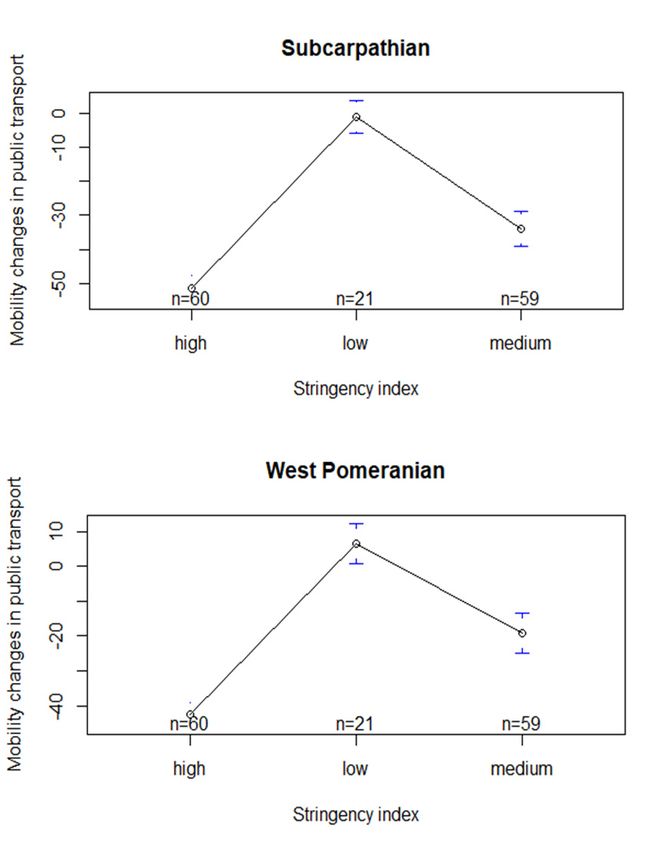
transport substantially declines. Figure A3a,b in the appendix show the mean mobility changes in
public transport in all 16 voivodeships at three stringency factor levels. Figure A3 indicates not only
the significant differences in mean changes in mobility in public transport at three levels of stringency
factor but also the difference in the magnitude of mobility changes among Polish voivodeships.
Figure
Economies 2020, 7 displaying changes in mobility in public transport dependent on the level of the stringency12 of 24
8, 78
of anti-COVID-19
Economies policy
2019, 7, x FOR PEER implies regionally differentiated people’s appearance in 12public
REVIEW of 24
transportation system and hubs.
Figure 6. The mean changes in mobility in public transport at three levels of the stringency of Polish
government’s anti-COVID-19 policy in Poland from 2 March to 19 July 2020. Source: own calculations
using R based on data from Google COVID-19 Community Mobility Reports (Google 2020) and the
Oxford COVID-19 Government Response Tracker (Hale et al. 2020).
Figure 7 shows that in the “low” level of stringency policy the largest regional diversity is
observed. Surprisingly, only half of the voivodeships experience a decline in average mobility in
public transport. Masovian (MZ) represents the highest drop in mobility (−15%) while in Kuyavian-
Pomeranian (KP) a reverse trend is visible (+16%). As far as “medium” and “high” stringency levels
are concerned, all sixteen voivodeships experience a substantial decrease in mobility in public
transport. However, the magnitude of changes in mobility varies across Polish regions. It is worth
adding that during the most severe anti-COVID-19 policy period, in as many as seven voivodeships,
the mobility decreased by more than half compared to the baseline period. Moreover, the highest
Figure 6. The
mobility mean changes
decrease, inthe
regardless mobility in public
stringency transport
level, is observedatinthree levels(MZ),
Masovian of the stringency
Lower Silesianof(DS)
Polish
government’s anti-COVID-19
and Lesser Poland policy
(MA), while in Poland from 2 March
Kuyavian-Pomeranian (KP),to 19 July
West 2020. Source:
Pomeranian ownWarmian-
(ZP) and calculations
Masurian
using R based(WN) arefrom
on data characterised by the lowest
Google COVID-19 Community declineMobility
in people’s appearance
Reports in public
(Google 2020) and the
transportation system and hubs.
Oxford COVID-19 Government Response Tracker (Hale et al. 2020).
15
-5
-25
-45
-65
PM
LB
SL
SK
PD
LD
KP
WN
ZP
WP
DS
PK
MZ
OP
LU
MA
medium low high
Figure 7. The mean changes in mobility in public transport at three levels of the stringency of Polish
Figure 7.anti-COVID-19
government’s The mean changespolicy
in mobility
in 16invoivodeships
public transportfrom
at three levels ofto
2 March the19
stringency of Polish
July 2020. DS—Lower
government’s anti-COVID-19 policy in 16 voivodeships from 2 March to 19 July 2020. DS—Lower
Silesian; KP—Kuyavian-Pomeranian; LU—Lublin; LB—Lubusz; LD—Łódź; MA—Lesser Poland;
Silesian; KP—Kuyavian-Pomeranian; LU—Lublin; LB—Lubusz; LD—Łódź; MA—Lesser Poland;
MZ—Masovian; OP—Opole; PK—Subcarpathian; PD—Podlaskie; PM—Pomeranian; SL—Silesian;
MZ—Masovian; OP—Opole; PK—Subcarpathian; PD—Podlaskie; PM—Pomeranian; SL—Silesian;
SK—Holy Cross; WN—Warmian-Masurian;
SK—Holy Cross; WN—Warmian-Masurian; WP—Greater
WP—GreaterPoland;
Poland; ZP—West Pomeranian.Source:
ZP—West Pomeranian. Source: own
calculations using R based
own calculations onRdata
using from
based on Google COVID-19
data from Community
Google COVID-19 MobilityMobility
Community ReportsReports
(Google 2020)
and the(Google
Oxford2020) and the Oxford
COVID-19 COVID-19
Government Government
Response Response
Tracker (HaleTracker
et al. (Hale
2020).et al. 2020).
Figure Our research
7 shows thatresults
in thedo not correspond
“low” with Badr etpolicy
level of stringency al. (2020),
the who reveal
largest the strong
regional correlation
diversity is observed.
between mobility patterns and decreasing number of newCOVID-19 cases. There are certainly other
Surprisingly, only half of the voivodeships experience a decline in average mobility in public transport.
drivers/factors explaining voivodeship-specific relationship between changes in mobility in public
Masovian (MZ) represents the highest drop in mobility (−15%) while in Kuyavian-Pomeranian (KP)
transport and epidemic status. It may be population density (Oztig and Askin 2020), initial mobility
a reverse trend is visibleet(+16%).
structure (Galeazzi al. 2020),As far as “medium”
personal income (Coven and and“high”
Guptastringency
2020; Almagro levels
andare concerned,
Orane-
all sixteen voivodeships
Hutchinson 2020) or experience a substantial
diverse perception of thedecrease in mobility
coronavirus pandemic in public transport. However,
as a consequence of
governmental
the magnitude information
of changes campaign (Yuksel
in mobility varies et al. 2020).
across However,
Polish they were
regions. It is not our subject
worth adding matter.
that during
the most Thesevere
results are in line with Pullano
anti-COVID-19 policyet al. (2020) who,
period, in asbased
many on as
France,
seven indicate that the pandemic
voivodeships, the mobility
lockdown was very effective in decreasing people mobility. Pepe et al. (2020) observe a substantial
decreased by more than half compared to the baseline period. Moreover, the highest mobility decrease,
human mobility reduction in Italy following the national lockdown. Similar results are also obtained
regardless
a bythe stringency
Queiroz level,and
et al. (2020) is observed
Bonaccorsi in et Masovian
al. (2020) who,(MZ), Lower
based Silesian
on regional (DS) and
analysis, Lesser
observe the Poland
(MA), while Kuyavian-Pomeranian
reduction in the circulation of people (KP),
in West Pomeranian (ZP)
most neighbourhoods afterand Warmian-Masurian
government (WN) are
social distancing
characterised
policiesby the lowest decline
implementation. Moreover, in our
people’s
researchappearance in public
results correspond transportation
to the system
studies which focus and hubs.
on the
Ourimpact of previous
research results epidemics, particularlywith
do not correspond SARS andetEbola,
Badr on population
al. (2020), who reveal changes in mobility
the strong correlation
(Wang 2014; Lau 2003; Peak et al. 2018). However, the question remains whether the restrictions
between mobility patterns and decreasing number of newCOVID-19 cases. There are certainly other
aimed at limiting human mobility have a significant effect on the reduction in new COVID-19 cases
drivers/factors explaining voivodeship-specific relationship between changes in mobility in public transport
and epidemic status. It may be population density (Oztig and Askin 2020), initial mobility structure
(Galeazzi et al. 2020), personal income (Coven and Gupta 2020; Almagro and Orane-Hutchinson 2020) or
diverse perception of the coronavirus pandemic as a consequence of governmental information campaign
(Yuksel et al. 2020). However, they were not our subject matter. The results are in line with Pullano et al.
(2020) who, based on France, indicate that the pandemic lockdown was very effective in decreasing peopleEconomies 2020, 8, 78 13 of 24
mobility. Pepe et al. (2020) observe a substantial human mobility reduction in Italy following the national
lockdown. Similar results are also obtained a by Queiroz et al. (2020) and Bonaccorsi et al. (2020) who,
based on regional analysis, observe the reduction in the circulation of people in most neighbourhoods
after government social distancing policies implementation. Moreover, our research results correspond to
the studies which focus on the impact of previous epidemics, particularly SARS and Ebola, on population
changes in mobility (Wang 2014; Lau 2003; Peak et al. 2018). However, the question remains whether the
restrictions aimed at limiting human mobility have a significant effect on the reduction in new COVID-19
cases (Schlosser et al. 2020; Yilmazkuday 2020; Askitas et al. 2020). Our study reveals the regional
diversity in the magnitude of mobility changes in public transport depending on the level of severity
of the government anti-COVID-19 policy. Explaining the drivers of above mentioned specific, regional
relationship raises some challenges for the future research. The literature provides some factors that affect
human mobility patterns, including population density (Oztig and Askin 2020), initial mobility structure
(Galeazzi et al. 2020), personal income (Coven and Gupta 2020; Almagro and Orane-Hutchinson 2020) or
diverse perception of the coronavirus pandemic as a consequence of governmental information campaign
(Yuksel et al. 2020).
4. Conclusions
Poland is one of the last European Union countries to have experienced the outbreak of COVID-19
pandemic. The epidemic status in Poland is relatively mild. The Polish government restrictions
severity and stringency are comparable to those of the other countries affected by the coronavirus.
A combination of government lockdown and social fears of contracting and spreading COVID-19 has
caused a substantial reduction in passengers’ public transport demand in Poland.
From the country as well as voivodeship perspective, the study confirms the statistically significant
negative relationship between changes in mobility in public transport and the stringency level of
Polish government anti-COVID-19 policy. It might indicate that the forced lockdown to contain the
development of the COVID-19 pandemic has effectively contributed to social distancing in public
transport in Poland. Moreover, based on ANOVA and Tukey’s HSD test we indicate that there
are significant differences when it comes to the changes in mobility in public transport depending
on the level of stringency of anti-COVID-19 regulation policy both in Poland and all analysed
voivodeships. Furthermore, a substantial regional differentiation is visible regardless the stringency
policy level. The highest mobility decrease is observed in Masovian, Lower Silesian and Lesser Poland,
while Kuyavian-Pomeranian, West Pomeranian and Warmian-Masurian are characterised by the lowest
decline in people’s appearance in public transport.
However, the significant negative relationship between changes in mobility in public transport
and the epidemic status in Poland is not observed. Due to the diverse numbers of laboratory-confirmed
COVID-19 cases and expected different mobility behaviour in individual regions of Poland,
the assessed relationships vary substantially across voivodeships. The results are significant only for
Kuyavian-Pomeranian, Lower Silesian, Masovian, Pomeranian and West Pomeranian voivodeships.
What can be considered surprising, the relationship is insignificant but positive for Silesian, the province
most affected by the COVID-19 pandemic.
Explaining the drivers of voivodeship-specific relationship between changes in mobility in public
transport and the level of severity of the government anti-COVID-19 policy, in particular population
density, initial mobility structure, personal income and people’s novel coronavirus pandemic perception
pose a challenge for the future research.
Author Contributions: Conceptualization: M.W., K.C.; methodology: M.W., K.C.; validation M.W., K.C.; formal
analysis K.C., M.W., Ł.G.; writing—original draft preparation: M.W., K.C., Ł.G.; writing—review and editing:
M.W., K.C., Ł.G.; supervision: M.W., K.C.; project administration: K.C., M.W. All authors have read and agreed to
the published version of the manuscript.
Funding: This research received no external funding.
Conflicts of Interest: The authors declare no conflict of interest.Economies 2020, 8, 78 14 of 24
Economies 2019, 7, x FOR PEER REVIEW 14 of 24
Appendix A
Appendix A
Holly Cross Greater Poland Kuyavian-Pomeranian Lesser Poland
16 20 70 20 30 50 70 10
14 10 60 10 60 0
25
12 0 0 -10
50 50
-10 -10 20 0 -20
10
-20 40 -20 40 -30
8 15
-30 30 -30 30 -40
6
-40 -40 10 -50 -50
20 20
4 -50 -50 -60
10 5 10
2 -60 -60 -70
0 -70 0 -70 0 -100 0 -80
2-03 6-04 11-05 15-06 20-07 2-03 6-04 11-05 15-06 20-07 2-03 6-04 11-05 15-06 20-07 2-03 6-04 11-05 15-06 20-07
Lower Silesian Lublin Lubusz Łódź
80 20 18 20 18 10 70 10
70 10 16 10 16 0 0
60
0 14 0 14
60 -10 -10
-10 -10 50
12 12
50 -20 -20 -20 -20
10 10 40
40 -30 -30 -30 -30
8 8 30
30 -40 -40 -40 -40
6 6
-50 -50 20
20 4 4 -50 -50
-60 -60
10 2 2 -60 10 -60
-70 -70
0 -80 0 -80 0 -70 0 -70
2/03 6/04 11/05 15/06 20/07 2-03 6-04 11-05 15-06 20-07 2-03 6-04 11-05 15-06 20-07 2-03 6-04 11-05 15-06 20-07
Masovian Opole Podlaskie Pomeranian
120 10 20 30 20 20 25 20
0 18 20 18 10
100
-10 16 10 16 0 20 0
14 0 14 -10
80 -20
12 -10 12 -20 15 -20
-30
60 10 -20 10 -30
-40
8 -30 8 -40 10 -40
40 -50
6 -40 6 -50
-60 4 -50 4 -60 5 -60
20
-70 2 -60 2 -70
0 -80 0 -70 0 -80 0 -80
2-03 6-04 11-05 15-06 20-07 2-03 6-04 11-05 15-06 20-07 2-03 6-04 11-05 15-06 20-07 2-03 6-04 11-05 15-06 20-07
Silesian Subcarpathian Warmian-Masurian West Pomeranian
Figure A1. Cont.Economies 2020, 8, 78 15 of 24
Economies 2019, 7, x FOR PEER REVIEW 15 of 24
300 10 30 20 7 20 14 20
0 10 10 10
250 25 6 12
0 0 0
-10
-10 5 10
200 20 -10 -10
-20 -20 4 -20 8 -20
150 -30 15 -30
3 -30 6 -30
-40 -40
100 10 -40 -40
-50 2 4
-50 -50 -50
50 5 -60
-60 1 -60 2 -60
-70
0 -70 0 -80 0 -70 0 -70
2-03 6-04 11-05 15-06 20-07 2-03 6-04 11-05 15-06 20-07 2-03 6-04 11-05 15-06 20-07 2-03 6-04 11-05 15-06 20-07
Figure A1. Changes in mobility in public transport and new COVID-19 laboratory-confirmed cases in Poland by voivodeship from 2 March to 19 July 2020. Source:
Figure A1. Changes in mobility in public transport and new COVID-19 laboratory-confirmed cases in Poland by voivodeship from 2 March to 19 July 2020. Source: own
own elaboration based on data from Google COVID-19 Community Mobility Reports (Google 2020) and Ministry of Health of the Ministry of Health of the Republic of
elaboration based on data from Google COVID-19 Community Mobility Reports (Google 2020) and Ministry of Health of the Republic of Poland (2020).
Poland (2020).Economies 2020, 8, 78 16 of 24
Economies 2019, 7, x FOR PEER REVIEW 16 of 24
Holly Cross Greater Poland Kuyavian-Pomeranian Lesser Poland
90 20 90 20 90 40 90 10
80 10 80 10 80 80 0
20
70 0 70 0 70 70 -10
60 -10 60 -10 60 0 60 -20
50 -20 50 -20 50 50 -30
-20
40 -30 40 -30 40 40 -40
30 -40 30 -40 30 -40 30 -50
20 -50 20 -50 20 20 -60
-60
10 -60 10 -60 10 10 -70
0 -70 0 -70 0 -80 0 -80
2-03 6-04 11-05 15-06 20-07 2-03 6-04 11-05 15-06 20-07 2-03 6-04 11-05 15-06 20-07 2-03 6-04 11-05 15-06 20-07
Lower Silesian Lublin Lubusz Łódź
90 20 90 20 90 10 90 10
80 10 80 10 80 0 80 0
70 0 70 0 70 70
-10 -10
-10 -10
60 60 60 60
-20 -20 -20 -20
50 50 50 50
-30 -30 -30 -30
40 40 40 40
-40 -40 -40 -40
30 30 30 30
-50 -50
20 20 20 -50 20 -50
-60 -60
10 -70 10 -70 10 -60 10 -60
0 -80 0 -80 0 -70 0 -70
2-03 6-04 11-05 15-06 20-07 2-03 6-04 11-05 15-06 20-07 2-03 6-04 11-05 15-06 20-07 2-03 6-04 11-05 15-06 20-07
Masovian Opole Podlaskie Pomeranian
90 10 90 30 90 20 90 20
80 0 80 20 80 10 80 10
70 -10 70 10 70 0 70 0
0 -10
60 -20 60 60 -10 60
-10 -20
50 -30 50 50 -20 50
-20 -30
40 -40 40 40 -30 40
-30 -40
30 -50 30 30 -40 30
-40 -50
20 -60 20 -50 20 -50 20 -60
10 -70 10 -60 10 -60 10 -70
0 -80 0 -70 0 -70 0 -80
2-03 6-04 11-05 15-06 20-07 2-03 6-04 11-05 15-06 20-07 2-03 6-04 11-05 15-06 20-07 2-03 6-04 11-05 15-06 20-07
Silesian Subcarpathian Warmian-Masurian West Pomeranian
Figure A2. Cont.You can also read