DECOMMISSIONING INSIGHT - OGUK
←
→
Page content transcription
If your browser does not render page correctly, please read the page content below

BUSINESS OUTLOOK 2020

DECOMMISSIONING INSIGHT
2020
                        1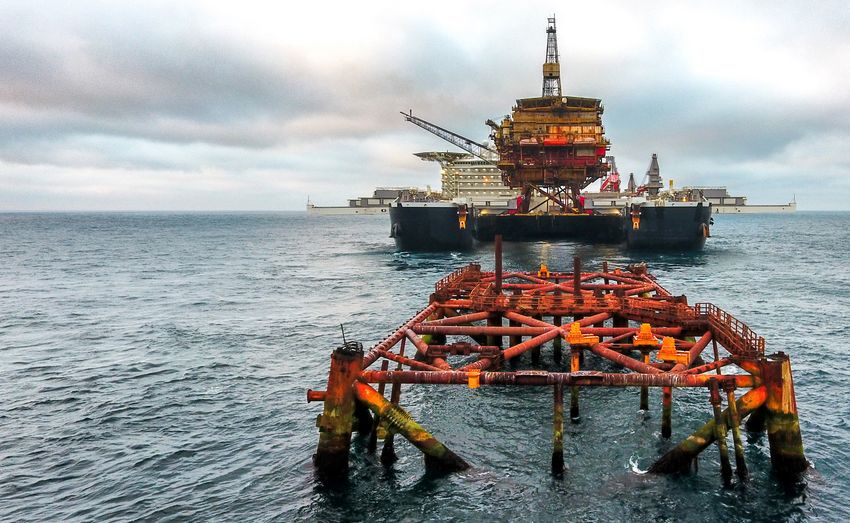
Our vision is to ensure the
UK Continental Shelf becomes the
most attractive mature oil and gas
province in the world with which to
do business.

Read all our industry reports at
www.oilandgasuk.co.uk/publications    Front cover image courtesy of Allseas
DECOMMISSIONING INSIGHT 2020
                               2. Foreword                                            3
                               3. Key Findings                                        6
                               4. Decommissioning in 2020                             8
                                    4.1 2020 – A Challenging Year                     8
                                    4.2 The Impacts of COVID-19 and Commodity
                                         Price Collapse                              10
                                    4.3 Removal Activity Continues to Progress
                                         in 2020                                     12
                               5. UK Decommissioning in Perspective                  14
                                    5.1 Decommissioning Over the Next Decade         14
                                    5.2 The Decommissioning Work Breakdown
                                         Structure — Ten-Year Expenditure Forecast   16
                                    5.3 Forecast Activity in the UKCS —
                                         A Detailed Snapshot                         18
                                    5.4 Cost Performance and Benchmarking            20
                                    5.5 Building on What We Have Achieved So Far…    22
                               6. Decommissioning in the Wider North Sea             24
                               7. Decommissioning and the Energy Transition          26
                               8. Appendices                                         29
                                    Appendix 1 — Maturity of Estimates               29
                                    Appendix 2 — Glossary                            30
                                    Appendix 3 — UKCS Expenditure
                                    Breakdown 2020, to 2029                          32
                                    Appendix 4 — UKCS Decommissioning
                                    Activity Overview, 2020–29                       33

DECOMMISSIONING INSIGHT 2020                                                          3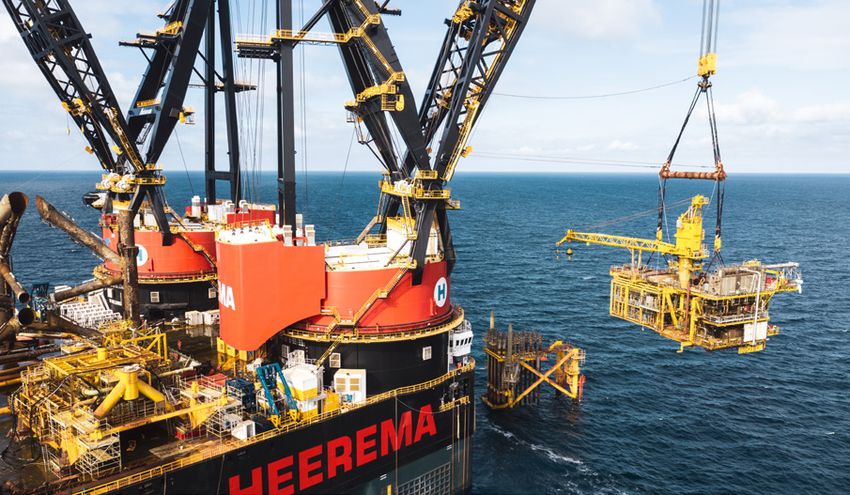
2. Foreword

Welcome to OGUK’s Decommissioning Insight 2020, which captures a year like no             of pipelines and the removal of 15 topsides, including a record two northern North
other the industry has ever experienced. The oil and gas sector continues to deal with    Sea platforms — proof of the resilience within the supply chain even in these hard-
the effects of COVID-19 and the collapse of commodity prices. Decommissioning has         pressed times.
not escaped the impact of such unprecedented conditions.
                                                                                          Over the longer term, the impacts of the virus, the commodity price collapse and
Now in its eleventh year, as the Insight report enters a new decade it will continue to   ongoing volatility in decommissioning remains to be seen, with this year’s survey
provide a key source of knowledge for the UK decommissioning industry. Its initial aims   reporting that up to £15 billion is still expected to be spent over the next ten years.
remain the same as always: enhancing our understanding of the decommissioning             Amid our ongoing challenges, it is imperative that we focus on ensuring the resilience
market — at home and throughout the wider North Sea — and demonstrating the               of our supply chain through, for example, ensuring visibility of work so that when
sector’s unique expertise and capabilities to the world. The report has now widened       conditions change, our industry remains competitive.
in scope to incorporate new priorities, in particular industry’s action to accelerate
the energy transition and embrace opportunities to support a low-carbon future.           Year on year the Decommissioning Insight report tracks the success and continual
                                                                                          improvements the UK decommissioning industry achieves. This year there have been
Over the past few years, this report has been built around data received via the          significant milestones in performance improvement, with the OGA’s latest UKCS
Oil and Gas Authority (OGA) Asset Stewardship Survey. However, given the major            Decommissioning Cost Estimate Report showing a 19 per cent reduction in the overall
disruptions and challenges faced this year, OGUK conducted an additional interim          costs of decommissioning over the past three years. This demonstrates industry’s
survey of operators in June 2020 to provide deeper insight of the impact of COVID-19      concerted efforts to drive progress are having a real impact as we maintain our focus
on decommissioning activity. This survey showed that continuing market uncertainty        on delivering a 35 per cent reduction in decommissioning costs by 2022, from an
has led to around £500 million of decommissioning expenditure previously scheduled        initial estimate of almost £60 billion set in 2017.
for 2020-22 being deferred into the future.
                                                                                          The remaining 16 per cent of our 35 per cent cost reduction target will be harder
It is clear there is no rush to decommission and as with every part of the oil and        to achieve, but we must build upon the progress we have already made. Industry
gas business, reduced cash flow is impacting decommissioning plans. Accordingly,          views safe and environmentally sustainable decommissioning as a priority and
anticipated expenditure on decommissioning this year has fallen from £1.47 billion        needs to ensure these are continually pursued within our projects. Technology and
in early 2020, to around £1.08 billion — a 30 per cent reduction. Reductions in           research are also key focus areas, with industry using services offered by the Oil and
expenditure have affected the supply chain, and reduced activity is now expected          Gas Technology Centre (OGTC) and now the National Decommissioning Centre, both
across almost all areas of decommissioning work during the next three years.              of which play a role in identifying areas where innovation is required and to bring
Despite this, 2020 has seen the decommissioning of around 116 wells, almost 260km         solutions to market, helping anchor capability here in the UK.

4                                                                                                                                                 DECOMMISSIONING INSIGHT 2020
In the short term, it’s vitally important that we stimulate activity across the oil
and gas industry, including in decommissioning, so that work can be conducted on
those assets that are “decommissioning ready”. Ensuring a steady, sustainable and
predictable workload will keep key portions of the industry in business during these
tough times. This is critical if we are to meet our cost targets and key to helping
us ensure our world-class supply chain remains anchored in the UK, providing jobs
and growing revenue from exports. Driving a collaborative mindset, which has been
evident in many of the removal projects executed during 2020, will help ensure that
operators and supply chain companies can work together to make the most of the
opportunities of the future.

This year, we have seen the decommissioning sector demonstrate resilience,
determination and innovation in its response to considerable challenges. We will
need all these qualities to ensure we can play our role in the energy transition,
enabling us to seize the opportunities presented by energy integration, carbon
capture and storage and innovation in low-emission decommissioning.

Katy Heidenreich
Supply Chain & Operations Director, OGUK

DECOMMISSIONING INSIGHT 2020                                                           5
3. Key Findings

     Decommissioning in 2020                                                           In the next 10 years…
                  Total spend on decommissioning in 2020 is estimated at                                                 NNS
        10%
                  £1.1bn — around 10% of total annual expenditure
                                                                                       Full impact of COVID /
                                                                                       commodity price collapse
                                                                                                                               CNS               EXPENDITURE
                                                                                       remains to be seen but                        SNS         NNS - 40%
                                                                                                                                     &IS
                                                                                       industry expects to spend                                 CNS - 32%
                                                                                                                                           WoS   SNS&IS - 20%
    Short-term expenditure is reduced, indicating no rush to decommission
                                                                              £500m    up to   £15.1bn                                           West of Shetland - 8%
    Expenditure          2020 forecast         Revised forecast     ~£500m
    under increased      spend has             spend:               of expenditure
    scrutiny             fallen 30%                                 has been           Well decommissioning accounts                  Almost £2.2bn (14%)
                         from                  2021 = £1.2bn        removed from       for 49% of expenditure                         to be spent on removals
                         £1.47bn to            2022 = £1.2bn        operator budgets
                         £1.08bn                                    2020-22            £7.4bn to be                                   Greater efficiencies
                                                                                       spent on well
                                                                                                                   49%                and project
                                                                                       decommissioning
    A varied year for the decommissioning supply chain                                                                                completions
                                                                                       1,616 wells                                    mean that
    • Removals activity progressing            • A record 2 NNS lifts in               over next decade                               expenditure
    • Well activity sees                         one year, totalling 30,000t                                                          on removals
      reduction with 116 wells                 • 15 topsides lifted
                                                                                                     Majority of North Sea            has reduced
      decommissioned in 2020                   • 258km of pipelines decommissioned
                                                                                                     activity happening in            from £2.7 bn
                                                                                                     the UK: 60% of                   in the 2019
    For the4th consecutive year well decommissioning activity (116 wells)                            well activity; 73% of            Insight forecast
                                                                                                     topsides; 53% of the
    outweighs exploration (4), appraisal (3), and development (60) combined                          substructure activity

6                                                                                                                                                DECOMMISSIONING INSIGHT 2020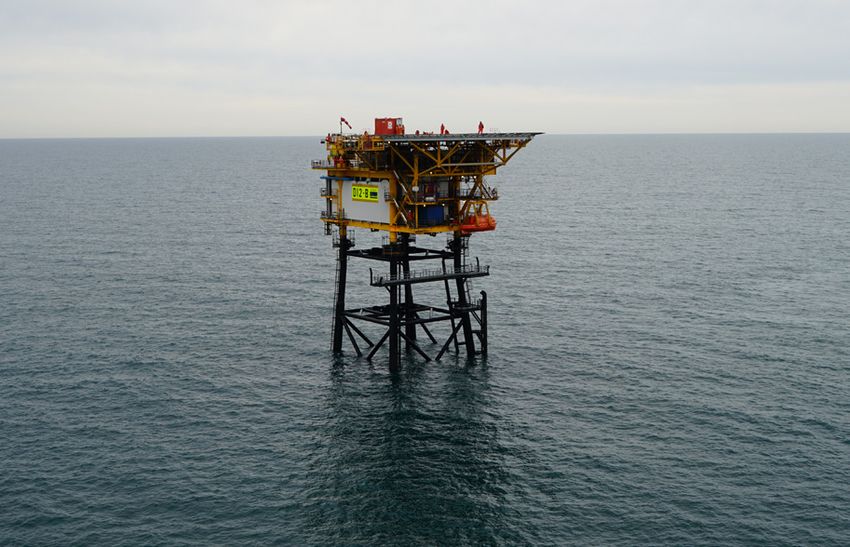
Building on what we have achieved so far…                                                       Decommissioning in the Energy Transition
 Industry is working to become more effective and efficient                                       Low-carbon decommissioning

 Long execution windows –                                Current perfomance already               Decommissioning can be an energy-intensive exercise —
 helping successful                                      outperforming expectations:              we must find ways to reduce our total carbon footprint
 supply chain-led 			                                                                             in decommissioning, like any other part of the industry
 schedules                                               Subsea well costs                        and the rest of the economy
                                                         NNS — £1.2m less per well
                                                         SNS — £0.88m less per well

                                                                                                  Supporting the circular economy
 Establishing the UK as a global hub
                                                                                                                  Decommissioning industry is working hard to re-use
                                                               KEY FOCUS AREAS                                    equipment before recycling or disposal

                  Y                      REP                   Safe and environmentally sound
               LIT                          U                                                     Re-using and Re-purposing
           I

                         Operators
         AB

                                               TA

                                                                   Mul�-operator campaigns
                                                 TIO
      CAP

                             Proje
                                  ct                                                                              Re-purposed topsides facilities have
                                                    N
                                     s

                                                                                                                  been used in new oil developments, but
                                                                    Innova�ve contrac�ng models
                                                                                                                  there are also tangible opportunities to
                                                                                                                  repurpose for use in new industries like
                                                                                                                                                                   CO2
                                                                   Exports
                                                                                                                  CCUS, hydrogen and offshore wind
          Supply Chain                   Government            Technology
                                         & Regulators
                     EXP
                           E RTISE
                                                        Academia

DECOMMISSIONING INSIGHT 2020                                                                                                                                             7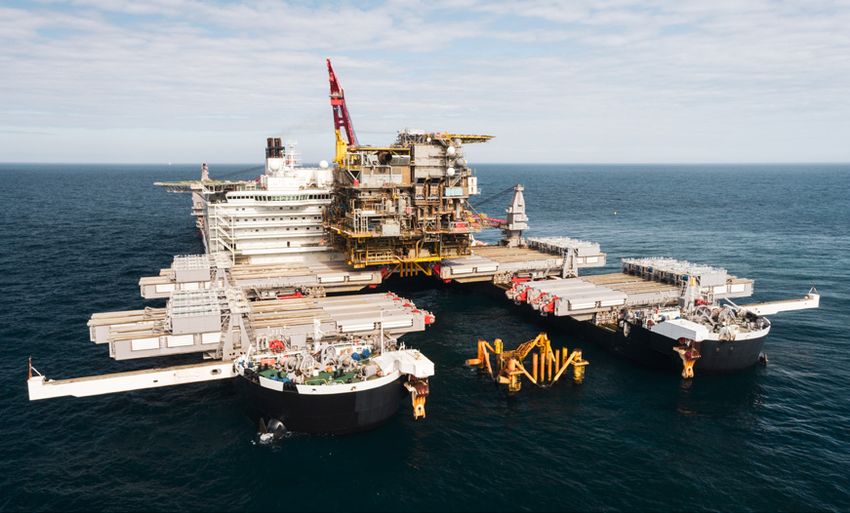
4. Decommissioning in 2020
4.1 2020 – A Challenging Year
2020 has been a challenging year for all of us — Due to the impacts of the coronavirus      Constraints on the workforce offshore — As well as expenditure reductions, the
pandemic, we have seen oil prices collapse in the spring, followed by partial improvement   industry has endured the effects of the virus itself. The oil and gas industry is essential
in Q2. The oil price fluctuations and ongoing uncertainty have influenced the business      to providing affordable energy for homes and businesses across the country, with our
environment in the oil and gas industry and impacted the UK decommissioning sector          offshore industry supplying enough to meet more than 60 per cent of the UK’s oil and
in many ways.                                                                               gas demand. The nation needs energy to keep the lights on and heat our homes, which
                                                                                            is why the government designated many oil and gas personnel as “key workers” to
Decommissioning expenditure under increased scrutiny — At times of uncertainty,             ensure production from our offshore assets could continue. However, along with key
operators' budgets are constrained and all expenditure is subject to increased scrutiny.    safe working protocols, offshore personnel numbers are being kept to a minimum to
Decommissioning expenditure is viewed alongside capital and operational expenditure         restrict exposure to the virus. OGUK’s Workforce Insight 2020,1 released in October,
and during uncertain times it is likely that reductions will be made in all areas where     showed that offshore personnel on board (POB) numbers fell from just over 11,000 POB
possible. However, decommissioning activity is not discretionary, which means that          in early March 2020 to just over 7,000 POB in mid-April. This meant that almost all non-
if activities are not conducted now, they will be moved into the future. Estimates of       essential activity was ceased, and although numbers partially recovered to about 9,000
deferred work are set out later in the report.                                              POB through August, the focus has remained largely on continued operations and safety
                                                                                            critical maintenance.

                                                                                            A varied year for the decommissioning supply chain — Decreased expenditure
                                                                                            and restrictions offshore have increased pressure on the decommissioning supply
                                                                                            chain, who were still recovering from the previous downturn. Most of the offshore
                                                                                            decommissioning workscopes at present take place during the summer months, and
                                                                                            this year’s requirement to reduce POB and focus on essential activity has prevented
                                                                                            many such projects from progressing. Nevertheless, the industry has still been able
                                                                                            to complete some projects, with a resilient supply chain eager to maintain an active
                                                                                            workforce during these testing times and creating a flurry of activity, particularly around
                                                                                            the removal of offshore assets in the latter part of summer 2020, as shown in Figure 1.

                                                                                            1
                                                                                                https://oilandgasuk.cld.bz/Workforce-Insight-2020/4/

8                                                                                                                                                      DECOMMISSIONING INSIGHT 2020
UKCS Decommissioning Removals Activity
                                                                                                                                                                  Brent         Thistle COS        Vampire
                                                                                                                                                                  Alpha         Tanks Removal      OD Jacket
                                                                                                                                       Viking BA Jacket           Topsides                         Removal
                                                                                                                     Viking            Removal                    Removal                                             Pickerill B
                                                                                                                     BP Jacket
                                                       Guinevere Removals                                                                           Vampire                                                           Topsides Removal
                                                                                                                     Removal
                                                                                                                                                    OD Topsides
                                                                                                                  Viking BP                         Removal
                                                                                                          Topsides Removal                                          Viking BC
                                                                                                                                                                    Topsides Removal
                                                                                     Ganymede ZD             Caister CM                            Europa EZ                    Viking
                                                                                  Topsides Removal             Topsides                            Topsides                     BD Jacket
                                                                                                               Removal                             Removal                      Removal

                                                                                                                         Viking BA             Viking BD   Viscount          Viking BC
                                                                                                                 Topsides Removal               Topsides   AO Topsides       Jacket Removal
                                                                                                                                                Removal    Removal
                                   80                                                                                                                 Brent Alpha Jacket                        Ninian Northern
                                                                                                                                                      Decommissioning                           Topsides Removal
                                   70
                                                                                                                          Market stabilises around $40,
Brent Crude Price ($ per Barrel)

                                                                                                                          however supply and demand
                                   60                                                                                            remain fragile
                                                                                                                                                                       Prices rise in line with easing of economic restrictions around the world
                                                                                Breakdown of OPEC talks aimed at                                                                 and OPEC restrictions drive supply to a nine-year low
                                                                                reducing supply to counter falling
                                   50      Wuhan Province                              global oil demand
                                           in China enters
                                   40         lockdown

                                   30

                                   20        OPEC and ally countries
                                                agree to record                                                      Prices fall amidst concern that the extent of the                             Global markets surge on positive news of
                                   10           production cuts                                                      supply cuts not enough to balance the market.                               COVID-19 vaccine trials. Brent prices increase
                                                                                                                     Prices in the US turn negative for the first time.                                    more than 15 per cent.
                                    0
                                        Jan-20        Feb-20           Mar-20         Apr-20           May-20                 Jun-20             Jul-20               Aug-20                  Sep-20           Oct-20            Nov-20
                                                                                                       Figure 1: Oil Price and UKCS Removals Activity, 2020                                                                      Source: EIA, OGUK
     DECOMMISSIONING INSIGHT 2020                                                                                                                                                                                                                  9
4.2 The Impacts of COVID-19 and Commodity Price Collapse
Reliable and definitive information is invaluable in uncertain times, which is why for
Decommissioning insight 2020, OGUK has conducted an additional survey to test the impact         Survey methodology
of COVID and the commodity price fluctuations on decommissioning activity and expenditure.       Data for the Decommissioning Insight 2020 have been provided by all 31 operators
                                                                                                 across the UKCS as part of the Asset Stewardship Survey, overseen by the OGA. The
Industry is still spending almost £1.1 billion on decommissioning in 2020 — Figure               survey collates information from all UK operators between November and February
2 shows that over the next three years industry expects to spend about 13 per cent               each year. The impacts of COVID-19 took hold around March 2020, which meant
(£514 million) less than anticipated at the beginning of 2020. Reductions carry through          that the information provided by operators for the survey had changed, particularly
into 2021 and 2022 with around 8 per cent and 1 per cent less expenditure anticipated,           for short-term activity and expenditure. Recognising this, OGUK conducted a
respectively. It is not unusual for the forecast expenditure at the beginning of each            survey in June which sought to understand differences in activity and expenditure
year to be higher than actual expenditure realised at year-end. Last year the industry           from 2020–22. The data from the response to this survey have been used to make
anticipated that around £1.6 billion would be spent during 2019, whereas only around             assumptions over the remainder of the dataset. The forecasts in this report are
                                                                                                 provided by operators and represent their best estimates at the time of the survey.
£1.4 billion was actually committed. The OGA’s UKCS Decommissioning Cost Estimate
                                                                                                 Timings are therefore subject to change.
2020 2 attributed 70 per cent of this to project efficiencies rather than deferral of scope.

The future is uncertain — Figure 3 shows the cumulative expenditure in June 2020 (solid        All decommissioning activities affected — Figure 4 shows that all areas of the
purple) in comparison with the start of 2020 (orange). Although hopes of a vaccine have        decommissioning Work Breakdown Structure (WBS) have been affected by the events
risen, there remains a high degree of uncertainty over near-term oil supply and demand         of 2020. Platform and subsea well decommissioning activity have fallen by over 30 per
profiles. Low oil prices may bring forward Cessation of Production (CoP) for some              cent and topsides and substructure removals activities are also down by 18 per cent and
assets but will also put pressure on cash flow within operators, which could prevent           11 per cent this year, respectively. All areas see an anticipated rise in activity in 2022,
progression of decommissioning projects. The full impact of COVID and the commodity            suggesting some work has been deferred to this point and beyond.
price volatility remains to be seen. The UK oil and gas industry has proved in the past to
be resilient and it is likely that this resilience will be tested once again.                  Supply chain-led scopes — Encouragingly, a lot of removals scopes have progressed
                                                                                               in 2020. Many topsides and substructure removal workscopes are placed with long
Budgets could be further reduced — As shown, budgets set at the beginning of 2020              execution windows, enabling the supply chain to select when to conduct work, and
have been reduced substantially throughout the year. Budgets are now set for 2021 at a         ensuring better asset utilisation. Many companies have selected 2020 as the time for
lower level and could be reduced further, depending on market environment.                     these removals, with order books otherwise quiet. This is a good example of collaboration
                                                                                               between operators and supply chain co-ordinating schedules to make activity occur — a
                                                                                               co-operative behaviour industry and regulators have been advocating for some time.
2
    https://www.ogauthority.co.uk/media/6638/ukcs-decommissioning-cost-estimate-2020.pdf
10                                                                                                                                                       DECOMMISSIONING INSIGHT 2020
Figure 2: Forecast Expenditure Comparison, January and June 2020 Figure 3: Cumulative Decommissioning Expenditure Comparison
January Forecast June Forecast Difference
4,500 24
4,000 Year
Year Start Current Difference -13% Actual Expenditure
Estimate (£MM) Estimate (£MM) (£MM) 22 Forecast Expenditure at Beginning of 2020
3,500 2020 1,470 1,080 -390 Forecast Expenditure in June 2020
20
Decommissioning Expenditure (£MM)
2021 1,306 1,197 -109
Cumulative Decommissioning Expenditure
3,000 Reduced Spend Scenario 1
2022 1,179 1,164 -15 18
2,500 Total 3,955 3,441 -514 Reduced Spend Scenario 2
16
(£Billion - 2019 Money)
2,000
-27% -8%
1,500
-1% 14
1,000
12
500
10
0
8
-500
6
-1,000
2020 2021 2022 Total
Source: OGA, OGUK 4
2017 2018 2019 2020 2021 2022 2023 2024 2025 2026 2027 2028 2029
Source: OGA, OGUK
Figure 4: Forecast Activity Comparison, January and June 2020
Number of Platform Wells Number of Subsea Wells Substructure Mass to be Topsides Mass to be Length of Pipeline to be
(quantity) (quantity) Removed (tonnes) Removed (tonnes) Decommissioned (km)
Pre Post % Pre Post % Pre Post % Pre Post % Pre Post %
2020 141 95 67% 25 17 68% 25,570 22,861 89% 61,598 50,730 82% 514 258 50%
2021 83 75 90% 47 41 87% 23,033 18,825 82% 81,465 89,695 110% 496 375 76%
2022 95 118 124% 28 31 111% 22,415 24,435 109% 45,967 52,891 115% 375 377 101%
Total 319 288 90% 100 89 89% 73,018 66,121 93% 189,030 193,316 102% 1,385 1,010 73%
Work Deferred -375km
-31 wells -11 wells -4,897 tonnes +4,286 tonnes
/ Advanced *Including pipelines decommissioned in situ
DECOMMISSIONING INSIGHT 2020 114.3 Removal Activity Continues to Progress in 2020
Despite the challenges presented in 2020, many removals projects have progressed across Chrysaor — Southern North Sea
the North Sea. The case studies below demonstrate the resilience of the decommissioning Decommissioning Campaigns
supply chain, and are good examples of supply chain-led schedules, campaigning and Chrysaor is carrying out an extensive
effective partnerships. decommissioning and removals campaign in the
southern North Sea (SNS). This multi-year project is
Shell U.K. — Brent Alpha spread across 38 offshore platforms, 145 wells and
Brent Alpha is the third platform to be removed over 2,000 kilometres of pipeline. It also includes
from the Shell U.K.-operated Brent field, following an onshore gas terminal at Theddlethorpe, which is
Delta in 2017, and Bravo in 2019. Despite the currently being dismantled. Using pre-mobilisation
effects of COVID-19, this year saw successful quarantine periods, personnel testing and the
single-lift removal of the 17,000-tonne Brent creation of vessel “bubbles”, removals work in the
Alpha topsides by Allseas using its Pioneering SNS proceeded uninterrupted by COVID-19 in 2020.
Spirit vessel. A large execution window allowed With work continuing as planned, the teams removed
Allseas to plan the lift as part of a larger campaign 10 platforms, carried out preparation work at several
of work across the UK and Denmark during the summer of 2020. other sites, and decommissioned 20 wells.
Hereema Marine Contractors’ Sleipnir heavy-lift vessel was also deployed to lift the Removal and disposal contracts across the SNS were
10,000-tonne Alpha jacket vertically, complete with the well conductors secured inside awarded to four companies via separate tenders.
– the first time this has been done on this scale, saving a considerable amount of time Chrysaor’s tender strategy allowed contractors a
offshore. period of up to two years to plan removal activities,
which allowed them to create efficient work
Large supply chain windows and previous experience have also improved results. The campaigns. Chrysaor also mobilises its own removal
time Pioneering Spirit spent at the field for each lift has been reduced from two and half preparation and well decommissioning teams on the
days on Delta to less than 24 hours for Alpha. Topsides lift preparation effort for lifts has same rig, allowing work to continue simultaneously
also been reduced, with Bravo requiring 60 per cent less than Delta and Alpha 30 per on wells with topside and jacket preparation. This
cent less again. simultaneous operation has been a key differentiator
in terms of costs
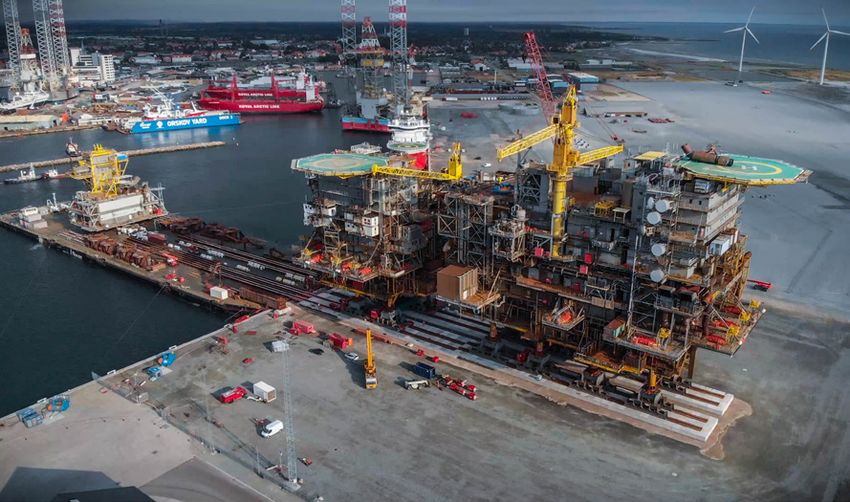
12 DECOMMISSIONING INSIGHT 2020TOTAL — Tyra Field Redevelopment, Denmark The Tyra field has been the core of the Danish North Sea’s energy infrastructure Spirit’ to remove around 45,000 tonnes steel in more than 30 lifts. In the first phase, for almost 40 years, processing 90 per cent of the nation’s natural gas. The field is wellhead and riser topsides, bridge modules, flare towers, bridges and support braces currently being redeveloped by TOTAL and Danish Underground Consortium due to were decommissioned with high precision to ensure that existing jackets and wells subsidence of the main platforms. The rejuvenation of the infrastructure represents can be reused as part of the new Tyra. In the second phase, the 15,500 tonnes and a unique opportunity to secure natural gas supply for several decades while reducing 7,800 tonnes integrated accommodation- and process platforms were both removed CO2 emissions by 30 per cent. in single lifts. Despite the challenging conditions imposed by the COVID-19 pandemic, the After removal, the old Tyra modules have been delivered onshore to Frederikshavn, decommissioning of the subsided platforms was successfully completed this summer Denmark and Vlissingen, Holland where more than 95 per cent of the materials will using the world’s largest construction- and crane vessels ‘Sleipnir’ and ‘Pioneering be reused and recycled. DECOMMISSIONING INSIGHT 2020 13
5. UK Decommissioning in Perspective
     5.1 Decommissioning Over the Next Decade
                                            Figure 5: UKCS Decommissioning Expenditure, 2020–29                                                                                                                        Figure 6: Well Activity in the UKCS, 2010–20

                         2,500
                                        Actual Expenditure                                          Project Management
                                        Post CoP Facility Running Costs                             Well Decommissioning                                                                           350
                                        Facilities / Pipeline De-energising                         Topside Preparation
                                        Topside Removal                                             Substructure Removal
                                        Topsides and Substructure Onshore Decommissioning           Subsea Infrastructure
                                        Site Remediation                                            Post-decommissioning Monitoring
                                                                                                                                                                                                   300           Exploration      Appraisal
                         2,000          Forecast Expenditure in January 2020

                                                                                                                                                                                                                 Development      Decommissioned
                                                                                                                                                                                                   250

                         1,500

                                                                                                                                                                                 Number of Wells
     Expenditure (£MM)

                                                                                                                                                                                                   200

                         1,000                                                                                                                                                                     150

                                                                                                                                                                                                   100
                          500

                                                                                                                                                                                                   50

                            0                                                                                                                                                                       0
                                 2019        2020             2021            2022          2023   2024           2025                2026     2027         2028          2029
                                                                                                                                                                                                         2010   2011     2012   2013      2014     2015   2016      2017   2018   2019      2020E
                                                                                                                                                      Source: OGA, OGUK
                                                                                                                                                                                                                                                                                     Source: OGA, OGUK
00
                                 Actual Expenditure                                                                                          Project Management
                                 Post CoP Facility Running Costs                                                                             Well Decommissioning
                                 Facilities / Pipeline De-energising                                                                         Topside Preparation
                                 Topside Removal                                                                                             Substructure Removal
                                 Topsides and Substructure Onshore Decommissioning                                                           Subsea Infrastructure
                                 Site Remediation                                                                                            Post-decommissioning Monitoring
00                               Forecast Expenditure in January 2020

     14                                                                                                                                                                                                                                                          DECOMMISSIONING INSIGHT 2020
As with previous reports, Decommissioning Insight 2020 Figure 7: UKCS Expenditure
also focuses on cost and activities over the next decade,
placing a spotlight on tangible opportunities for the UK
35
Total Expenditure (£Billion - 2019 Money)
decommissioning supply chain. Operating Expenditure Development Expenditure
30
Decommissioning expenditure expected to rise E&A Expenditure Decommissioning Expenditure
25
steadily over the next ten years — Previous Insight
reports have shown that decommissioning expenditure 20
is expected to be around £1.5 billion per year. Figure 5 15
shows a gradual increase in expenditure over the next
10
three years which reaches about £1.5 billion in 2024-26
before increasing at the end of the dataset where the 5
data become less certain. The black dotted line shows a 0
comparison between the asset stewardship submissions
st
70
72
74
76
78
80
82
84
86
88
90
92
94
96
98
00
02
04
06
08
10
12
14
16
18
Fo 20
ca
19
19
19
19
19
19
19
19
19
19
19
19
19
19
19
20
20
20
20
20
20
20
20
20
20
20
re
in February 2020 and the OGUK survey returns in June
Source: OGUK, OGA
2020.
More than £15 billion spent over the next ten years UK well activity reduced — Figure 6 shows well activity over time. Since 2017, well decommissioning activity has outweighed
— While short-term activity remains uncertain, the exploration, development, and appraisal activity combined. This year has been exceptional, and current market conditions
longer-term view is not too dissimilar to that seen in the have driven drilling activity to its lowest levels since the early 1970s. Exploration and appraisal activity is at the lowest level
2018 and 2019 Decommissioning Insight reports. Over in the basin’s history, with only four explorations wells spudded this year to date. Whereas well decommissioning activity
the next decade industry is still expected to spend up had seen a steady increase since 2014, this year sees a major reduction compared with the activity in the past few years.
to £15.1 billion on decommissioning activity. The 2018
and 2019 reports anticipated a ten-yearly expenditure Decommissioning is 10 per cent of UK oil and gas expenditure — In 2020 the UKCS oil and gas industry is forecast to
of £15.3 billion and £15.2 billion, respectively. spend a total of £10.9 billion across all activities, as shown in Figure 7. Around £1.1 billion of this is on decommissioning,
representing around 10 per cent of the overall expenditure and consistent with previous years. This shows that, even in
the current business environment, investment in the basin and expenditure on continued operation of our current assets
significantly exceeds decommissioning expenditure.
DECOMMISSIONING INSIGHT 2020 15OUT OF
SERVICE
5.2 The Decommissioning Work Breakdown Structure — Ten-Year Expenditure Forecast
Figure 8: Work Breakdown Structure and Expenditure Proportion, 2020–29
OUT OF
SERVICE
1 2 3 4 5 6 7 8 9 10 11
Project Post-CoP Well Facilities & Pipelines Topsides Topsides Substructure Topsides and Subsea Site Post-
Management Running Costs Decommissioning Permanent Isolation Preparation Removal Removal Sub-structure Infrastructure Remediation Decommissioning
& Cleaning Onshore Disposal Monitoring
Proportion of
Overall Ten-Year
Expenditure (£MM) 7% 9% 49% 3% 3% 8% 6% 2% 11% 1%Figure 9: UKCS Regional Expenditure CNS and SNS see slight reductions in forecast spend — Figure 8 shows the breakdown of expenditure across each WBS element
Breakdown, 2019 vs 2020 Forecast and by region. Just over £6 billion is expected to be spent in the central North Sea (CNS) region and over £3 billion in the southern
40% North Sea (SNS). This represents a slight reduction in overall expenditure when compared to Decommissioning Insight 2019 for
8%
these areas, which stated £6.4 billion and £3.4 billion, respectively.
2020-2029
Decommissioning spend growing in West of Shetland — Perhaps one of the most notable developments apparent in this region
20%
40%
is in well decommissioning. This year’s forecast sees over £1.1 billion of anticipated decommissioning spend over the next decade,
£900 million of which is for well decommissioning occurring closer to the end of the decade.
Last year’s report showed that around £5.4 billion would be spent on decommissioning in the NNS and WoS region combined. By
comparison, this year’s report forecasts almost £6 billion in these regions. The increased proportion of expenditure is also apparent
Central North Sea
on review of the percentage breakdown by region over the next decade. Figure 9 shows this year’s dataset compared with data
32% Northern North Sea
Southern North Sea and Irish Sea
presented in Decommissioning Insight 2019. The data show that the proportion of spend in the west of Shetland has doubled to
West of Shetland 8 per cent, from 4 per cent last year. Both central and southern North Sea regions have reduced by 2 per cent while the northern
Central North Sea
North Sea has remained the same.
Northern North Sea
Southern North Sea and Irish Sea
Almost £7.4 billion is to be spent on well decommissioning — Well decommissioning still accounts for the vast majority of
decommissioning costs over the next decade, at 49 per cent of total decommissioning expenditure. This has increased from the
West of Shetland £6.8 billion (45 per cent) reported in Decommissioning Insight 2019. While the spend has increased, the number of wells slated
for decommissioning over the next decade has fallen, from 1,630 forecast last year to 1,616 as of 2020. Some of this change will
4%
be down to the fact that there is a higher proportion of subsea wells in this year’s dataset, which are generally more expensive to
decommission.
2019-2028
22%
42% Expenditure on removals has reduced — Decommissioning Insight 2019 showed that over £2.7 billion (18 per cent) would be
spent on topsides and substructure removal activity, represented by a combination of elements six and seven of the WBS. This
year’s report puts forecast expenditure at £2.2 billion (14 per cent), owing to some expenditure being liquidated in 2019 and
progress in cost reduction. Forecast expenditure on subsea infrastructure decommissioning (such as pipelines, mattresses and
subsea structures) has risen to over £1.6 billion (11 per cent) from around £1.3 billion (9 per cent) reported last year.
32%
DECOMMISSIONING INSIGHT 2020 175.3 Forecast Activity in the UKCS — A Detailed Snapshot
Figure 10 shows that 1,616 wells are to be decommissioned on the UKCS over the Figure 10: Well Activity in the UKCS 2020–29
next ten years. While Decommissioning Insight 2019 saw a relatively steady workload
fluctuating between 120 and 170 wells per year between 2019–26, this year’s data 250 Platform Wells
show fewer wells slated for decommissioning in the short term. Activity is seen to rise Subsea Wells
steadily from just over 115 wells in 2020, to just over 150 wells in 2022. The deferral Suspended Subsea E&A Wells
of short-term activity is creating a spike in 2023, however history has shown that 200
Nubmer of Wells to be Decommissioned
this tends to flatten out as budgets are revisited, which may also affect the increased
activity profile seen towards the end of the dataset. It should also be noted that many
of these wells are “decommissioning ready” with projects planned and pre-engineering 150
work completed — in many cases they may simply be awaiting budget to proceed.
Figures 11 and 12 show that just under 660,000 tonnes of topsides and just over 370,000 100
tonnes of substructures are to be decommissioned over the next decade. The majority
of the removal weight (40 per cent) comes from platforms in the northern North
Sea, followed by 32 per cent in the southern North Sea and 28 per cent in the central 50
North Sea. Installations in the central and northern North Sea are much larger than
the installations in the southern North Sea and Irish sea, inferring that the number of
installations being removed in the southern North Sea over the next ten years is far 0
greater that those in the central and northern North Sea. 2020 2021 2022 2023 2024 2025 2026 2027 2028 2029
Source: OGUK, OGA
Well Type NNS & WoS CNS SNS & IS Total
Platform Wells 328 283 371 982 (61%)
Subsea Wells 204 303 47 554 (34%)
Suspended Exploration
and Appraisal Wells 20 29 31 80 (5%)
Total 552 615 449 1,616
18 DECOMMISSIONING INSIGHT 2020Figure 11: Topsides Decommissioning Activity in the UKCS, 2020–29 Figure 12: Substructure Decommissioning Activity in the UKCS, 2020–29
120,000 120,000
UK CNS
UK CNS
UK NNS & WoS
100,000 100,000 UK NNS & WoS
Substructures to be Decommissioned (t)
UK SNS & IS
Topsides to be Decommissioned (t)
UK SNS & IS
80,000 80,000
60,000 60,000
40,000 40,000
20,000 20,000
0 0
2020 2021 2022 2023 2024 2025 2026 2027 2028 2029 Source: OGUK, OGA 2020 2021 2022 2023 2024 2025 2026 2027 2028 2029 Source: OGA, OGUK
Total Number of Fields with Substructure Removal Activity
Number of Fields With Substructure Decommissioning Activity
Number of Topsides to be Decommissioned
Total Number of Assets with Topside Removal Activity CNS
CNS NNS & WoS
NNS & WoS
13
SNS & IS 13
SNS & IS
11
10 10 10 10 10 10 10
9 9 9
8 8 8 8 8
7 7 7 7
6 6 6 6 6 6
5 5 5
4 4 4
3 3 3 3 3 3 3 3 3 3
2 2 2 2 2 2 2 2
1 1 1 1 1 1 1 1 1 1
0 0 0 0 0 0 0 0 0
2020 2021 2022 2023 2024 2025 2026 2027 2028 2029 2020 2021 2022 2023 2024 2025 2026 2027 2028 2029
Source: OGA, OGUK Source: OGA, OGUK
DECOMMISSIONING INSIGHT 2020 195.4 Cost Performance and Benchmarking
Since 2014, Decommissioning Insight reports have included forecasts for well Figure 13: OGA 2019 P50 and Decommissioning Insight 2020 Medians
decommissioning and topsides, shown here in Figures 14 and 15. As the report focuses
on forward-looking data, these figures show how operators expect to perform in future Well Type Area Decommissioning Decommissioning OGA
decommissioning projects. Insight 2019 Insight 2020 Benchmarking
Forecast Forecast Report (P50)
Cost performance better understood — 2020 saw the first publication of the OGA’s UKCS (Median Over (Median Over 2019 Actual
Decommissioning Benchmarking Report.3 This report compiles benchmark data based on Next 10 Years) Next 10 Years) Performance
actual performance on completed projects by operators. The OGA’s report provides the
opportunity for the first time to compare actual decommissioning expenditure against Northern
forecast expenditure, as summarised in Figure 13. and Central £2.74 million £3.36 million £3.7 million
North Sea
CNS, NNS & WoS see steady cost performance — This year, for the central and northern Platform
Southern
North Sea and west of Shetland, there is a very slight increase in the anticipated costs North Sea £2.33 million £3.04 million £2.5 million
to decommission a platform well, although the average cost per well still remains below and Irish Sea
£3 million — a significant reduction from £4.28 million in 2018. The decommissioning of
subsea and suspended exploration and appraisal (E&A) wells sees the general downward Northern
trend continue. A subsea well in this region is expected to be decommissioned for just and Central £9.01 million £8.51 million £7.3 million
over £8.1 million per well and a suspended E&A well for £4.5 million. There has been North Sea
a slight increase in the expected costs per tonne for topsides decommissioning in this Subsea
Southern
region, with this year’s survey estimating £2,190 per tonne compared with £1,757 last
North Sea £4.99 million £6.28 million £5.4 million
year. The cost per tonne for substructure removal has continued to reduce and is now
and Irish Sea
expected to be £2,189 for structures removed over the next decade.
SNS and IS well costs increase, while removal costs continue to fall — In the Topsides and substructure removal projects are generally performed under the
southern North Sea and Irish Sea there has been a slight increase in expected well same contract in this region, so the costs are combined. These removals scopes have
decommissioning costs across all well types. With a platform well now expected to cost continued to decline, with the 2020 survey showing £2,020 per tonne — a significant
£2.44 million, a subsea well £6 million and a suspended E&A well £3.25 million. reduction from £3,767 per tonne in 2018.
3
https://www.ogauthority.co.uk/media/6798/oga_decommissioning_benchmarking-report-2020_spreads.pdf
20 DECOMMISSIONING INSIGHT 2020Figure 14: Historical Variation in Well Decommissioning Forecasts in the UKCS Figure 15: Historical Variation in Topsides and Substructure Forecasts in the UKCS
15 10,000
Average Forecast Well Decommissioning Costs in the Northern & Central North Sea and West of Shetland Average Forecast Topsides and Substructure Removal Costs in the Northern & Central North Sea and West of Shetland
Average = £4.59 9,000
13 Average = £2,877 Average = £2,764
Median = £3.70
Estimated Cost per Tonne (£ - 2019 Money)
Median = £3,032 Median = £2,838
Average = £8.38 Average = £5.12 Average = £4.50 8,000
Estimated Cost per Well (£ Million - 2019 Money)
Median = £9.01 Median = £5.12 Median = £3.37
11
7,000
9
6,000 Average = £2,190
Median = £2,304 Average = £2,189
Median = £2,362
7 5,000
Average = £9.52
Average = £4.28m Median = £9.15
Median = £4.28m 4,000 Average = £1,757
5 Average = £2.95 Average = £8.14 Median = £1,977
Median = £3.36 Average = £1,743
Median = £8.51
3,000 Median = £2,306
3
2,000
Average = £2.85m
1 Median = £2.74m 1,000
2018 2019 2020 2018 2019 2020 2018 2019 2020 0
-1
2018 2019 2020 2018 2019 2020
Platform Subsea E&A
Topside Substructure
Source: OGUK, OGA
Source: OGA, OGUK
10 Average Forecast Well Decommissioning Costs in the Southern North Sea and Irish Sea
22,000 Average Forecast Topsides and Substructure Removal Costs in the Southern North Sea and Irish Sea
9
Average = £2.45m
Average = £2,970
Median = £2.91m
Median = £3,298
8
17,000
7 Average = £2,020
Estimated Cost per Well (£ Million - 2019 Money)
Estimated Cost per Tonne (£ - 2019 Money)
Median = £2,568
6 Average = £2.33m
Median = £1.07m
Average = £2.44m 12,000
5
Median = £3.04m
4 Average = £6.00m
Median = £6.28m Average = £3,767
Average = £1.74m Average = £5.47m Median = £2,899
3 Median = £1.76m Median = £5.50m 7,000
2
Average = £3.25m
Median = £3.37m
1 Average = £2.28m Average = £5.42m 2,000
Median = £2.33m Median = £4.99m
0
2018 2019 2020 2018 2019 2020 2018 2019 2020 2018 2019 2020
Platform Subsea E&A
-3,000
Topside and Substructure
Source: OGA, OGUK Source: OGUK, OGA
DECOMMISSIONING INSIGHT 2020 215.5 Building on What We Have Achieved So Far…
Over the years, the UK decommissioning industry has demonstrated its capability due to its complexity and specialism. A lack of activity in the short term will have a
to conduct decommissioning workscopes more cost effectively. The OGA’s UKCS severe impact on the wells supply chain and without work, rigs and equipment are likely
Decommissioning Cost Estimate 20204 shows that forecast decommissioning expenditure to be redeployed to other regions, or scrapped, and personnel made redundant. This
has reduced on a like-for-like basis to £48.2 billion, from an initial estimate of £59.7 could cause a sharp increase in future well decommissioning costs. If some older rigs are
billion in 2017. On top of this, the maturity of estimates is improving — as shown in scrapped, there may be a lack of capability to decommission some older North Sea wells
Appendix 1 — showing greater confidence in our ability to conduct projects at these in future, with equipment on newer rigs being too heavy to attach to an older well stock.
lower costs.
Recognising the opportunities of such an approach, OGUK is working with the OGA’s
Looking to the future, industry should seek to build on what it has achieved to further MER UK Wells Task Force, Improving Partnership Group to publish a white paper on
pursue cost-effective decommissioning, explore opportunities to better collaborate, multi-operator, multi-well campaigns. The paper focuses on demonstrating the business
continue to focus on technology and seek ways to conduct activity in a safe and case, along with identifying the blockers which have prevented uptake in the past and
environmentally sustainable manner. Success in these areas will not only enable UK any associated mitigations.
decommissioning projects to be conducted effectively, but will also develop expertise
which make our decommissioning supply chain a compelling option to help other nations The OGA is also exploring all avenues to stimulate activity and encourage further
around the world. collaboration and has recently updated regulatory powers in this area. The OGA’s
Guidance for applications for suspension of inactive wells5 sets out a two-to-five-year
Operators and the supply chain: improving partnerships — One key opportunity timeframe for decommissioning suspended wells. The OGA will continue to engage with
could be the aggregation of decommissioning scopes across multiple operators into licensees to ensure robust plans are in place for wells that fall within the scope of that
decommissioning campaigns. The supply chain would benefit from increased project guidance. Introduced by The Energy Act 2016, the OGA also has as-yet unused powers to
visibility, the ability to drive schedules, better asset utilisation and improved continuity require collaboration between operators to reduce decommissioning costs.
of work increasing profitability and retaining personnel and equipment in the region.
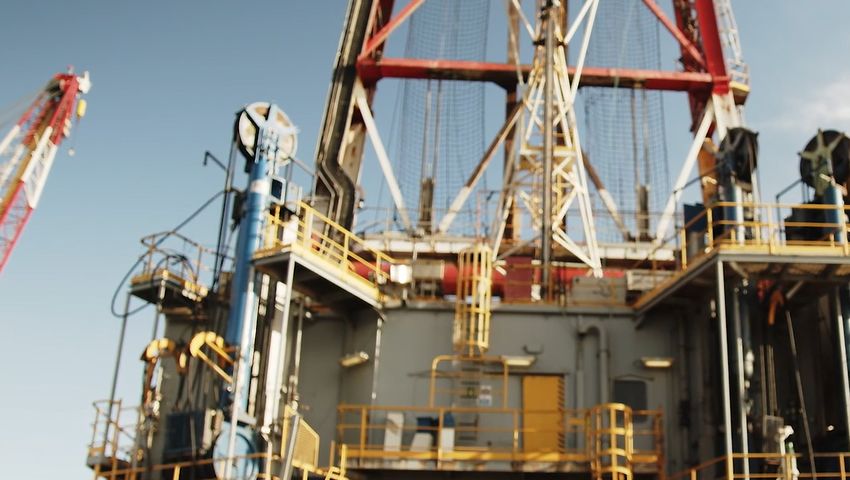
Subsea wells in particular may offer opportunities for multi-operator, multi-well
Well decommissioning activity — Well decommissioning accounts for around 49 per campaigns. Figure 16 shows the number of subsea wells to be decommissioned in each
cent of UKCS decommissioning expenditure over the next decade. This high percentage area of the North Sea and the number of operators present in the dataset, highlighting
is due to a large quantity of activity in the shorter term compared to other areas of the potential. A campaign-led approach should not be solely restricted to well
the Decommissioning WBS. Well decommissioning activity is undertaken early in decommissioning, but as a large proportion of expenditure, enabling success in this area
the process and is generally a high-cost element in any decommissioning project could lead the way for others.
4
https://www.ogauthority.co.uk/media/6638/ukcs-decommissioning-cost-estimate-2020.pdf 5
https://www.ogauthority.co.uk/media/5108/oga-suspended-wells-guidance.pdf
22 DECOMMISSIONING INSIGHT 2020Figure 16: North Sea Subsea Well Decommissioning by Region and Number of Operators
Subsea well decommissioning in the CNS
SubseaSubsea Well Decommissioning
well decommissioning in the NNS & WoS Subsea Well Decommissioning Subsea Well Decommissioning
in the NNS & WoS in the CNS Subsea well in the SNS andinISthe SNS and IS
decommissioning
90 90 90
3 Operators
Decommissioning campaigns can:
6 Operators
80 80 80
£ Increase cost effectiveness
70 70 70
Maintain and attract high-skilled jobs
7 Operators
60 60 60 Further strengthen exportable
8 Operators
4 Operators
expertise
50
4 Operators
50 50 CO2 Reduce emissions and improve safety
4 Operators
3 Operators
4 Operators
4 Operators
Provide technology focus
5 Operators
40 40 40
5 Operators
3 Operators
3 Operators
30 30 30
2 Operators
2 Operators
1 Operator
4 Operators
2 Operators
7 Operators
1 Operator
3 Operators
3 Operatosr
4 Operators
1 Operator
1 Operator
1 Operator
20 20 20
10 10 10
0 0 0
2020 2021 2022 2023 2024 2025 2026 2027 2028 2029 2020 2021 2022 2023 2024 2025 2026 2027 2028 2029 2020 2021 2022 2023 2024 2025 2026 2027 2028 2029
Source: OGA, OGUK
DECOMMISSIONING INSIGHT 2020 236. Decommissioning in the Wider North Sea
North Sea well activity down in 2020 — Figure 17 shows that the impacts of COVID and
the commodity price fluctuations have been felt by the well decommissioning supply Survey methodology
chain across the North Sea, with only 164 wells slated to be decommissioned across For the sixth year, data have also been contributed by other offshore oil and gas
the four countries’ portfolio of work. Well activity is then due to pick up in 2021 and producing countries around the North Sea, specifically the Netherlands, Norway,
fluctuate between 215 and 280 wells per year across the North Sea to 2026. The majority and Denmark. Four key operators provided data from Norway, 11 from the
of well decommissioning activity happens in the UK, where 1,616 wells are slated to be Netherlands, and three from Denmark. Data from the Netherlands came from
decommissioned over the next decade. In general terms, there has not been any rush Nexstep, a joint initiative of Energie Beheer Nederland (EBN) and the Dutch oil
to decommission in other areas of the North Sea. This is particularly notable in Norway, and gas industry, represented by NOGEPA. OGUK also collated data directly from
which sees a significant reduction in well decommissioning activity when compared with operators in Norway and Denmark. The co-operation of all operators, industry and
Decommissioning Insight 2019, with much activity moved into the future. Last year’s regulators is greatly appreciated.
report stated that around 417 wells would be decommissioned over the next decade,
whereas this year’s forecast is around 250.
Substructure removals activity sees steady work profile — There is a steady stream of
Over 900,000 tonnes of topsides to be removed — 900,103 tonnes of topsides are to substructure removal activity over the next five years to 2024, with between 30,000–
be removed from the North Sea over the next ten years — a reduction on the 1.2 million 40,000 tonnes removed each year. The data then show a large rise in the forecast
tonnes reported in Decommissioning Insight 2019. This is due to the number of removals substructure removals activity across all areas, but perhaps most prominently in the
projects completed in 2019, and some larger removals scopes being pushed out beyond Netherlands, where mass increases from just under 8,000 tonnes in 2025 to above
the end of the ten-year window. 60,000 tonnes in 2026. Denmark sees some removals activity commencing in 2026 and
continuing towards the end of the ten-year window of activity considered in this report.
24 DECOMMISSIONING INSIGHT 2020Figure 17: Well Decommissioning Activity Figure 18: Topsides Decommissioning Activity Figure 19: Substructure Decommissioning Activity
in the North Sea, 2020–29 in the North Sea, 2020–29 in the North Sea, 2020–29
160,000 180,000
UK
UK UK
400 Norway
Norway
Norway 140,000 160,000
The Netherlands
The Netherlands
Number of Wells to be Decommissioned
350 The Netherlands Denmark
140,000 Denmark
Denmark 120,000
Substructures to be Decommissioned (t)
Topsides to be Decommissioned (t)
300
120,000
100,000
250
100,000
80,000
200
80,000
60,000
150 60,000
40,000
100 40,000
50 20,000 20,000
0 0 0
2020 2021 2022 2023 2024 2025 2026 2027 2028 2029 2020 2021 2022 2023 2024 2025 2026 2027 2028 2029 2020 2021 2022 2023 2024 2025 2026 2027 2028 2029
Source: OGUK, OGA & Nexstep
Source: OGUK, OGA and Nexstep Source: OGUK, OGA and Nexstep
Country Number of Wells Percentage Country Topsides Mass (t) Percentage Country Substructure Mass (t) Percentage
UK 1,616 66% UK 658,230 73% UK 372,439 53%
The Netherlands 478 20% The Netherlands 131,782 15% The Netherlands 184,429 26%
Norway 250 9% Norway 77,481 9% Norway 107,918 15%
Denmark 92 4% Denmark 32,610 4% Denmark 40,214 6%
TOTAL 2,436 100%* TOTAL 900,103 100%* TOTAL 705,000 100%*
*May not add to 100% due to rounding *May not add to 100% due to rounding *May not add to 100% due to rounding
DECOMMISSIONING INSIGHT 2020 257. Decommissioning in the Energy Transition
The offshore oil and gas industry is becoming more integrated with the wider energy Re-purposing of offshore assets — As well as opportunities to re-use offshore
sector, and a variety of projects are ongoing around the UK ranging from the production infrastructure for the purposes of oil and gas, there are also opportunities to re-purpose
of green and blue hydrogen, to platform electrification and Carbon Capture Utilisation infrastructure for use in industry such as CCUS, hydrogen production and offshore wind.
and Storage (see Figure 20). In the future, contracts will be won based on sustainability The recently published OGA UKCS Energy Integration Report 6 stated that re-purposing
performance as well as conventional performance indicators such as safety and cost. an oil or gas pipeline for CCUS results in 20–30 per cent savings for a CCUS project
Decommissioning has a major role to play in this transition, with particular opportunities — demonstrating that using existing infrastructure could be a key enabler for these
in the following areas: projects. Equally, the re-focusing of skills and expertise present in the oil industry will be
essential for success in energy transition projects.
Further improvements in the efficiency of the decommissioning process —
Decommissioning can be an energy-intensive exercise and the use of vessels and rigs A push towards an “Integrated Energy Sector” — Oil and gas will continue to be required
contributes to the industry’s carbon footprint. Improvements in the efficiency of scope as we transition towards a lower-carbon future. Integrating our energy resources, for
can reduce the amount of time a vessel or rig spends on site and help lower emissions, example by electrifying a portion of the UK’s offshore assets, could result in significant
as can improvements in the overall energy efficiency of these vessels. Cost-effective emissions reductions, while supporting jobs, extending the life of our assets and
decommissioning can also unlock opportunities, as decommissioning for less than delivering UK oil and gas demand from domestic supply. The skills, infrastructure and
expected can free up capital for investment in emissions reduction initiatives as well as resources present in the oil and gas industry will play a major role in the UK's ambition
future oil and gas projects. to reduce emissions.
Supporting the circular economy — Re-use of assets or their component parts is
already occurring throughout our industry. There are many examples of success in this
area, with high-value components such as valves and turbines finding new homes, to
entire topsides or FPSOs finding new life being repurposed in new projects (see case
study overleaf).
6
https://www.ogauthority.co.uk/media/6625/ukcs_energy_integration_phase-ii_report_website-version-final.pdf
26 DECOMMISSIONING INSIGHT 2020Figure 20: UK Projects Supporting the Energy Transition
Shetland Energy Hub
• Purpose: Demonstrating complimentary
technologies for decarbonising oil and gas
Acorn Project production and producing clean H2.
• Purpose: A CCS hub with hydrogen • Re-use: Opportunities for platforms,
production capacity that integrates onshore pipelines and other offshore infrastructure
with CCS in Grangemouth through onshore
St Fergus Gas • Key players: Shetland Islands Council and the
pipeline. International CO2 storage potential
Terminal OGTC
from imports. Platform Electrification
• Outcomes: 8Mt CO2 abatement by 2050*,
• Re-use: Goldeneye pipeline, Atlantic pipeline Peterhead Port • Purpose: To decarbonise oil and gas
1750 local jobs
• Key players: Pale Blue Dot Energy, UK and operations in the North Sea
Scottish Government, the EU, and key • Re-use: Opportunities for platforms,
industry partners (Chrysaor, Shell, Total) Aberdeen ETZ cables and other offshore
• Outcomes: 5.0 Mt CO2 per year, 9.2TWh H2 • Purpose: Create global integrated energy cluster that will infrastructure
per year by 2030 accelerate the delivery of net zero solutions and secure an • Key players: Various operators, BEIS,
inclusive, strong economic future for the community OGA, Ofgem
HyNet Grangemouth • Key Players: Opportunity North East, Aberdeen City Council • Outcomes: Up to 6Mt reduction in
• Purpose: Bringing CCS to the GHG emissions by 2030
Merseyside industrial cluster and
supplying the wider region with Net-Zero Teesside
Dolphyn
hydrogen. • Purpose: Decarbonising a cluster of
• Purpose: Bringing the latest
• Re-use: Liverpool Bay oil and gas carbon-intensive businesses by 2030 and
floating wind and green
fields and related infrastructure. deliver a zero-carbon industrial cluster.
Middlesbrough hydrogen production
• Key players: Cadent, Essar, ENI. • Key Players: BP, Eni, Equinor, Shell and technologies together to enable
Total. offshore wind resources to
• Outcomes: 1.0 Mt CO2 per year Hull
• Outcomes: 6.0 Mt CO2 per year by 2030, contribute toward hydrogen
by 2030, 18TWh H2 by 2030
6.4TWh of H2 capacity by 2030 production
Manchester
• Key players: ERM
South Wales Industrial Cluster Liverpool • Outcomes: 0.03TWh H2 by 2030
• Purpose: To develop a world leading
decarbonised industrial cluster with CCS and
hydrogen production. Zero Carbon Humber Key:
• Re-use: Liverpool Bay oil and gas fields and • Purpose: A partnership to build a zero-
CCS Project
related infrastructure. Swansea carbon industrial cluster to decarbonise the
North of England. Blue Hydrogen
• Key players: Costain, RWE, Progressive Energy,
USW, Celsa Manufacturing, Tata Steel, the Port of • Key players: Drax, Equinor, National Grid,
Offshore wind
Milford Haven, and Vale Europe. Catch, Humber LEP
Potential ETZ region
• Outcomes: 17.0 Mt CO2 per year by 2040* • Outcomes: 8.0 Mt CO2 per year by 2035,
Gigagstack H2 project: 24TWh of H2 by 2030, CO2 Imports
Saltend: 13TWh of H2 by 2030
*2030 targets not published Green Hydrogen
Source: EY, OGUK
DECOMMISSIONING INSIGHT 2020 277. Decommissioning in the Energy Transition continued
The Wintershall Noordzee Sillimanite Field: A Sustainable Re-use Development
The unitised Sillimanite gas field stretches across the UK and the Dutch continental shelves in Licence Block 44/19a
on the UK side and blocks D12a/b on the Dutch side. In the concept select phase the internal re-use of the E18-A
gas platform, in Dutch waters, was selected to be most beneficial since it accelerated first gas and offered synergies
with the planned decommissioning scope. It should be highlighted that this is the second re-use for this topside.
During project execution in 2019, the choice for re-use meant that very close coordination was required
between the various project milestones and operations, including: platform removal and installation; necessary
process facility modifications; pipeline installation; subsea preparations; and the subsequent drilling operations.
A highlight in the decommissioning scope was the decision to execute part of the preparational work (e.g.
pre-cutting of legs) with the well decommissioning rig onsite, reducing expensive heavy lift vessel days.
Meanwhile, D12-B produces with three wells, all safely delivered in time under COVID-19 circumstances, which
makes this project even more unique and one that Wintershall Noordzee is very proud of.
28 DECOMMISSIONING INSIGHT 2020You can also read