Dedicated to pets because we care - zooplus AG First Virtual Capital Markets Day | November 17, 2020
←
→
Page content transcription
If your browser does not render page correctly, please read the page content below
Dedicated to pets
… because we care
zooplus AG
First Virtual Capital Markets Day | November 17, 2020
SAFE HARBOR STATEMENT

This document includes supplemental financial measures that are or may be non-GAAP financial measures. These supplemental financial
measures should not be viewed in isolation as alternatives to measures of zooplus’ financial condition, results of operations or cash flows
as presented in accordance with IFRS in its Consolidated Financial Statements. Other companies that report or describe similarly titled
financial measures may calculate them differently.

This document contains statements related to our future business and financial performance and future events or developments involving
zooplus that may constitute forward-looking statements. We may also make forward-looking statements in other reports, in presentations,
in material delivered to stockholders and in press releases. In addition, our representatives may from time to time make oral forward-
looking statements. Such statements are based on the current expectations and certain assumptions of zooplus’ management, and are,
therefore, subject to certain risks and uncertainties. A variety of factors, many of which are beyond zooplus’ control, affect zooplus’
operations, performance, business strategy and results and could cause the actual results, performance or achievements of zooplus to be
materially different from any future results, performance or achievements that may be expressed or implied by such forward-looking
statements or anticipated based on historical trends. Further information about risks and uncertainties affecting zooplus is included
throughout our most recent annual and interim reports, which are available on the zooplus website, www.zooplus.de. Should one or more
of these risks or uncertainties materialize, or should underlying assumptions prove incorrect, actual results, performance or achievements
of zooplus may vary materially from those described in the relevant forward-looking statement as being expected, anticipated, intended,
planned, believed, sought, estimated or projected. zooplus neither intends, nor assumes any obligation, to update or revise these forward-
looking statements in light of developments which differ from those anticipated.

Due to rounding, numbers presented throughout this and other documents may not add up precisely to the totals provided and
percentages may not precisely reflect the absolute figures.

                                                                                                                                              2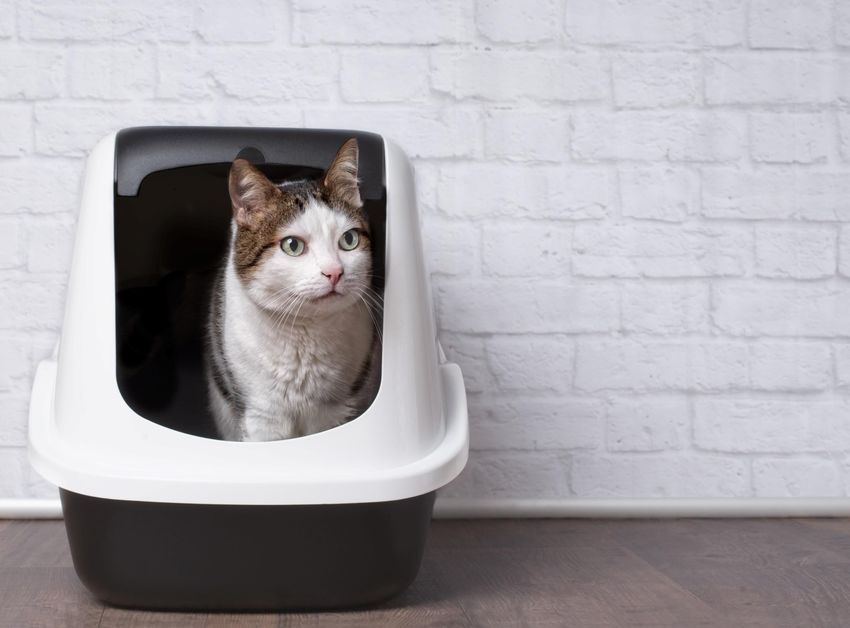
PART I
AGENDA 10:00 am CET – 10:30 am CET
Latest financials & business performance Q3 & 9M 2020
Q&A Session
short break
PART II
10:40 am CET – 01:00 pm CET
Update on strategy and overall business performance
Outlook 2021
Q&A Session
SPEAKERS   Dr. Cornelius Patt, CEO
           Co-Founder of zooplus & CEO
           Business units: Sales, Business Development, IT, HR

           Andreas Maueröder, CFO
           CFO, Member of the Board since 2020, joined in 2010
           Business units: Finance, Legal & Vendor Management

           Dr. Mischa Ritter, COO
           COO, Member of the Board since 2018, joined in 2012
           Business units: Logistics, Operations, Own Brands
PART I

         Q3 & 9M 2020 Financials
KEY FINANCIAL HIGHLIGHTS – STRONGEST GROWTH PERFORMANCE
IN COMPANY HISTORY & RECORD OPERATING PROFITABILITY

SALES (in m EUR)                                                           EBITDA (in m EUR, in % of sales)
                                             +18%                                0.0%            0.6%          3.7%
                   +13%                                   1,299
                                                                  +195                                         47,8
                                1,104                              m EUR
        974                              +130
                                          m EUR

                                                                                                 6,7
                                                                                 -0,5
     9M 2018                  9M 2019                    9M 2020               9M 2018         9M 2019        9M 2020

                                              +16%
                   +14%                                                          1.4%            0.6%          4.2%
                                                           436
                                 378                               +59                                          18,4
        331                               +47                      m EUR
                                          m EUR

                                                                                 4,5
                                                                                                 2,2

     Q3 2018                  Q3 2019                    Q3 2020               Q3 2018         Q3 2019        Q3 2020

  New Customer Sales      Existing Customer Sales    %    EBITDA margin
                                                                                                                        6
SUSTAINABLE GROWTH DRIVEN BY RECURRING SALES &
HEALTHY NEW BUSINESS

                 #stayhome extra sales                                                  Re-acceleration of q-o-q           Q4 2020 expected to
                    boost driven by                                                      performance driven by             reach an annual run-
                temporary spike in order                                               increased average basket             rate of ~2 bn EUR
                        volume                                                             size and frequency
                                                                                                                                            490

                            440                                                                      436                             419    +70
                                                                 423
                                                                                                                                           m EUR

                            +77                                                               378    +59                      368
                     363                                  363    +60
                            m EUR                                                                    m EUR
              323                                  320           m EUR                 331                           316
                                                                                278
       257                                  260                                                                253
                                      221                                227
208

2016   2017   2018   2019   2020     2016   2017   2018   2019   2020    2016   2017   2018   2019   2020     2016   2017    2018   2019 2020e

              Q1                                   Q2                                  Q3                                    Q4
                                                                                                                                                   7
KEY OPERATIONAL HIGHLIGHTS – SOLID EXECUTION IN 9M 2020
BUSINESS HAS IMPROVED ACROSS ALL MAJOR KPI
9M 2018 9M 2019 9M 2020
Revenue Retention Rate1 95% 91% 97% Revenue retention rate increases
to historical high of 97% end of
New Customer 2nd Order Sales +16% -6% +17% September 2020
Sustainable topline performance
Customer Acquisition Cost (in €) 9 15 9 through improved early-stage
loyalty
Own Brands Share2 14% 16% 18% More efficient acquisition
strategy improving CAC
Gross Margin (% of Sales) 28.0% 28.5% 30.5% Own Brands share increase
creates higher leverage for gross
Basket Size (in €) 54 55 57 margin steering
Basket size is valuable efficiency
Operational Efficiency3 driver offsetting logistics cost per
21.7% 21.0% 20.8%
(in % of Sales) parcel
1) Revenue retention calculated as of 12 months rolling (net, non-BMF)
2) Share of total food and litter sales
3) Logistics costs + payment costs + customer care costs 8
REVENUE RETENTION RATE CLIMBS TO A NEW
ALL-TIME HIGH OF 97% IN Q3’20 – INVESTMENTS INTO LOYALTY ARE PAYING OFF
REVENUE RETENTION RATE1 (in % of sales)
Maintained 97% of revenue on average
97% of all customers acquired
12 months prior to end of Q3 2020
Only ~3%
Revenue retention rate reaches highest
revenue
95% loss vs. value ever in 20-year company history
previous
94% period
with a record high 98% as end of
October 2020
93%
Better customer lifecycle-management
92% of newer cohort increasing early-stage
loyalty:
91% 91%
Higher activation in early-stage
cohorts
Higher basket size vs. early-stage in
older cohorts
Stronger push for loyalty tools with
Q1 2019 Q2 2019 Q3 2019 Q4 2019 Q1 2020 Q2 2020 Q3 2020 first transaction (Subscribe & Save,
Bonus Points)
1) Revenue retention calculated as of 12 months rolling (net, non-BMF)
9
GROWTH STRATEGY – FOCUS ON ACTIVE REPEAT CUSTOMERS
AND SALES PER ACCOUNT
ACTIVE CUSTOMER BASE (in k) ACTIVE REPEAT CUSTOMER BASE (in k)
+9% +15%
8,094 4,888
7,429 4,234
255 EUR 379 EUR
233 EUR per account1 364 EUR per account1
per account1 per account1
Sep 30, 2019 Sep 30, 2020 Sep 30, 2019 Sep 30, 2020
Customers with at least one order in the last 12 months Customers with at least two orders in the last 12 months
Reduced intake of low-quality new accounts in 2020, Adjusting for one-time purchasers in the last 12 months,
correcting the 2019 marketing campaign issues counting only customers with inclination for repurchases
By far largest active customer base in European peer Y-o-Y increase in revenue per active account underlines
group comparison further monetization potential from loyal customer base
More suitable indicator for the company's future topline
growth
1) Average gross revenue per customer in the last 12 months
10GROSS MARGIN UPLIFT THROUGH OPTIMIZED STEERING OF
PRODUCT SALES MIX
GROSS MARGIN1 (in %)
30.5%
Optimized steering of product sales
mix enabled gross margin
+2.0%p improvements which were not at the
vs. PY expense of our customers
Significantly reduced share of loss-
making orders through dedicated yield
28.5% management
28.0% Increased own brands share on food
also contributed to gross margin
improvement
Surge in accessories demand with
additional positive effect on gross
margin
9M 2018 9M 2019 9M 2020
1) Gross margin = sales – cost of goods sold (as % of sales)
11STRONG INCREASE IN BASKET VALUE – MAIN DRIVER FOR
LOGISTICS EFFICIENCY
AVERAGE BASKET VALUE (NON-BMF; in EUR)
57.2
Increasing basket value is our
strategic driver for additional revenue
+2.4 EUR at high margins
vs. PY
The average cost of fulfillment for the
54.8 average basket value is fully variable
54.5 and around 20% of total logistics costs
(excluding inbound, packaging and
last-mile cost)
However, the logistics costs of any
additional Euro to the current average
basket size drop to one-third of the
average logistics cost
9M 2018 9M 2019 9M 2020
Based on order date
12COST EFFICIENT OPERATIONS CREATING MOAT
FOR ONLINE AND OFFLINE COMPETITORS
COST STRUCTURE (in % of SALES)
28.2% 27.1% Strong efficiency in customer acquisition
and reduced marketing spend also
reflecting budget shift into early-stage
Ad./Marketing 3.3 % loyalty spend (included in gross margin)
1.6 %
Larger baskets prompting for higher value
per parcel, offsetting additional cost for
higher FC capacity & fully offsetting
Logistics 18.3 % 18.1 % additional logistics cost related to protective
Covid-19 measures
Payment1 Increase in IT / Admin / FX cost base
1.1 % 1.1 %
reflecting higher non-operating expenses
for strategic projects
IT / Admin / FX 2.0 % 2.6 %
Personnel expenses including one-off
Personnel2 3.5 % 3.7 %
costs related to changes in organizational
9M 2019 9M 2020 structure and performance remuneration
1) Impairment expenses on financial assets reclassified to payment
2) Including LTI & SOP; own work capitalized reclassified to personnel 13STRONG FREE CASH FLOW GENERATION ENABLES US TO
CONTINUE OUR GROWTH PATH
FREE CASH FLOW GENERATION 9M 2020 (in m EUR)
Strong cash flow and EBITDA
56 53 48 performance in 9M 2020
-3 Free cash flow stands at 110% of
EBITDA level
Limited CAPEX requirements for
the business
+43 Strong free cash flow generation
m EUR enables zooplus to finance further
vs. PY
growth while continuing to invest
into customer proposition and digital
experience
Cash flow from Cash flow from Free cash flow EBITDA
operating activities investing activities
14WORKING CAPITAL INTENSITY CONTINUOSLY REDUCED
MORE THAN OFFSETTING THE GROWTH IMPACT
SOLID PROGRESS IN WORKING CAPITAL
~25d
Further optimization in working
~21d capital (main driver: increase in
payment days on procurement side)
~17d supporting financial flexibility
~15d In 2015, zooplus generated 711 m
~12d EUR in sales having an average
10.4% ~10d working capital of 74 m EUR
8.7% As of September 2020 (based on
7.1% LTM), zooplus generated sales of
4.7% 1,718 m EUR with an average
3.6% 3.1% working capital of 53 m EUR
We combined a sales growth of 1 bn
2015 2016 2017 2018 2019 09/2020 EUR with a reduction in Working
Working Capital in % of sales Payment days of goods suppliers Capital by more than 20 m EUR
Working Capital = Inventory + prepayments + receivables (trade receivables + supplier receivables) – payables
15COVID-19 AND PET SUPPLIES CATEGORY IN EUROPE RESULT IN
TACTICAL IMPACT ON BUSINESS
Consumption patterns remained unchanged
in our category
OPEN
Offliners were classified as essential and did
not go out of business
Served as a push for first-time e-commerce
usage in our category in some regions
Organic Traffic
Helped us temporarily reduce our ad spend Paid Traffic
without losing reach
16FULLY ON TRACK TO ACHIEVE 2020 FINANCIAL TARGETS –
FINANCIAL GUIDANCE CONSECUTIVELY INCREASED
SALES GUIDANCE 2020e (in m EUR) EBITDA GUIDANCE 2020e (in m EUR)
+16% +16-19%
50-65
1,770-1,810
~1,765
At least 40
+266
+240 m EUR
vs. PY
m EUR
vs. PY
2020e 2020e 2020e 2020e
July 14, 2020 October 15, 2020 July 14, 2020 October 15, 2020
Guidance March 25, 2020: Sales growth of at least 180 m EUR (total: at least 1,704 m EUR) EBITDA below prior year’s level, but in positive to neutral vs. PY
17Q&A
Live
Session
Please post your questions in the chat
window under the video panel of this
webcastPART I
AGENDA 10:00 am CET – 10:30 am CET
Latest financials & business performance Q3 & 9M 2020
Q&A Session
short break
PART II
10:40 am CET – 01:00 pm CET
Update on strategy and overall business performance
Outlook 2021
Q&A SessionZOOPLUS AG: THE DEDICATED PET SPECIALIST –
REASONS TO INVEST IN ZOOPLUS AG
Continued & recurring nature of demand of pet food & supplies - resilient category
Recurring
Subscription-like business model with >90% recurring sales
revenue model
Locked-in customer sales through customer satisfaction
Unique loyalty enhancing digital products such as subscribe & save
Deep bonds with
Highly loyal and growing returning customer base
customers Best-in-class data & category-driven customer proposition and e-shopping experience
Market Market opportunity of net 26 bn EUR growing at ~4% p.a.
opportunity in Dominant competitive position & by far largest player in e-commerce vertical
Europe Continue to add share from offline business on the back of general trend in grocery towards e-commerce
zooplus consistently performing amid challenging circumstances
Operational Operational excellence driven by intelligent pricing, cost efficient marketing, excellent collaboration
excellence & with partners
efficiency Scalable logistics efficiency and continued operational improvements supported by category know-
how and data-driven approach
Recurring revenues with customers & tailored loyalty tools deepen the bond with our customers
Strategic brand
and open new ways to up- and cross sell our high-margin premium, longtail accessories brands, and
and product own brands
portfolio mgmt Own brands within mid- to super-premium segment with strong stand-alone retail capacity & ideally
tailored for e-commerce distribution
20PART II
Recurring Revenue ModelSTRONG RECURRING REVENUES IS THE WINNING FORMULA FOR
SUSTAINABLE GROWTH
SALES (in m EUR) 1,790
266 135
+17%
181 1,524 170
1,485
+13% 155
1,342 39 (2%)
232
+21% 143 146
1,111 150 120 (9%)
131 RR 98%
63 (5.7%)
140 >90%
RR 91% Recurring
1,485
revenue
RR 94.3% 1,223
1,048
840
2017 2018 2019 2020e
First transaction revenue Consecutive transaction revenue Recurring revenue Revenue churn
RR = Revenue retention (net, BMF)
Total new revenue: 2017: 271 m EUR, 2018: 293 m EUR; 2019: 301 m EUR; 2020e: 305 m EUR 22REVENUE RETENTION ABOVE 90% FOR ALL COHORTS – MORE
MATURE COHORTS AT 100% OR ABOVE
SALES (in m EUR) 98%
1,790
91%
305m
305 2020 cohort
94%3 1,524
1,342 301m
301 91% 273m
273 2019 cohort
93%
293m
293
1,111 85%
91%
92%1 249m
249 227m
227 2018 cohort
909 271m
271 94%
254m
254
94% 84% 214m
214 98% 210m
210 2017 cohort
711 253m
253 86%
91% 217m
217 87% 189m
189 92% 100% 174m
174 2016 cohort
173m
173
85% 544 202m
202 83% 167m
167 86% 144m
144 94% 136m
136 94% 128m
128 101% 129m
129 2015 cohort
408 174m
174 83% 145m
145 88% 127m
127 94% 119m
119 96% 115m
115 96% 110m
110 102% 111m
111 2014 cohort
320 135m
135 78% 105m
105 90% 95m
95 96% 91m
91 97% 88m
88 98% 87m
87 97% 84m
84 103% 86m
86 2013 cohort
125m
125 70% 87m
87 99% 78m
78 99% 77m
77 99% 77m
77 99% 76
76m 98% 75m
75 103% 77m
77 2012 cohort
91% 79m
79
95% 100% 103% 101% 100% 99% 99% 103%
194m
194 185m
185 185m
185 191m
191 193m
193 194m
194 193m
193 190m
190 197m
197 2001-2011 cohort
0.77 101%
0.77 99%
0.76 104%
0.79 106%
0.84 99%
0.83 96%
0.79 102%
0.81 104%
0.84 2000 cohort
2012 2013 2014 2015 2016 2017 2018 2019 2020e
Sales 2000: 2.2 m EUR
In local currencies: 1) 94% 2) 95% 23REVENUE RETENTION RATE HAS RECOVERED AND IS HEADING
TOWARDS THE 100% MARK
REVENUE RETENTION (in % of sales)
Confirmed success
of focus on loyalty 98.1%
96.8%
Covid-19 96.4%
peak
95.2% 95.1% 95.1% 95.4%
95.1%
94.7% 94.6%
94.1% 94.2%94.2% 94.3%
93.4%
92.8% 92.8%
92.2%
91.4% 91.8%
91.5% 91.2%
91.1% 90.9% 91.0% 91.1%
Sep Oct Nov Dec Jan Feb Mar Apr May Jun Jul Aug Sep Oct Nov Dec Jan Feb Mar Apr May Jun Jul Aug Sep Oct
2018 2019 2020
Revenue retention calculated as of 12 months rolling (net, non-BMF)
24SALES PER ACCOUNT WITH SHARP INCREASE ACROSS
ALL CUSTOMER LIFECYCLE STAGES IN 2020
SALES PER ACCOUNT OF ACTIVE REPEAT CUSTOMERS
379 EUR Sales per account increased from
361 EUR (Jan 2019) to 379 EUR
(Oct 2020)
2019 with clear sideways
movement
371 EUR
March 2020 shows a distinct
Covid-19 peak due to stockpiling
April / May 2020 rebalancing (of
stockpiling)
361 EUR
Fundamental upwards trend in
sales per account resumes in June
2020
Sales per active repeat account
increased by 4%
Jan 2019 Feb 2020 Oct 2020
Note: active repeat customers = at least 2 orders within last 12 months
25THE POWER OF RETENTION: A 98% VS. 91% RETENTION RATE CAN
CREATE SIGNIFICANTLY HIGHER CUMULATED RECURRING SALES
SIMULATION OF SALES WITH DIFFERENT REVENUE RETENTION RATES
Starting from 2020 with sales of
+140% 1.79 bn EUR as base year
98% RR Simulation of revenue contribution
to recurring revenue base until 2030
with revenue retention level 2019
(91%) and revenue retention level
1.79 bn EUR October 2020 (98%)
+55%
Simulation calculated with a steady
91% RR new cohort growth of 300 m EUR in
both scenarios
Simulated revenue figures 2030:
98% RR: 4.3 bn EUR
91% RR: 2.8 bn EUR
2020 2021 2022 2023 2024 2025 2026 2027 2028 2029 2030
Note: 2030 figure projections are based on simulation at time of Q3 2020 results publication and are not part of Group guidance
26PART II
Deep Bonds with CustomersCUSTOMER INSIGHTS: MOST OF OUR CUSTOMERS ARE WOMEN
WITH CATS OR DOGS
Gender Age
77% 26% 25%
21%
18%
10%
23%
Female Male 18-29 30-39 40-49 50-59 >60
4.9m active repeat customers across Europe
Residence Pet types
36% 70%
33%
31%
52%
16%
10% 8%
City / Suburb / Country Cats Dogs Fish Small Other
Large Town Small Town animals
Source: Persona Survey 2020; Overall n = 15633; Demographic data based on customers from following country markets: Germany, France, Italy, The Netherlands, UK, Spain, Belgium, Switzerland and Poland
Source:repeat
Active Persona Survey 2020;
customer baseOverall n =2020
as of Q3 15633; 28Device usage Channel usage z+ purchase profile Favorite brands
High regularity
shoppers
HQ Brand
2 1 3 Loyalists 2 1 3
Pet profile
Personality traits Interests
Animals Name: Charly
Anna Secure
Trusting
Insecure
Skeptical Parenting * Adopted
The dedicated pet parent Open-minded
Disciplined
Narrow-minded
Indisciplined Gardening Age: 8 years old
Age: 42 Individualistic Group-oriented Home decoration
Family status: married,
2 children, 4 pets Name: Emma
Living area: Country Breed: Golden
Occupation: Part-time job, Retriever
kindergarten teacher Purchase behavior Relevant products Age: 3 years old
Weight: 32 kg
She is a family-oriented person
Pet Food
who values quality and is loyal
to known brands. Mainly Snacks
buying from their trusted
(online) shops, once every 3-4 Litter & Hay Name: Paul & Luna
weeks. Trust is very important Loyalty strength Age: Both 2 years old
Accessories
for her as well as an
understandable order process Pharmaceuticals
since she is not a digital native. Low High
Source: Persona Survey 2020, N = 15633, 9 Countries / Social Media Analysis January 01, .2019 – April 30, 2020 / Internal DataTHREE FLAGSHIP LOYALTY TOOLS DRIVE OUR GROWTH STORY
Subscribe & Save Bonus Point Rewards Mobile Apps
Subscribe & Save Bonus Points
Membership Rewards
Get 3% off every order for a Gather Bonus Points with
whole year each purchase
one-time membership fee one € = one bonus point
Keeping customers engaged
Locking in customers through Rewarding customers for
through personalized digital
a permanent discount their loyalty
experience
30ALL THREE LOYALTY TOOLS ARE IMPACTFUL WITH THE CUSTOMER
AND STRONG IN REACH
Subscribe & Save Bonus Point Rewards Mobile Apps
50%
of total zooplus sales
generated by customers
70%
bonus Points
on Subscribe & Save Rewards usage in
active repeat
17%
63€
revenue of all Group orders
customer base
growth within: come via our mobile apps
average for zooplus and bitiba
basket
Subscribe & Save 24%
value of
customers
other customers 16%
+80%
Subscribe & Save members bonus Points
[~20% higher than average basket of redeemed in reward
non-members]
>40%
shop or donated to
charity per month by
4.9
out of 5
>20% higher sales
per account1
all customers stars rating
for our apps
higher
frequency1
1) Based on 2015 acquired cohort for Subscribe & Save customers vs. non-Subscribe & Save customers
31WE ARE THE LEADING PLAYER IN OUR VERTICAL AND OFFER
THE BEST DIGITAL EXPERIENCE FOR PET PARENTS IN EUROPE
SHOP APPS
Award-winning pet shop 17% order share
~ 6.5m unique visits / month ~ 1 million active users
→ +20% vs. 9M 2019
>120k downloads per month
~100k transactions per day
4.9/5 rating (iOS + Android)
>1m items sold per day
MAGAZINE & COMMUNICATION SERVICES & COMMUNITY
Curated expert articles on current Intense engagement in social
topics media and forum
Traffic generation and customer User product ratings
acquisition at no additional cost Vet search with profiles and ratings
~ 3.9m visits per month Pet shelter search
~ 6k published articles in 20 countries
32PART II
Market Opportunity in EuropePET SUPPLIES IS A CONSISTENTLY GROWING MARKET AND
OFFERS SIGNIFICANT COMMERCIAL OPPORTUNITIES
Net Market opportunity Europe
(in bn EUR)
DIGITAL SHIFT
SPECIALIZED NUTRITION CAGR 4% Category is still underrepresented in
Premiumization trend in pet food online channels with shift of
30.6
driving specialty trade to grow 26.3 consumers to online still ongoing
24.5
faster than grocery segment
GROWING PET POPULATION
HUMANIZATION OF PETS 71m dogs (+16% vs. 2010) and
Pets are increasingly viewed as 2018 2020e 2024e 84m cats (+25% vs. 2010)
a family member with spend
per pet increasing
Source: FEDIAF 2020, FEDIAF 2010, Gross numbers by Euromonitor VAT-adjusted by zooplus management as of October 2020
Note: Russia and Ukraine excluded 34WE ARE DIGITIZING THE CATEGORY – STILL MASSIVE FUTURE
GROWTH OPPORTUNITY FOR THE LEADING VERTICAL IN EUROPE
EUROPE USA
No. dogs 71m1 No. dogs 94m5
Number of pets
No. cats 84m1 No. cats 90m5
2020 €26.3bn2 2020 $58.8bn6
Pet supplies market
2019 €25.3bn2 2019 $54.6bn6
Pet supplies market 2020 17%3 2020 27%7
online share 2019 14%3 2019 22%7
Grocery online 2020 4%4 2020 10%8
share 2019 3%4 2019 4%8
Online market leader 40% 41%9
1) FEDIAF 2020 excl. Russia 2) Gross numbers by Euromonitor, VAT-adjusted by zooplus management as of October 2020; 3) Management assumption incl. Covid-19 factor; 4) Management assumption
based on Euromonitor numbers for 2019, incl. Covid-19 factor; 5) americanpetproducts.org; 6) Packaged Facts June 2020, includes retail channel pet food / treats and retail channel pet supplies (non-food)
incl. Covid-19 factor; 7) Packaged Facts June 2020, pre-Corona assumption for 2020 only 24%; 8) Mercatus study as of 2020, incl. Covid-19 factor; 9) Chewy market share based on 2020 forecast by
Packaged Facts of a total of $6.5bn in sales; 2019 figures result in market share of 40% 35PET CARE IS GROWING ACROSS ALL MARKETS
MAIN DRIVERS: PREMIUMIZATION & CALORY CONVERSION
TOTAL PET CARE NET SALES BY MARKET (in m EUR)
VOLUME MARKETS (20.7 bn EUR) MID-SIZED MARKETS (4.7 bn EUR)
5,000 1,500
1,400
4,500
1,300
4,000 1,200
1,100
3,500
1,000
3,000 900
800
2,500
700
2,000 600
500
1,500
400
1,000 300
200
500
100
0 0
DE UK FR IT BE/NL ES PL AT CH SE RO FI CZ DK PT NO HU
2015 2016 2017 2018 2019 2020
Source: Euromonitor 2020, not all market included in chart. 36WE ARE ONLINE MARKET LEADER IN ALL EUROPEAN
COUNTRIES WITH DOUBLE-DIGIT REVENUE GROWTH
MARKET SIZE (in bn EUR) MARKET PENETRATION & GROWTH OF Z+
8%
6.0 DACH
15%
6%
4.1 FR
18%
9%
2.0 BE, NL1
15%
14%
1.0 PL
27%
3%
4.7 UK, IE
22%
4%
2.8 IT
24%
5%
2.0 CEE
28%
5%
1.8 Nordics
16%
6%
1.9 ES, PT
11%
1) Incl. Luxembourg Market penetration Revenue growth
Note: Growth rates with constant fx-rates vs. PY
Market data based on Euromonitor 2020
37PET SUPPLIES RETAIL LANDSCAPE IN EUROPE:
COMPETITION FALLS INTO THREE CATEGORIES
ONLINE PURE PLAYER MASS GENERALIST MULTICHANNEL PLAYER REGIONAL ONLINER
Preferred industry partner Limited access to premium Online offering competing Low scale advantages
brands with physical store presence
Ideally positioned to Pricing as only USP
capture growing online Supporting digitization of High CAPEX requirements
High operating cost
share in all of Europe category
Low logistics / FC capacity
Low logistics / FC capacity
Strong logistics network High e-commerce
Low e-commerce
based on proprietary IT and logistics competencies Mostly no own brands
competencies
infrastructure
Own brand portfolio adds
to differentiation and
supports incremental
value creation
Best in class digital
experience in category
38WE ARE FULLY BACK ON GROWTH TRACK IN ALL
REGIONS
NORDICS
107m
12% 16%
UK, IE 2019 2020
142m
NL, BE1
22% DACH
5% PL
198m
2019 2020 168m
16% 15% 512m
26% 27%
2019 2020
FR 2019 2020
13% 15%
293m 2019 2020
CEE
ES, PT 18% IT 129m
11%
100m 2019 2020 141m
27% 28%
Sales growth 2019
24% Sales growth 2020e
9% 11%
8% 2019 2020
2019 2020 2019 2020 Country sales 2020e
Note: Growth rates with constant fx-rates vs. PY 39
1. Incl. LuxembourgPART II
Operational Excellence & EfficiencyCOST EFFICIENT OPERATION CREATING MOAT
FOR ONLINE AND OFFLINE COMPETITORS
COST STRUCTURE (in % of SALES)
28.2% 27.1% Strong efficiency in customer acquisition
and reduced marketing spend also
reflecting budget shift into early-stage
Ad./Marketing 3.3 % loyalty spend (included in gross margin)
1.6 %
Larger baskets prompting for higher value
per parcel, offsetting additional cost for
higher FC capacity & fully offsetting
Logistics 18.3 % 18.1 % additional logistics cost related to protective
Covid-19 measures
Payment1) Increase in IT / Admin / FX cost base
1.1 % 1.1 %
reflecting higher non-operating expenses
for strategic projects
IT / Admin / FX 2.0 % 2.6 %
Personnel expenses including one-off
Personnel2) 3.5 % 3.7 %
costs related to changes in organizational
9M 2019 9M 2020 structure and performance remuneration
1) Impairment expenses on financial assets reclassified to payment
2) Including LTI & SOP; own work capitalized reclassified to personnel 41IMPROVED GROSS MARGIN & LOWER COST RATIO NOT COMPETING
WITH GROWTH - ZOOPLUS BETTER POSITIONED THAN EVER BEFORE
GROSS MARGIN1 and COST RATIO2 DEVELOPMENT (in %)
35.8 %
Optimized steering of product sales mix
30.5 %
29.0 % Strong yield management & intelligent
28.7 %
pricing
Continued increase in own brands sales
share
2013 2018 2019 9M 2020
Marketing spend back to efficient territory
without losing reach
27.5% 27.1%
28.5% Continued improvement in operational
efficiency
32.7%
1) Gross margin = sales – cost of goods sold (as a % of sales); 2013 figure adjusted from published external figures to IFRS 15
2) Cost ratio based on cost within the EBITDA as a percentage of sales; 2013 & 2018 figures adjusted from published external figures to current reporting standard 42EFFICIENT TRAFFIC ACQUISITION ALLOWS FOR ADDITIONAL INVEST
INTO LOYALTY & DIGITAL EXPERIENCE
FOCUSING ON LOYALTY ACTIVE REPEAT CUSTOMER DEVELOPMENT (in m)
Investments into acquisition & loyalty in % of sales
Significantly improved
5.8% 4.1% 4.9
4,9
growth trajectory
4.7
4,7 Current run-rate
3.3 %
4.5
4,5 2019 run-rate
1.6 % (extrapolated)
4.3
4,3
0.5 % 0.2 %
1.7 % 4.1
4,1
1.6 %
0.4 % 0.6 %
3.9
3,9
9M 2019 9M 2020 Jan 2019 Nov 2020
Traffic Acquisition Repeat Customer Discount
New Customer Discount Loyalty Programs
43SALES FOCUS ON BIGGER BASKETS YIELDING HIGHER RETURNS:
POSITIVE IMPACT ON OVERALL CUSTOMER PROFITABILITY
BASKET VALUE1 SALES PER ACCOUNT LOSS-MAKING ORDERS2
per year (in EUR) per year (in EUR) order share per year (in %)
57 255 2017 2018 2019 2020
55 55 55
232 233
224 19% 17% 12%
26%
2017 2018 2019 2020 2017 2018 2019 2020
Based on 9M 2020 figures, 1) Based on order date, net. Non-BMF;
2) Loss-making orders are all orders with a negative CM2 (sales-cost of goods – variable logistics cost) 44MANAGING CUMULATED & INCREASED CUSTOMER DEMAND
FROM AN OPERATIONAL PERSPECTIVE
4.9m 96% € 57
active repeat stock availability basket value
customers across all markets
30 11 1.2
countries fulfillment centers parcels / order
in Europe
107k 35d €9
parcels / day stock rotation costs / parcel
Peak capacity: 170k parcels / day
Based on 9M 2020 figures
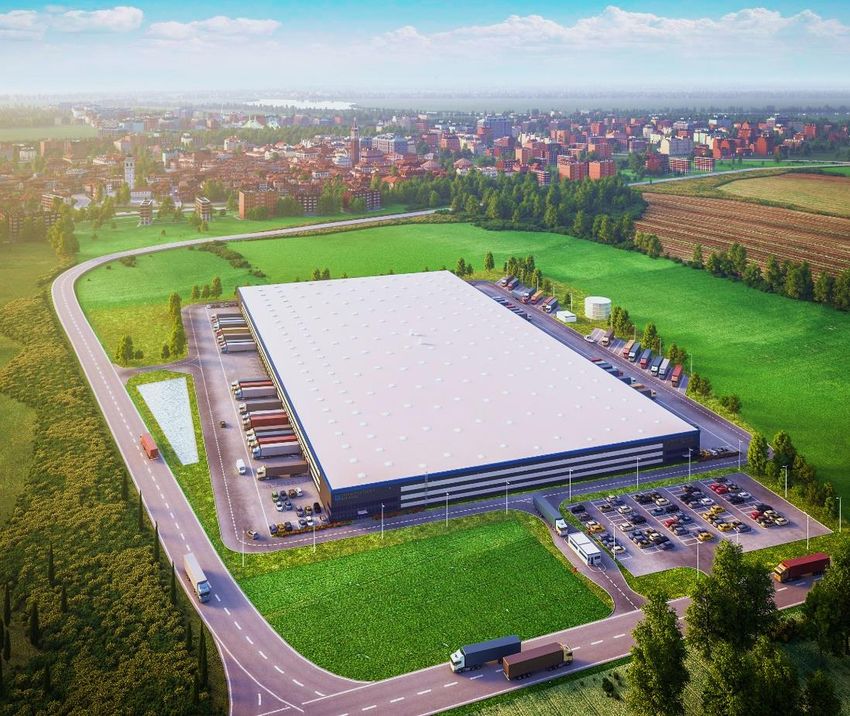
45MOST OUTSTANDING LOGISTICS NETWORK ACROSS EUROPE
IN OUR CATEGORY
2013 PL: New local FC WRO
2015 FR: New local FC CHA FC SXB
2016 BE: New local FC ANR
KRO UK: New local FC BHX
TIL
BHX ANR 2017 NL: Increase automation in TIL
HOE WRO DE: New local FC MHX
JIR PL: New local FC BOL
MHX
ES: Launch FC MAD
CHA 2018 PL: New local FC KRO
MIL UK: FC BHX expanded capacity
2019 IT: New FC MIL
MAD
UK: Automation implemented to increase capacity
2020
BE: Increase automation in ANR
Fulfillment center (FC) Parcel output 46STATE OF THE ART LOGISTICS INFRASTRUCTURE FOR PET SUPPLIES IN EUROPE
47PART II
Strategic Brand and Product Portfolio
ManagementPET PARENTS´ DARLING AND PREFERRED PARTNER FOR BRANDS
Tailored own Big international GERMANY NETHERLANDS UK
brand portfolio brands
Germany’s Best Online Best Web Shop Best Online Pet Retailer
Shop [Pet Supplies] [Home & Garden] [Dog Supplies]
German Online Retail Best Web Shop Best Online Pet Retailer
Award [FMCG] [Pet Specialist] [Cat Supplies]
German Online Retail Best Web Shop
Award [Overall] [Across Categories] SPAIN
Pet Retail Prize Online Best Online Shop
[Pet Supplies] FRANCE [Overall]
Retailer of the Year Best Online Pet Retailer Exceptional Support
[Pet Specialist] [Dog & Cat Supplies] [Charity]
Popular local Curated accessories
Top Shop 2020
variety selection [Leisure, Sports & Hobby] ITALY CZECH REPUBLIC
Top Service Quality Retailer of the Year Retailer of the Year
[Pet Supplies] [Pet Supplies] [House, Garden & Breeder]
Selected awards from past years
49OPTIMIZED SALES MIX STEERING ALLOWS TO GEAR FOR
BETTER MARGINS
SHARE OF NET SALES AND CONTRIBUTION MARGIN (CM2) IN 9M 2020
Sales/CM2 Index:
Big international brands: 0.6
Local champion brands: 0.9
14%
Own brands: 1.6
26% 26% Accessories: 1.9
15% 45%
Actively managed product sales mix is
24% 24% the long-term driver for sales margin
26%
improvement
Stabilization of accessories share in
2020, coming from 15% (2018) and 14%
(2019)
Increasing sales share of own brands,
coming from 12% (2018) and 14% (2019)
Share of Net Sales Share of CM2 Own Brands and accessories accounting
for 50% of contribution margin in 2020
Accessories Own Brands Local champion brands Big international brands
1) CM2 = Sales – cost of cost of goods sold - variable logistics costDog dry Dog wet Dog snacks Dog
accessories
USP & Reason Why for customer
Species-appropriate food for the modern dog
Offering grain-free recipes and lots of fresh meat as high-quality
protein
Based on the wolf´s natural diet
Strategic role of brand for zooplus
Drives sales & margin
First Blockbuster Own Brand to be successful in dog dry food
>300k >130 4.4/5
customers1 SKUs Customer
Satisfaction2
2.3%
Sales share of total group sales
1) First usage and repeat; 2) Wolf of Wilderness Survey 2020 n=1050Cat dry Dog dry Cat snacks Dog snacks
USP & Reason Why for customer
70% - 80% meat, fish & other selected animal ingredients
20% - 30% fruits, vegetables & herbs
0% added grains
Strategic role of brand for zooplus
Continuous growth, convincing palatability especially for cat dry food
Profitable business especially on a single SKU view
Serving loyal zooplus customers
>300k >60 For cats &
customers1 SKUs dogs
1.9%
Sales share of total group sales
1) First usage and repeat
MUC_30/06/2020_Strategy_Draft_2023Clumping Cat litter Silicate Cat litter
USP & Reason Why for customer
Attractive price-quality ratio
High quality standards
Great selection of different cat litters
Satisfies the different needs of cats and their owners
Strategic role of brand for zooplus
No.1 Litter brand at zooplus (sales, margins, quantities)
Highest sales/SKU in Own Brand portfolio
Solving e-commerce challenges with cat litter in the best way possible
>450k >25 No. 1
customers1 SKUs Litter brand at
zooplus
34%
Sales share of relevant category
1) Frst usage and repeatPART II
Outlook 2021IN 2021 ZOOPLUS IS A 2 BN EUR REVENUE COMPANY
CONTINUING TO GROW IN PROFITABLE OPERATING MODE
Revenue
Range
2,040 m EUR – 2,140 m EUR
Earnings
Range 40 m EUR – 80 m EUR
(EBITDA)
55IN 2021 ZOOPLUS IS A 2 BN EUR REVENUE COMPANY
CONTINUING TO GROW IN PROFITABLE OPERATING MODE
Revenue
Range
2,040 m EUR – 2,140 m EUR
250 m EUR – 350 m EUR
Growth range1
(14%) (20%)
Earnings
40 m EUR – 80 m EUR
Range
(EBITDA, margin%) (2%) (4%)
1) based on 2020 performance in mid range of guidance
56WE WILL INCREASE OUR GROWTH MOMENTUM FURTHER
IN THE UPCOMING YEAR
SALES GROWTH (in EUR)
350m
266m
250m
231m
180m
2018 2019 2020e 2021g
57STRUCTURAL PROFITABILITY DRIVERS IMPROVE
EARNINGS SIGNFICANTLY
EBITDA (in EUR)
80m
58m
40m
12m
9m
2018 2019 2020e 2021g
58Q&A
Live
Session
Please post your questions in the chat
window under the video panel of this
webcastThank you for joining & stay safe
You can also read