Deep mantle structure and origin of Cenozoic intraplate volcanoes in Indochina, Hainan and South China Sea
←
→
Page content transcription
If your browser does not render page correctly, please read the page content below
Geophys. J. Int. (2021) 225, 572–588                                                                                            doi: 10.1093/gji/ggaa605
Advance Access publication 2020 December 22
GJI Geodynamics and Tectonics

Deep mantle structure and origin of Cenozoic intraplate volcanoes in
Indochina, Hainan and South China Sea

Dapeng Zhao, Genti Toyokuni and Kenkichi Kurata
Department of Geophysics, Graduate School of Science, Tohoku University, Sendai 980–8578, Japan. E-mail: zhao@tohoku.ac.jp

Accepted 2020 December 18. Received 2020 December 7; in original form 2020 May 1

                                                                                                                                                             Downloaded from https://academic.oup.com/gji/article/225/1/572/6044229 by guest on 26 October 2021
                                       SUMMARY
                                       Cenozoic basalts with ages ranging from 28.5 to < 0.1 Ma are widely distributed in the
                                       Indochina block, the South China Sea basin and the Leiqiong area in South China including
                                       the Leizhou Peninsula and the northern Hainan Island, which form the southeastern Asian
                                       basalt province (SABP). These Cenozoic basalts share common petrological and geochemical
                                       characteristics. However, the origin of the Cenozoic intraplate volcanism in the SABP is still a
                                       controversial issue. In this work, we apply a novel technique of multiscale global tomography
                                       to study the whole-mantle 3-D P-wave velocity (Vp ) structure beneath the SABP. Our results
                                       show that low-Vp anomalies prevail in the whole mantle beneath the SABP. Although the
                                       strongest low-Vp zones exist beneath Hainan, significant low-Vp anomalies are also visible
                                       in the mantle beneath other parts of the SABP. These low-Vp anomalies appear somehow
                                       independent, rather than deriving from a single plume. We deem that a cluster of plumes rather
                                       than a single plume existed in the Cenozoic and may still exist now in the mantle beneath the
                                       SABP, though the Hainan plume may be the strongest one. A geochemical study suggested
                                       that the Hainan plume upwelling might be slowing down and close to exhausting its source
                                       zone. This geochemical inference is supported by our tomographic images showing that the
                                       low-Vp zones under Hainan are weak and intermittent in the lower mantle (∼700–2889 km
                                       depths). The low-Vp zones in the mantle beneath other SABP Cenozoic volcanoes are also
                                       weak, suggesting that those mantle plumes, if any, are also dying or already dead. As compared
                                       with a strong single plume, each member in a plume cluster should be small and weak, and so
                                       hard to exist long. The SABP is surrounded by subduction zones. The hot mantle upwelling
                                       beneath the SABP might be caused by collapsing of subducted slabs down to the lowermost
                                       mantle.
                                       Key words: Seismic tomography; Subduction; Hotspots; Mantle processes; Intra-plate pro-
                                       cesses; Dynamics: convection currents, and mantle plumes.

                                                                               sharing common petrological and geochemical characteristics, that
1 I N T RO D U C T I O N
                                                                               is, intraplate oceanic island basalt (OIB)-like features (e.g. Hoang
In the present study region (Fig. 1), the Philippine Sea plate is              et al. 1996; Ho et al. 2000; Yan et al. 2018; Gu et al. 2019),
subducting beneath the Eurasian plate along the Ryukyu trench                  which mainly occur in the Indochina block, the SCS basin, and the
and the Philippine trench, whereas the Eurasian plate is subducting            Leiqiong area including the Leizhou Peninsula and the northern
beneath the Philippine Sea plate along the Manila trench (e.g. Bird            Hainan Island (Fig. 2).
2003). Strong interactions (including both subduction and collision)              The SCS is one of the largest marginal sea basins in the western
between the Eurasian and Philippine Sea plates have produced the               Pacific (Figs 1 and 2). The SCS has undergone almost a complete
Taiwan Island. In addition to active arc volcanoes on the Ryukyu               Wilson cycle, though the SCS basin is small and young (e.g. Zhang
arc, Taiwan and the Philippines caused by the plate subductions,               et al. 2020a). Opening of the SCS started at ∼33 Ma and ended
Cenozoic intraplate volcanoes exist in and around the South China              at ∼15 Ma (e.g. Li et al. 2014). Subsequently, extensive and vo-
Sea (SCS), east of the Burma arc (e.g. the Tengchong volcano) and              luminous intraplate volcanism occurred in the SCS basin and the
around the Korean Peninsula (e.g. the Jeju and Ulleung volcanoes;              SABP (Fig. 2). The post-spreading volcanism in these regions can
Fig. 1). The southeastern Asian basalt province (SABP) is composed             be divided into two magmatic series: the tholeiitic series (16–8 Ma)
of Cenozoic basalts with ages ranging from 28.5 to < 0.1 Ma and                and the alkali series (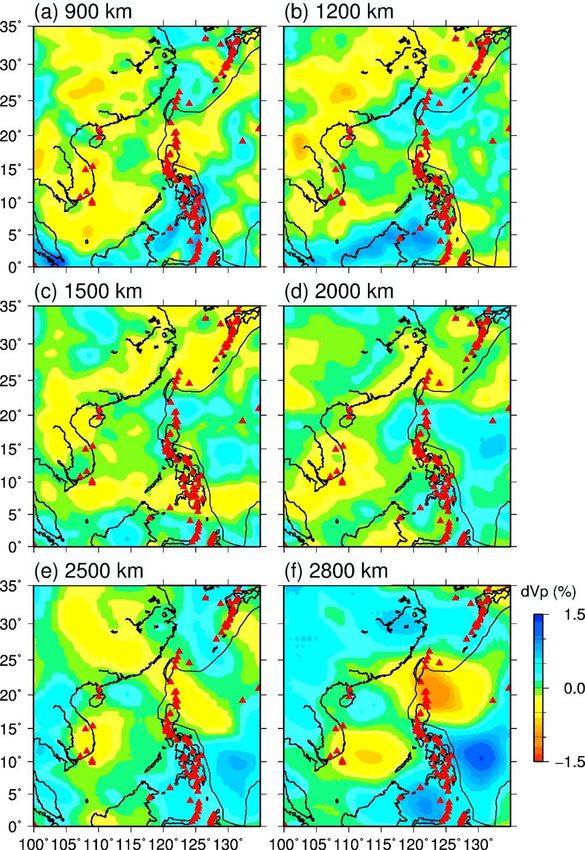
Origin of the Cenozoic intraplate volcanism in the SABP                     573

                                                                                                  OP
                                                                    DTV
                                                                                          CBV

                                                                                          ULV

                                                                                                        PP

                                                                                    JJV

                                                 TCV                             ECS

                                                                           TW

                                                                 HNI

                                                          VTM

                                                                                                                                                               Downloaded from https://academic.oup.com/gji/article/225/1/572/6044229 by guest on 26 October 2021
Figure 1. Tectonic setting of the present study area (the black box) and surrounding regions. The colours show the surface topography whose scale is shown
at the bottom. The black lines denote plate boundaries (Bird 2003). The red triangles denote active arc volcanoes and Cenozoic intraplate volcanoes. The red
arrows denote the plate moving directions. OP, the Okhotsk plate; PP, the Pacific plate; IBT, the Izu-Bonin trench; RKT, the Ryukyu trench; MNT, the Manila
trench; PLT, the Philippine trench; ECS, the East China Sea; CBV; the Changbai volcano; ULV, the Ulleung volcano; DTV, the Datong volcano; JJV, the Jeju
volcano; TCV, the Tengchong volcano; TW, Taiwan; HNI, the Hainan Island; VTM, Vietnam.

                         19N

                         13N

                          7N
                                                                                                       SABP

                            97E                     103E                    109E                       115E                121E
Figure 2. Distribution of Cenozoic basalts (red patches) in the southeastern Asian basalt province (SABP). The inset map shows the location and tectonic
background of the SABP. The ages (in Ma) and areas (in Mkm2 ) of individual basalts are from Hoang et al. (1996), Yan et al. (2018) and Ho et al. (2000).
Modified from Gu et al. (2019).

Zhang et al. 2020a). However, the magmatic origin of the Ceno-                   (enriched mantle type 1) or the triangular field among DMM, EM-
zoic volcanism in the SABP is controversial. Most of the Cenozoic                1 and EM-2 in many geochemical diagrams (e.g. Jia et al. 2003;
basalts are plotted into the field between DMM (depleted mid-ocean               Fedorov & Koloskov 2005; Yan et al. 2008, 2014, 2015, 2018;
ridge basalt mantle) and EM-2 (enriched mantle type 2) or EM-1                   Yang & Fang 2015; An et al. 2017; Zhang et al. 2018, 2020a). The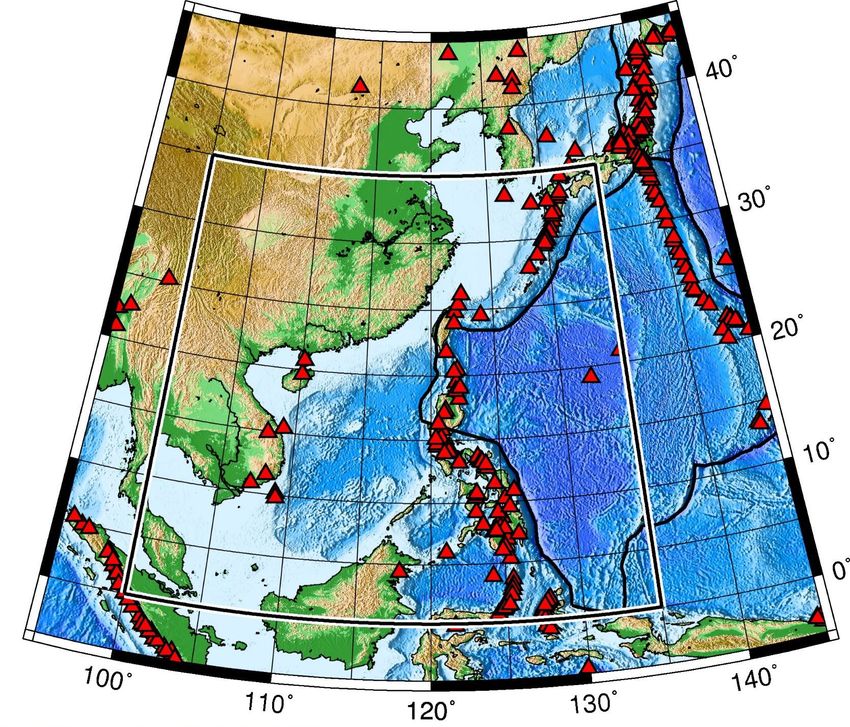
574       D. Zhao, G. Toyokuni and K. Kurata

                                                                            Philippine
                                                                               Sea

                                                       South China
                                                           Sea

                                   (a)

                                                                                                                                                               Downloaded from https://academic.oup.com/gji/article/225/1/572/6044229 by guest on 26 October 2021
                                                                                                       (c)

                                           (b)

Figure 3. (a) Map view and (b) east–west and (c) north–south vertical cross-sections showing the distribution of 8991 earthquakes (yellow dots) in the study
region, which are used for tomographic imaging.

                                                                                                                 (a)

                                                                                                                 (b)

Figure 4. Distribution of (a) seismic stations (blue dots) and (b) earthquakes (yellow dots) used in the global tomographic inversion. The blue lines in (b)
denote plate boundaries (Bird 2003). The red box shows the present study region.

origin of the SABP enriched components is debated. Earlier studies                Ren et al. 2013; Yang & Fang 2015), whereas more recent studies
suggested that the enriched components originated from subconti-                  have shown that these enriched components are related to a deep
nental lithospheric mantle (e.g. Tu et al. 1991, 1992; Flower et al.              origin, for example, entrained by a mantle plume (Yan et al. 2008,
1992; Hoang et al. 1996; Wang et al. 2012a; Huang et al. 2013;                    2015, 2018, 2019; Zou & Fan 2010; Wang et al. 2012b; Li et al.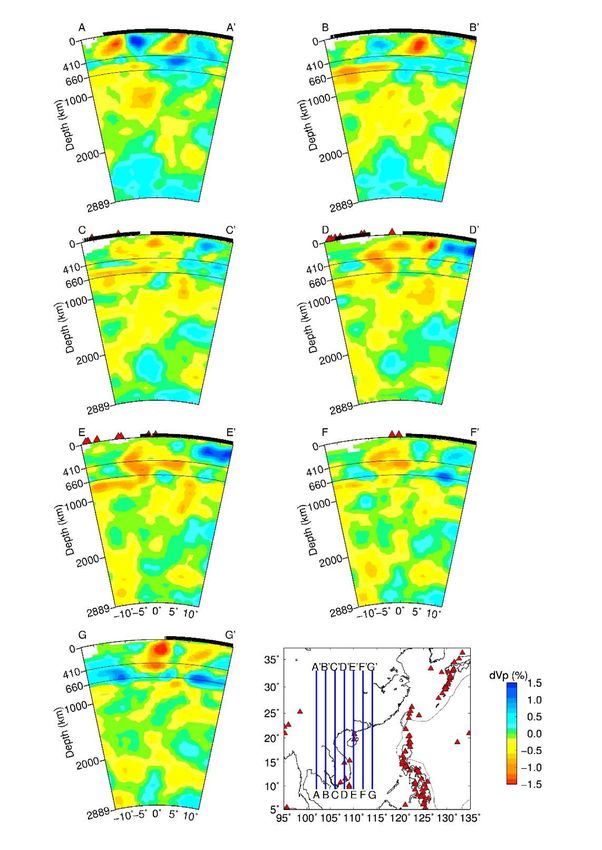
Origin of the Cenozoic intraplate volcanism in the SABP              575

                                                                                   mantle upwelling (e.g. the Hainan mantle plume; Supporting Infor-
                                                                                   mation Fig. S1). However, the previous models of local and regional
                                                                                   tomography are generally limited to the crust and upper mantle (0–
                                                                                   660 km depths), which prevent us from understanding the fate of
                                                 East China
                                                    Sea
                                                                                   subducting slabs and origin of the Cenozoic volcanism in the SABP,
                                                                                   because subducting slabs may finally sink down to the core–mantle
                          South China                                              boundary (CMB at 2889 km depth) and mantle plumes may be born
                                                                                   at the CMB (e.g. Zhao 2001, 2007; Montelli et al. 2006; Toyokuni
                                                                                   et al. 2020a,b). Although many global tomographic models for the
                                                                                   whole mantle structure have been determined, they generally have
                                                                                   a low resolution (>500 km) in the present study region (see recent
                                                        Philippine                 reviews by Hall & Spakman 2015; Zhao 2015).
                            South China                    Sea
                                                                                      In this work, we apply a new technique of multiscale global
                                Sea
                                                                                   tomography to study the whole-mantle 3-D P-wave velocity (Vp )
                                                                                   structure down to the CMB beneath the SABP region (Figs 1 and 3).

                                                                                                                                                            Downloaded from https://academic.oup.com/gji/article/225/1/572/6044229 by guest on 26 October 2021
                                                                                   Our results shed new light on the complex structure and mantle dy-
                                                                                   namics of the region, in particular, the origin of Cenozoic intraplate
                                                                                   volcanism in the SABP, fate of the subducting slabs, and the slab-
                                                                                   plume interactions.

                                                                                   2 D ATA A N D M E T H O D
Figure 5. Distribution of 538 seismic stations (blue squares) in the present
study region.                                                                      We used abundant P-wave arrival-time data of earthquakes, which
                                                                                   are selected from the reprocessed ISC (International Seismolog-
2013; An et al. 2017; Liu et al. 2017; Yu et al. 2018; Zhang et al.                ical Center) data base (www.isc.ac.uk; Engdahl et al. 2020), the
2018, 2020a; Yuan et al. 2019). Recently, it is also suggested that                JMA (Japan Meteorological Agency) Unified Earthquake Catalogue
delamination of continental lithosphere may explain the EM-2 sig-                  (www.jma.go.jp) and the Annual Bulletin of Chinese Earthquakes
nature of the SCS post-spreading magmatism, so shallow recycling                   (China Earthquake Network Center: http://www.ceic.ac.cn/). For se-
of continental lithosphere could be a mechanism contributing to                    lecting a best set of earthquakes for the tomographic inversion, the
mantle heterogeneity, which was introduced into the upper mantle                   crust and mantle (0–700 km depths) are divided into cubic blocks.
during rifting of the South China block (Qian et al. 2020).                        The block size is 0.5◦ × 0.5◦ × 10 km for the whole globe but 0.1◦
   Due to the strong interactions of the lithospheric plates and tec-              × 0.1◦ × 5 km for the target region (Fig. 1). Among the many earth-
tonic blocks (Fig. 1), earthquakes occur actively in and around the                quakes located within each block, only one event is selected that
present study region (Figs 3 and 4b), including shallow crustal earth-             has the maximum number of arrival-time data and the minimum
quakes, megathrust earthquakes along the subducting slab interface,                uncertainty in the hypocentral location. As a result, our data set
and intermediate-depth and deep-focus earthquakes within the sub-                  contains a total of 5 436 292 arrival times from 39 327 earthquakes
ducting slabs (e.g. Zhao et al. 2011; Engdahl et al. 2020). Using                  (Fig. 4b) recorded at 9141 seismic stations in the world (Fig. 4a),
seismic wave data generated by the local earthquakes (Fig. 3) and                  which include 8991 events and 538 stations in the target study re-
teleseismic events (Fig. 4b), many seismological studies have been                 gion (Figs 3 and 5). These data include 4 927 718 P wave, 296 143
made to investigate the structure, seismotectonics and volcanism of                pP wave, 162 106 PP wave, 18 753 PcP wave and 31 572 Pdiff wave
the East or Southeast Asian region (for detailed reviews, see Zhao                 arrival times (see Supporting Information Fig. S2 for a schematic il-
et al. 2011; Zhao 2015). For example, local tomography methods                     lustration of ray paths of the five kinds of seismic waves). Thus, our
are applied to study the fine 3-D crustal and upper-mantle structure               target SABP region is well sampled by the upgoing and downgoing
beneath Jeju (Song et al. 2018), Taiwan (e.g. Wang et al. 2006;                    rays of both the direct P waves and later phases (see Supporting
Chou et al. 2009; Wu et al. 2009; Toyokuni et al. 2016), South-                    Information Fig. S3 for the distribution of ray paths in the study
east China (e.g. Huang et al. 2010; Xia & Zhao 2014; Xia et al.                    volume).
2020), Hainan (e.g. Lei et al. 2009a; Huang 2014; Xia et al. 2016),                   The arrival-time data used in this work were all recorded by
Southwest China (e.g. Lei et al. 2009b; Lei & Zhao 2016; Huang                     short-period seismometers installed in different parts of the world
et al. 2019) and the Philippines (e.g. Fan et al. 2016, 2017; Fan                  compiled by the ISC, the JMA and the China Earthquake Network
& Zhao 2018, 2019). Some studies of regional tomography using                      Center, and so their picking errors are generally small, being ∼0.1
body-wave traveltimes focused on the western Pacific and East (or                  to ∼0.3 s (e.g. Zhao et al. 2017; Engdahl et al. 2020). The arrival-
Southeast) Asian region (e.g. Huang & Zhao 2006; Li & van der                      time data with the best quality are selected for this work, and the
Hilst 2010; Wei et al. 2012, 2015; Huang et al. 2015; Ma et al.                    data with a poor quality are not used.
2019; Wei & Zhao 2020), but these studies did not fully cover the                     We apply a new method of multiscale global tomography (Zhao
present study region (Fig. 1) that is located at edge parts of the                 2015; Zhao et al. 2017) to our data set to determine a high-resolution
previous models. A few studies of surface wave tomography deter-                   3-D Vp model of the whole mantle beneath the SE Asian region. To
mined 3-D S-wave velocity models of the crust and upper mantle                     express the 3-D Vp structure, we arrange a dense 3-D grid with a
beneath the SCS and adjacent regions (e.g. Lebedev & Nolet 2003;                   lateral grid interval of ∼50 km beneath the target SE Asian region,
Wu et al. 2004; Tang & Zheng 2013). These previous studies have                    whereas a coarse 3-D grid with a lateral grid interval of ∼220 km
provided important information on the 3-D seismic structure and                    is arranged in the whole crust and mantle of the Earth (Fig. 6).
mantle dynamics, in particular, the cold subducting slabs and hot                  Vp perturbations at the grid nodes from the 1-D iasp91 velocity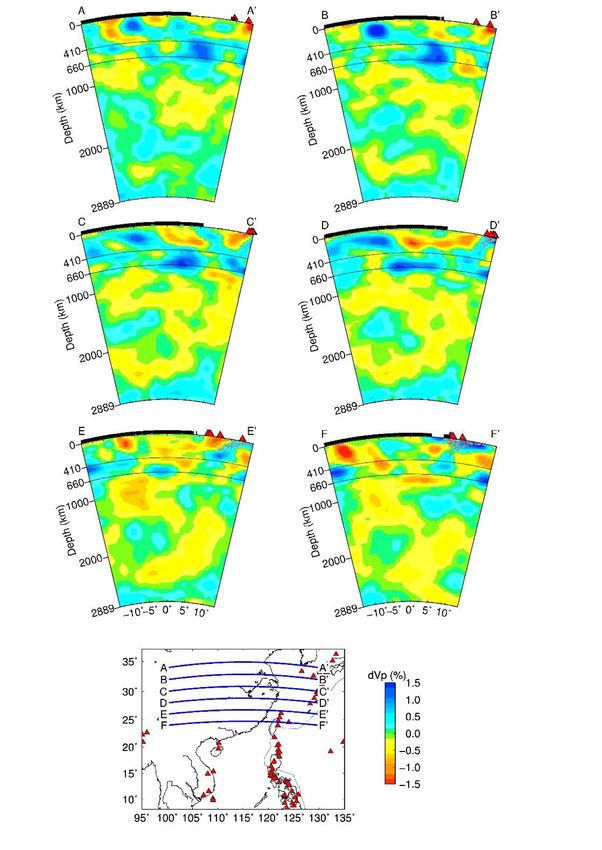
576 D. Zhao, G. Toyokuni and K. Kurata
(a)
Downloaded from https://academic.oup.com/gji/article/225/1/572/6044229 by guest on 26 October 2021
Mantle
Core
(b)
Figure 6. (a) Map view and (b) east–west vertical cross-section showing the distribution of grid nodes (red dots) arranged for conducting global tomographic
inversion. A denser 3-D grid is arranged in the present study volume. CMB, the core–mantle boundary.
model (Kennett & Engdahl 1991) are taken as unknown parameters. are located above significant low-velocity (low-Vp ) anomalies in
The Vp perturbation at any point in the model is calculated by the mantle wedge above the subducting Eurasian plate under the
linearly interpolating the Vp perturbations at the eight grid nodes northern Philippines, and above the subducting Philippine Sea plate
surrounding that point. A 3-D ray tracing technique (Zhao et al. beneath the Ryukyu arc, North Taiwan and the central-southern
1992; Zhao 2001) is used to compute theoretical travel times and Philippines (see Fig. 1). The low-Vp anomalies represent source
ray paths. The LSQR algorithm (Paige & Saunders 1982) with zones of arc magmatism and volcanism caused by joint effects of
damping and smoothing regularizations is adopted to solve the large fluids from the slab dehydration and corner flow in the mantle wedge
but sparse system of observational equations (Zhao 2004; Zhao et al. driven by the slab subduction (e.g. Tatsumi 1989; Iwamori & Zhao
2017). A number of tomographic inversions of the selected data set 2000). In the mantle transition zone (MTZ, 410–660 km) depths,
are conducted to find the optimal values of damping and smoothing broad high-Vp anomalies are visible (Figs 7d–f), which may reflect
parameters by considering the balance between the reduction of the stagnant slab in the MTZ (e.g. Zhao 2004; Huang & Zhao 2006;
the root-mean-square traveltime residual and the smoothness of the Wei et al. 2012; Ma et al. 2019).
obtained 3-D Vp model (Zhao 2015; Zhao et al. 2017). In the lower mantle, the amplitude of Vp anomalies is generally
smaller than that in the upper mantle and the MTZ (compare Figs 7
and 8), whereas the Vp anomaly amplitude is increased again in the
3 R E S U LT S A N D R E S O L U T I O N lowermost mantle (Fig. 8f). This pattern of Vp anomaly amplitude
A N A LY S I S changes is the same as that of the previous whole-mantle tomo-
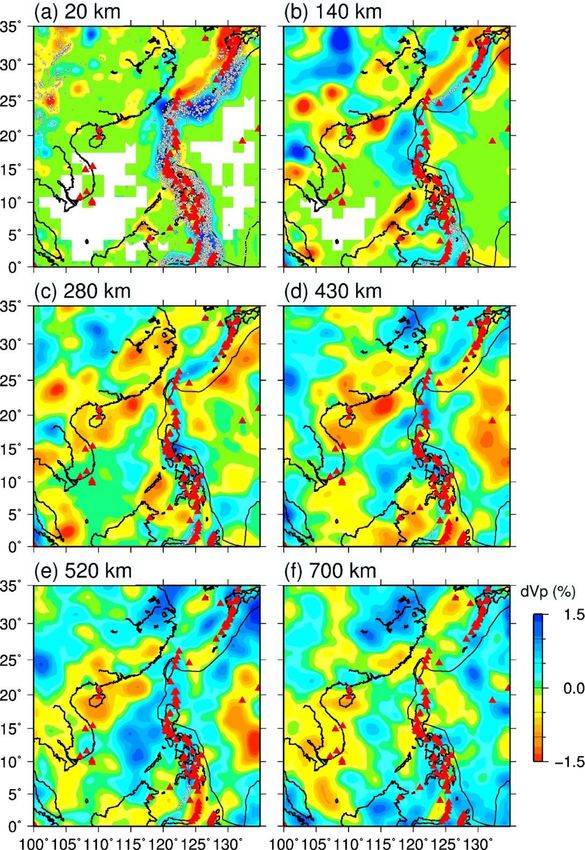
Figs 7 and 8 show map views of Vp tomography beneath the tar- graphic models (see reviews by Zhao 2004, 2015; Hall & Spakman
get region obtained by this study. Vertical cross-sections of the 2015), indicating that the velocity structure is very heterogeneous
Vp tomography are shown in Figs 9–13. The active arc volcanoes, in the upper mantle and the MTZ, but becomes less heterogeneous
Cenozoic intraplate volcanoes (Simkin & Siebert 1994) and local in most of the lower mantle. However, the D” layer with a thick-
seismicity are also shown in the tomographic images. In the upper ness of 200–300 km above the CMB exhibits strong lateral and
mantle, the subducting Philippine Sea slab is imaged clearly as dip- vertical heterogeneities because cold subducted slabs finally col-
ping high-velocity (high-Vp ) zones beneath the Ryukyu arc, North lapse down to the CMB and hot mantle plumes are born there (e.g.
Taiwan and the Philippines, and intermediate-depth and deep earth- Lay & Garnero 2011; Zhao 2015). Intermittent high-Vp anomalies
quakes occurred within the high-Vp slabs (Figs 7, 9, 10, 12 and 13). are clearly visible in the lower mantle beneath the study region
The subducting Eurasian plate is visible beneath South Taiwan and (Figs 8–13), and broad high-Vp zones exist in the D” layer (Fig.
the northern Philippines (Figs 7 and 10). The active arc volcanoes 8f), which reflect pieces of the subducted Pacific, Philippine Sea,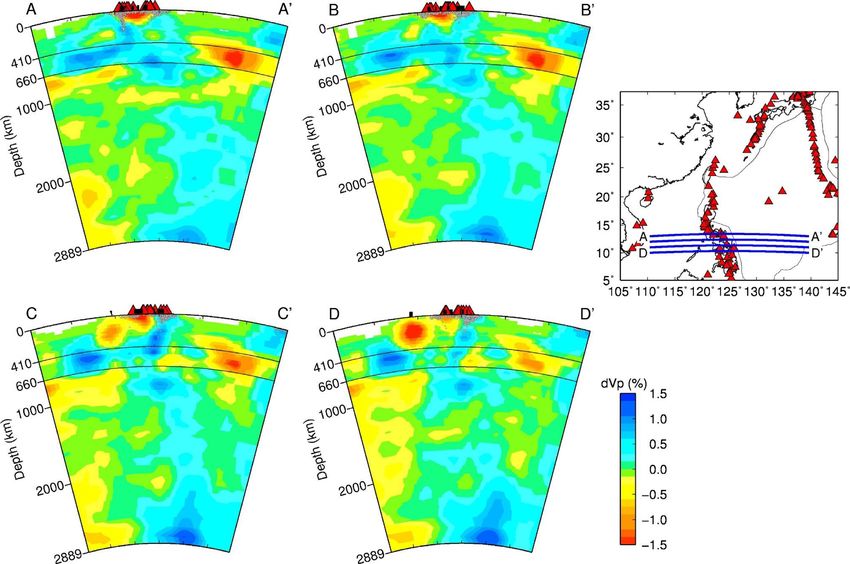
Origin of the Cenozoic intraplate volcanism in the SABP                       577

                                                                                                                                                                   Downloaded from https://academic.oup.com/gji/article/225/1/572/6044229 by guest on 26 October 2021
Figure 7. Map views of P-wave velocity (Vp ) tomography at depths of 20–700 km. The layer depth is shown above each map. The red and blue colours denote
low and high Vp perturbations, respectively, whose scale is shown on the right. The red triangles denote active arc volcanoes and Cenozoic intraplate volcanoes.
The black lines denote plate boundaries at the surface. The white dots denote seismicity in a depth range of 15 km of each layer.

Eurasian and Indian slabs that have collapsed down to the lower                    and the Leiqiong area, but they also show up clearly in the whole
mantle and reached the CMB as a result of very large gravita-                      mantle under Indochina, South China and the SCS (Figs 9–13).
tional instability caused by phase transitions (e.g. Maruyama 1994;                   Fig. 13 shows whole-mantle Vp images under the Philippines. The
Zhao 2004, 2015).                                                                  images of the upper mantle and the MTZ are generally consistent
   Significant low-Vp anomalies are visible in the upper mantle and                with those of the previous local tomography of the region (Fan &
the MTZ beneath South China, the Hainan Island, the northern SCS,                  Zhao 2018, 2019). High-Vp zones appear at depths > ∼2200 km
and the Indochina block (Fig. 7), and the low-Vp zones extend to the               (Fig. 13), which reflect the subducted Philippine Sea slab, the Pacific
lower mantle with reduced amplitudes (Fig. 8). Under the Cenozoic                  slab, and perhaps also the Eurasian slab that have collapsed down
intraplate volcanoes in the SABP, continuous or intermittent low-Vp                to the CMB.
anomalies are generally visible in the whole mantle (Figs 9–12).                      We made detailed checkerboard resolution tests to confirm the
The low-Vp anomalies are most significant under the Hainan Island                  reliability of our tomographic model. To perform a checkerboard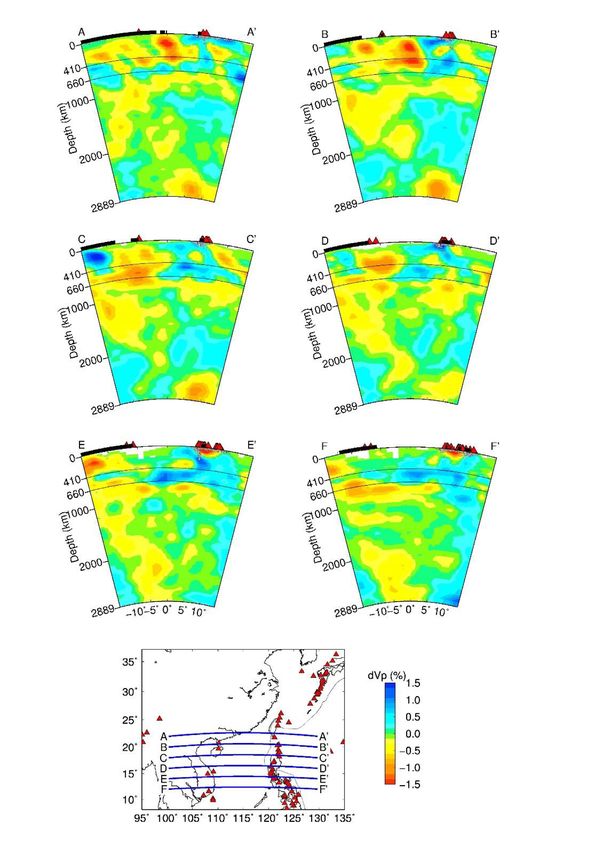
578      D. Zhao, G. Toyokuni and K. Kurata

                                                                                                                                                        Downloaded from https://academic.oup.com/gji/article/225/1/572/6044229 by guest on 26 October 2021
Figure 8. The same as Fig. 7 but for Vp tomography of the lower mantle beneath the study region.

resolution test for the Vp tomography (e.g. Zhao 2004; Zhao et al.              of the data picking errors on the tomographic results. The test re-
2017), we first construct an input checkerboard model by assigning              sults show that the effects of the random noise are very small, and
Vp perturbations of ±3 per cent alternately at the 3-D grid nodes               the input models are generally well recovered (see also Zhao et al.
(see the upper panels in Supporting Information Figs S4 and S5).                2017). This is because we have used a large amount of arrival-time
Then we calculate synthetic traveltime residuals for the checker-               data (> 5 millions), so the effects of the picking errors are greatly
board model with the same numbers of seismic stations, events and               reduced.
ray paths as those in the real data set (Figs 3–5), and then we in-                From the results of the checkerboard tests, we also estimate the
vert the synthetic data to obtain an output model (middle panels                recovery rate that is defined as the ratio of the recovered and in-
in Supporting Information Figs S4 and S5). Before the inversion,                put amplitudes of Vp anomaly at each grid node, and the results
random noise (−0.3 to + 0.3 s) is added to the synthetic trav-                  are shown in the lower panels of Supporting Information Figs S4
eltime data to simulate the picking errors of the data. We have                 and S5. Supporting Information Figs S6–S9 show the distribution
conducted many tomographic inversions to investigate the effects                of ray hit-counts (i.e. the number of P-wave rays passing around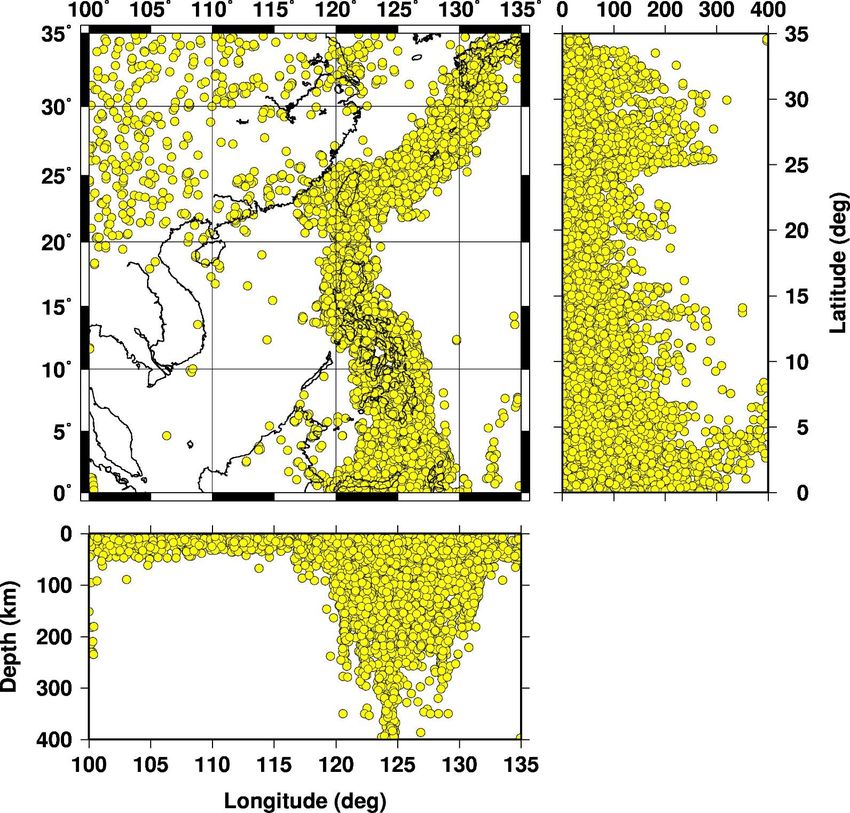
Origin of the Cenozoic intraplate volcanism in the SABP                     579

                                                             Jeju                                           Jeju

                                                                 a                                             b

                                                                                                                                                                Downloaded from https://academic.oup.com/gji/article/225/1/572/6044229 by guest on 26 October 2021
                                                                 c                                             d
                                                       TWV                                            TWV

                                                                 e                                             f

Figure 9. East–west vertical cross-sections of Vp tomography from the Earth’s surface down to the core-mantle boundary along the six profiles as shown in
the map. The red and blue colours denote low and high Vp perturbations, respectively, whose scale is shown at the bottom. The red triangles denote active
volcanoes. The black bar above each panel denotes the land area. The 410 and 660 km discontinuities are shown as black lines in each cross-section. The white
dots denote seismicity within a width of one degree (i.e. 111 km) of each profile. TWV, volcanoes in and around North Taiwan.

each grid node) and the recovery rate in four representative verti-                  Fig. S10 shows results of a synthetic test whose procedure is the
cal cross-sections. These test results (Supporting Information Figs               same as that of the checkerboard test except for the input model.
S4–S9) show that the input checkerboard models are generally well                 Three low-Vp columns are arranged in the input model to simu-
recovered in the whole mantle under the study region, except for                  late three mantle plumes beneath Hainan, SCS and Indochina. The
the crust and shallow upper mantle under the oceanic areas where                  test results (Fig. 14) show that the low-Vp columns are generally
no or very few seismic stations exist (Fig. 5).                                   well recovered in most parts of the mantle, except for the shal-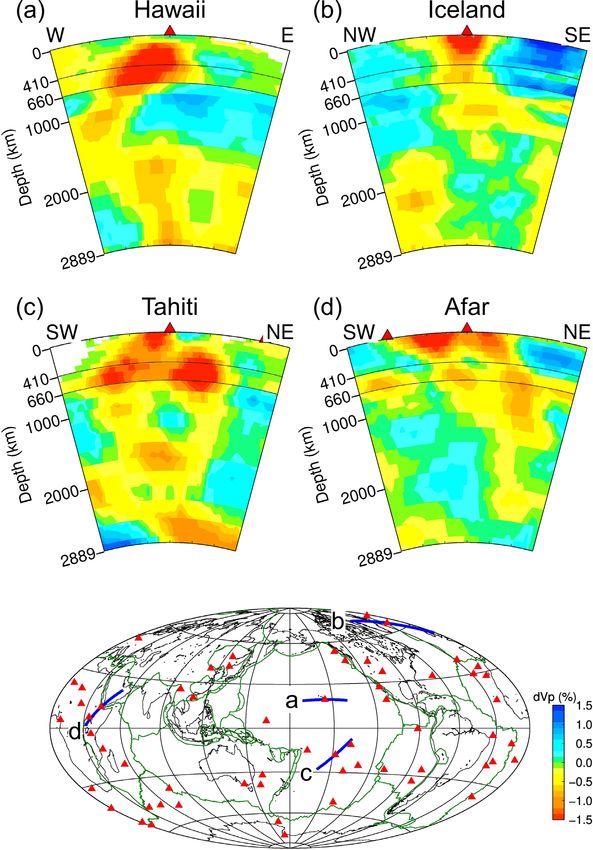
580      D. Zhao, G. Toyokuni and K. Kurata

                                        Hainan        Taiwan                         Hainan           PV

                                                              a                                             b

                                        Hainan          PV                           CVN              PV

                                                                                                                                                            Downloaded from https://academic.oup.com/gji/article/225/1/572/6044229 by guest on 26 October 2021
                                                              c                                             d

                                         CVN            PV                           SVN               PV

                                                              e                                             f

Figure 10. The same as Fig. 9 but along six other profiles as shown in the map. PV, volcanoes in the Philippines; CVN, volcanoes in central Vietnam; SVN,
volcanoes in southern Vietnam.

low mantle and close to the CMB where the ray coverage is not                   features of our tomographic model as mentioned above are quite
good enough (see Supporting Information Fig. S3). We also per-                  robust. Supporting Information Fig. S11 shows a comparison of
formed restoring resolution tests to further ascertain the robustness           two Vp tomographic models obtained by this study with different
of our tomographic model (e.g. Zhao et al. 2017). The procedure                 damping parameters (5.0 and 15.0). The two models are nearly the
of the restoring test is the same as that of the checkerboard test,             same, except for some small changes in the amplitude of Vp anoma-
except for the input model. In the restoring test, the input model              lies. This result indicates that the main features of our Vp model
contains the main features of the obtained 3-D Vp model (Figs 7-                are not affected by the damping parameter if it is in a reasonable
13). The results of these resolution tests indicate that the main               range.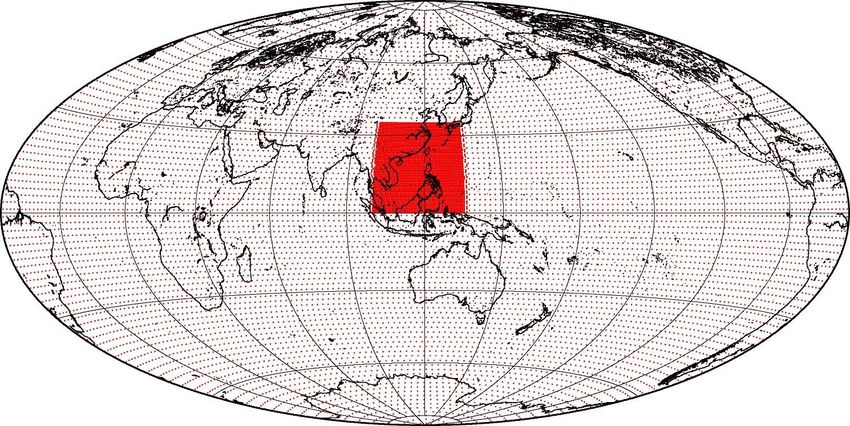
Origin of the Cenozoic intraplate volcanism in the SABP                581

                                                         a                                            b

                               SVNCVN                                     SVN CVN HN

                                                                                                                                                      Downloaded from https://academic.oup.com/gji/article/225/1/572/6044229 by guest on 26 October 2021
                                                         c                                            d

                               SVN          HN                                          HN

                                                         e                                            f

                                                         g

Figure 11. North–south vertical cross-sections of Vp tomography along the six profiles as shown in the map. CVN, volcanoes in central Vietnam; SVN,
volcanoes in southern Vietnam; HN, volcanoes in and around the Hainan Island. Other labels are the same as those in Fig. 9.

4 DISCUSSION                                                                 that the Hainan plume reaches the bottom of their models, for ex-
                                                                             ample, 1300 km depth in Huang & Zhao (2006) and 1000 km depth
Many previous tomographic studies have suggested the existence
                                                                             in Wei et al. (2012). The low-Vp anomaly under Hainan is strong
of a mantle plume beneath the Hainan Island (e.g. Supporting In-
                                                                             in the upper mantle and the MTZ but becomes weak in the lower
formation Fig. S1). However, the depth extent and geometry of the
                                                                             mantle (Wei et al. 2012), being consistent with the present Vp model
Hainan plume vary in different tomographic models. For example,
                                                                             (Figs 10 and 11). Local tomographic models have a higher resolu-
the whole-mantle model of Montelli et al. (2006) shows that the
                                                                             tion in the upper mantle and reveal the width and geometry of the
Hainan plume appears at depths of 0 to ∼1900 km, whereas Zhao
                                                                             Hainan plume. For example, the model of Lei et al. (2009a) shows
(2007) suggested that Hainan is one of 12 whole-mantle plumes
                                                                             that the Hainan plume dips toward the southeast to 300 km depth
reaching the CMB. Large-scale regional tomography models show
582 D. Zhao, G. Toyokuni and K. Kurata
a b
PV TWV PV TWV
Downloaded from https://academic.oup.com/gji/article/225/1/572/6044229 by guest on 26 October 2021
c d
PV PV TWV PV IOJ
e f
IOT
g
Figure 12. The same as Fig. 11 but along six other profiles as shown in the map. PV, volcanoes in the Philippines; TWV, volcanoes in and around Taiwan; IOJ,
Iriomote-jima submarine volcano; IOT, Iwaotori-shima volcano.
and has a diameter of ∼80 km (Supporting Information Fig. S1A); of the lithosphere, a pancake-like anomaly is formed to feed the
whereas the model of Huang (2014) shows that the Hainan plume Hainan hotspot (Xia et al. 2016). A teleseismic receiver-function
dips toward the northeast to ∼700 km depth and has a diameter study revealed a thinner MTZ inferred from a deeper 410-km dis-
of ∼200 km. Xia et al. (2016) showed a more complex geometry continuity and a shallower 660-km discontinuity, suggesting that the
of the Hainan plume (Supporting Information Fig. S1B). They re- hot Hainan plume ascends from the lower mantle and has a diameter
vealed a mushroom-like continuous low-Vp zone characterized by of ∼160 km at the Moho depth centring at the southeastern edge of
a columnar tail with a diameter of 200–300 km extending down the Leizhou Peninsula (Wei & Chen 2016).
to ∼1000 km depth beneath South China and a head spreading It should be pointed out that, in these previous seismological
laterally in and around the MTZ; further upward, the plume head studies, all the seismic stations used were located on the Hainan
is decomposed into smaller patches, and when reaching the base Island and South China, and there were no stations in the IndochinaOrigin of the Cenozoic intraplate volcanism in the SABP 583
PV PLT
䕰
PV PLT
䕰
Downloaded from https://academic.oup.com/gji/article/225/1/572/6044229 by guest on 26 October 2021
PV PLT PV PLT
䕰 䕰
Figure 13. The same as Fig. 9 but along four profiles as shown in the map. The reverse black triangle denotes location of the Philippine trench (PLT). PV,
volcanoes in the Philippines.
block and the SCS. Thus, only the velocity anomalies beneath South Zhou et al. 2006). The low-Vp anomalies in the upper mantle be-
China and the Hainan Island could be imaged. Even if velocity neath South China (Figs 9 and 11) may reflect the residual heat
anomalies exist beneath the SCS and the Indochina block, they are of the late Mesozoic to Cenozoic magmas. This feature was also
hard to be revealed by the previous seismic studies. In addition, the revealed by previous tomographic studies of the South China region
numbers of seismic stations and earthquakes, the analysing method, (e.g. Huang et al. 2010, 2015; Xia et al. 2016; Zhang et al. 2020b).
and the data number and quality are all different in the previous Our tomographic results (Figs 7–13) show that low-Vp anoma-
studies, which led to the varying images of the Hainan plume (e.g. lies prevail in the mantle beneath the SABP region. Although the
Supporting Information Fig. S1). strongest low-Vp zones exist beneath Hainan, significant low-Vp
In this work, the seismic stations used are distributed widely in anomalies are also visible in the mantle beneath Indochina, the
the study region, except for the oceanic areas including the SCS SCS, and South China. These low-Vp anomalies appear somehow
(Fig. 5). Because we have used a global data set (Fig. 4) including independent, rather than deriving from a single Hainan plume. This
both the first P-wave and four kinds of later-phase arrival times feature of seismic anomalies in the mantle corresponds well to the
(Supporting Information Fig. S2), our tomographic results of the scattered distribution of the Cenozoic intraplate basalts on the sur-
SABP region are less affected by the station distribution, as com- face (Fig. 2). We deem that a cluster of plumes existed in the Ceno-
pared with the previous studies of local and regional tomography. zoic and may still exist now in the mantle beneath the SABP, rather
Hence, our tomographic model has nearly the same resolution in the than a single plume beneath Hainan, though the Hainan plume may
mantle beneath different parts of the study region (i.e. the Hainan be the strongest feature of hot mantle upwelling beneath the SABP.
Island, South China, the SCS and the Indochina block), except for As shown in Fig. 14, such a plume cluster has been proposed to exist
the shallow upper mantle, as shown by the results of resolution tests beneath the south-central Pacific (Schubert et al. 2004). Due to the
(Supporting Information Figs S4–S9). Thus, we are able to image limited resolution of the existing whole-mantle tomographic mod-
the 3-D mantle structures beneath the SCS and Indochina, which els, a large low-Vp anomaly has been imaged in the mantle beneath
were not resolved by the previous tomographic models (e.g. Lei the south-central Pacific where six hotspot volcanoes exist, which
et al. 2009a; Huang 2014; Xia et al. 2016). is generally interpreted as the Pacific superplume (e.g. Maruyama
Although there are no active volcanoes in the continental region 1994; Zhao 2004, 2015; Montelli et al. 2006). It is possible that the
of South China, the late Mesozoic to Cenozoic volcanic rocks are superplume is actually a cluster of smaller plumes (Fig. 14), which
widely distributed there, which were produced by hot mantle up- would be distinguished when the tomographic resolution is greatly
welling associated with subduction of the Palaeo-Pacific plate (e.g. improved (Schubert et al. 2004).584 D. Zhao, G. Toyokuni and K. Kurata
(a)
(c)
Downloaded from https://academic.oup.com/gji/article/225/1/572/6044229 by guest on 26 October 2021
(b)
Figure 14. (a) Sketch of a plume cluster. (b) A cluster of plumes in a 3-D numerical model. (c) Isovelocity surfaces (encompassing negative Vs perturbations
of 1.1 per cent or more) of the Pacific superplume from a global 3-D S-wave velocity (Vs ) model. Modified from Schubert et al. (2004).
As mentioned above, so far many geochemical and petrological complex than other plumes such as those beneath Hawaii and Ice-
studies of the Cenozoic volcanics in different parts of the SABP land (e.g. Wang et al. 2012b, 2013; Gu et al. 2019; Liao et al. 2020).
have been made, such as the Hainan Island (e.g. Flower et al. 1992; Pieces of high-V anomalies are visible in the lower mantle beneath
Wang et al. 2012b; Yan et al. 2014, 2015), the Weizhou Island in the SABP (Figs 8–12), which reflect the subducted slab materials.
the Beibu gulf (e.g. Zhang et al. 2020a), Vietnam (e.g. Hoang & Zou & Fan (2010) investigated U-Th isotopes in the Hainan
Flower 1998; Hoang et al. 2019; Nguyen & Kil 2019), Thailand basalts, and their results show that the mantle upwelling rate is
(e.g. Yan et al. 2018) and the SCS basin (e.g. Yan et al. 2015, 2019;Origin of the Cenozoic intraplate volcanism in the SABP 585
Downloaded from https://academic.oup.com/gji/article/225/1/572/6044229 by guest on 26 October 2021
Figure 15. Vertical cross-sections of Vp tomography beneath (a) Hawaii, (b) Iceland, (c) Tahiti and (d) Afar hotspots (red triangles) along the four profiles as
shown on the world map. The green lines on the map denote plate boundaries. Other labels are the same as those in Fig. 9.
The distribution of seismic stations is sparse and very heteroge- to determine a whole-mantle 3-D P-wave velocity (Vp ) model be-
neous in the present study region (Fig. 5). More seismic stations neath the SABP. The main findings of this work are summarized as
should be deployed in the less instrumented areas, in particular, in follows.
the oceanic areas such as the SCS. A dense and high-quality seis-
mograph network will result in high-resolution mantle tomography (1) Low-Vp anomalies are predominant in the whole mantle be-
and so will greatly improve our understanding of the deep man- neath the SABP. The strongest low-Vp zones are revealed beneath
tle structure and origin of the Cenozoic intraplate volcanoes in the Hainan, whereas significant low-Vp anomalies also exist in the man-
SABP. tle beneath other parts of the SABP, such as the Indochina block
and the South China Sea basin.
(2) These low-Vp anomalies appear somehow independent, rather
than deriving from a single plume beneath Hainan. This feature
5 C O N C LU S I O N S
suggests that, instead of a single plume, a cluster of plumes existed
To clarify the origin of the Cenozoic intraplate volcanism in the in the Cenozoic and may still exist now in the mantle beneath the
SABP, we adopt a new method of multiscale global tomography SABP, though the Hainan plume seems the strongest one.586 D. Zhao, G. Toyokuni and K. Kurata
(3) The Hainan plume upwelling is slowing down and might be Ho, K.S., Chen, J.C. & Juang, W.S., 2000. Geochronology and geochemistry
close to exhausting its source zone, according to a geochemical of late Cenozoic basalts from the Leiqiong area, southern China, J. Asian
study. This inference is supported by our tomographic results show- Earth Sci., 18, 307–324.
ing that the low-Vp zones under Hainan are weak and intermittent Hoang, N. & Flower, M., 1998. Petrogenesis of Cenozoic basalts from Viet-
nam: implication for origins of a ‘Diffuse Igneous Province’, J. Petrol.,
in the lower mantle. The low-Vp zones in the mantle beneath other
39, 369–395.
Cenozoic intraplate volcanoes in the SABP are also weak, suggest-
Hoang, N., Flower, M. & Carlson, R., 1996. Major, trace element, and iso-
ing that those mantle plumes, if any, are also dying or already dead. topic compositions of Vietnamese basalts: interaction of hydrous EM1-
As compared with a strong single plume in a region, each plume in rich asthenosphere with thinned Eurasian lithosphere, Geochim. Cos-
a plume cluster may be small and weak, and so hard to exist long. mochim. Acta, 60, 4329–4351.
(4) The SABP is surrounded by subduction zones in all direc- Hoang, N., Shinjo, R., Phuc, L., Anh, L., Huong, T., Pecskay, Z. & Bac,
tions. Pieces of high-Vp anomalies are visible in the mantle beneath D., 2019. Pleistocene basaltic volcanism in the Krông Nô area and vicin-
the SABP, which reflect the subducted slab materials. Geochem- ity, Dac Nong Province (Vietnam), J. Asian Earth Sci., 181, 103903,
ical studies have shown that the SABP basalts contain effects of doi:10.1016/j.jseaes.2019.103903.
subducted materials. The hot mantle upwelling (a plume cluster) Huang, J., 2014. P- and S-wave tomography of the Hainan and surrounding
regions: insight into the Hainan plume, Tectonophysics, 633, 176–192.
beneath the SABP may be caused by deep subductions of the slabs
Huang, J. & Zhao, D., 2006. High-resolution mantle tomography of
Downloaded from https://academic.oup.com/gji/article/225/1/572/6044229 by guest on 26 October 2021
down to the lowermost mantle, as shown by numerical simulations.
China and surrounding regions, J. geophys. Res., 111, B09305,
doi:10.1029/2005JB004066.
Huang, X.L., Niu, Y., Xu, Y.G., Ma, J., Qiu, H. & Zhong, J., 2013.
AC K N OW L E D G E M E N T S Geochronology and geochemistry of Cenozoic basalts from eastern
Guangdong, SE China: constraints on the lithosphere evolution beneath
This work was partially supported by research grants from Japan the northern margin of the South China Sea, Contrib. Mineral. Petrol.,
Society for the Promotion of Science to DZ and GT (Nos. 19H01996 165, 437–455.
and 18K03794). Dr Xiaoyan Gu (Zhejiang University) kindly pro- Huang, Z., Wang, L., Zhao, D., Xu, M., Mi, N., Yu, D., Li, H. & Li, C.,
vided a high-resolution version of Fig. 2. We are grateful to Drs 2010. Upper mantle structure and dynamics beneath Southeast China,
Shaohong Xia, Quanshu Yan and Xiaoyan Gu for helpful discus- Phys. Earth planet. Inter., 182, 161–169.
sions. The free software package GMT (Wessel et al. 2013) was Huang, Z., Zhao, D. & Wang, L., 2015. P-wave tomography and anisotropy
used for making the figures. Prof. Gabi Laske (the Editor) and three beneath Southeast Asia: insight into mantle dynamics, J. geophys. Res.,
120, 5154–5174.
anonymous referees provided thoughtful review comments and sug-
Huang, Z., Wang, L., Xu, M., Zhao, D., Mi, N. & Yu, D., 2019. P and S wave
gestions, which have improved this paper.
tomography beneath the SE Tibetan Plateau: evidence for lithospheric
delamination, J. geophys. Res., 124, 10 292–10 308.
Iwamori, H. & Zhao, D., 2000. Melting and seismic structure beneath the
REFERENCES Northeast Japan arc, Geophys. Res. Lett., 27, 425–428.
An, A., Choi, S., Yu, Y. & Lee, D., 2017. Petrogenesis of Late Cenozoic Jia, D., Qiu, X., Hu, R. & Lu, Y., 2003. Geochemical nature of mantle
basaltic rocks from southern Vietnam, Lithos, 272, 192–204. reservoirs and tectonic setting of basalts in Beibu gulf and its adjacent
Bird, P., 2003. An updated digital model of plate boundaries, Geochem. region, J. Trop. Oceanogr., 22, 30–39.
Geophys. Geosyst., 4, 1027, doi:10.1029/2001GC000252. Kennett, B. & Engdahl, E., 1991. Traveltimes for global earthquake location
Chou, H., Kuo, B., Chiao, L., Zhao, D. & Hung, S., 2009. Tomography of the and phase identification, Geophys. J. Int., 105, 429–465.
westernmost Ryukyu subduction zone and the serpentinization of the fore- Lay, T. & Garnero, E., 2011. Deep mantle seismic modeling and imaging,
arc mantle, J. geophys. Res., 114, B12301, doi:10.1029/2008JB006192. Annu. Rev. Earth planet. Sci., 39, 91–123.
Engdahl, E.R., Di Giacomo, D., Sakarya, B., Gkarlaouni, C., Harris, J. Lebedev, S. & Nolet, G., 2003. Upper mantle beneath Southeast
& Storchak, D., 2020. ISC-EHB 1964–2016, an improved data set for Asia from S velocity tomography, J. geophys. Res., 108, 2048,
studies of Earth structure and global seismicity, Earth Space Sci., 7, doi:10.1029/2000JB000073.
e2019EA000897. Lei, J. & Zhao, D., 2016. Teleseismic P-wave tomography and man-
Fan, J. & Zhao, D., 2018. Evolution of the southern segment of the Philip- tle dynamics beneath eastern Tibet, Geochem. Geophys. Geosyst., 17,
pine Trench: constraints from seismic tomography, Geochem. Geophys. 1861–1884.
Geosyst., 19, 4612–4627. Lei, J., Zhao, D., Steinberger, B., Wu, B., Shen, F. & Li, Z., 2009a. New
Fan, J. & Zhao, D., 2019. P-wave anisotropic tomography of the central and seismic constraints on the upper mantle structure of the Hainan plume,
southern Philippines, Phys. Earth planet. Inter., 286, 154–164. Phys. Earth planet. Inter., 173, 33–50.
Fan, J., Zhao, D. & Dong, D., 2016. Subduction of a buoyant plateau at Lei, J., Zhao, D. & Su, Y., 2009b. Insight into the origin of the
the Manila Trench: tomographic evidence and geodynamic implications, Tengchong intraplate volcano and seismotectonics in southwest China
Geochem. Geophys. Geosyst., 17, 571–586. from local and teleseismic data, J. geophys. Res., 114, B05302,
Fan, J., Zhao, D., Dong, D. & Zhang, G., 2017. P-wave tomography of doi:10.1029/2008JB005881.
subduction zones around the central Philippines and its geodynamic im- Li, C. & van der Hilst, R., 2010. Structure of the upper mantle and transition
plications, J. Asian Earth Sci., 146, 76–89. zone beneath Southeast Asia from traveltime tomography, J. geophys.
Fedorov, P.I. & Koloskov, A.V., 2005. Cenozoic volcanism of Southeast Asia, Res., 115, B07308.
Petrology, 13, 352–380. Li, C.F. et al., 2014. Ages and magnetic structures of the South China Sea
Flower, M., Zhang, M., Chen, C., Tu, K. & Xie, G., 1992. Magmatism in constrained by deep tow magnetic surveys and IODP Expedition 349,
the South China Basin 2. Post-spreading Quaternary basalts from Hainan Geochem. Geophys. Geosyst., 15, 4958–4983.
Island, south China, Chem. Geol., 97, 65–87. Li, N.S., Yan, Q., Chen, Z. & Shi, X., 2013. Geochemistry and petrogenesis of
Gu, X.Y., Wang, P.Y., Kuritani, T., Hanski, E., Xia, Q.K. & Wang, Q.Y., Quaternary volcanism from the islets in the eastern Beibu Gulf: evidence
2019. Lower water content in the mantle source of the Hainan plume as a for Hainan plume, Acta Oceanol. Sin., 32, 40–49.
factor inhibiting the formation of a large igneous province, Earth planet. Liao, R., Zhu, H., Deng, J., Zhang, L., Li, H., Li, C., Liu, H. & Sun,
Sci. Lett., 515, 221–230. W., 2020. Zinc isotopic systematics of the South China Sea basalts and
Hall, R. & Spakman, W., 2015. Mantle structure and tectonic history of SE implications for its behavior during plate subduction, Chem. Geol., 541,
Asia, Tectonophysics, 658, 14–45. 119582, doi:10.1016/j.chemgeo.2020.119582.Origin of the Cenozoic intraplate volcanism in the SABP 587
Liu, E.T., Wang, H., Uysal, T., Zhao, J., Wang, X., Feng, Y. & Pan, S., of a young mantle plume: implications for potential linkages between
2017. Paleogene igneous intrusion and its effect on thermal maturity of plume and plate tectonics, Earth planet. Sci. Lett., 377, 248–259.
organic-rich mudstones in the Beibuwan Basin, South China Sea, Mar. Wang, Z., Zhao, D., Wang, J. & Kao, H., 2006. Tomographic evidence for
Pet. Geol., 86, 733–750. the Eurasian lithosphere subducting beneath South Taiwan, Geophys. Res.
Ma, J., Tian, Y., Zhao, D., Liu, C. & Liu, T., 2019. Mantle dynamics of Lett., 33, L18306, doi:10.1029/2006GL027166.
Western Pacific and East Asia: new insights from P-wave anisotropic Wei, S. & Chen, Y., 2016. Seismic evidence of the Hainan mantle plume
tomography, Geochem. Geophys. Geosyst., 20, 3628–3658. by receiver function analysis in southern China, Geophys. Res. Lett., 43,
Maruyama, S., 1994. Plume tectonics, J. Geol. Soc. Japan, 100, 24–49. 8978–8985.
Montelli, R., Nolet, G., Dahlen, F. & Masters, G., 2006. A catalogue of deep Wei, W. & Zhao, D., 2020. Intraplate volcanism and mantle dynamics of
mantle plumes: new results from finite-frequency tomography, Geochem. Mainland China: new constraints from shear-wave tomography, J. Asian
Geophys. Geosyst., 7, Q11007, doi:10.1029/2006GC001248. Earth Sci., 188, 104103, doi:10.1016/j.jseaes.2019.104103.
Nguyen, T. & Kil, Y., 2019. The evolution of the lithospheric mantle beneath Wei, W., Xu, J., Zhao, D. & Shi, Y., 2012. East Asia mantle tomography:
Ia Bang, Pleiku plateau, Central Vietnam, J. Asian Earth Sci., 174, 232– new insight into plate subduction and intraplate volcanism, J. Asian Earth
244. Sci., 60, 88–103.
Paige, C. & Saunders, M., 1982. LSQR: an algorithm for sparse linear Wei, W., Zhao, D., Xu, J., Wei, F. & Liu, G., 2015. P and S wave tomography
equations and sparse least squares, ACM Trans. Math. Softw., 8, 43–71. and anisotropy in Northwest Pacific and East Asia: constraints on stagnant
Qian, S., Zhou, H., Zhang, L. & Cheng, R., 2020. Mantle heterogene- slab and intraplate volcanism, J. geophys. Res., 120, 1642–1666.
Downloaded from https://academic.oup.com/gji/article/225/1/572/6044229 by guest on 26 October 2021
ity beneath the South China Sea: chemical and isotopic evidence for Wessel, P., Smith, W., Scharroo, R., Luis, J. & Wobbe, F., 2013. Generic
contamination of ambient asthenospheric mantle, Lithos, 354, 105355, Mapping Tools: improved version released, EOS, Trans. Am. geophys.
doi:10.1016/j.lithos.2019.105335. Un., 94, 409–410.
Ren, J.B., Wang, L.L., Yan, Q., Shi, X., Liao, L. & Fang, N., 2013. Geo- Wu, H., Tsai, Y., Lee, T., Lo, C., Hsieh, C. & Van Toan, D., 2004. 3-D shear
chemical characteristics and its geological implications for basalts in wave velocity structure of the crust and upper mantle in South China Sea
volcanicalstic rock from Daimao seamount, Earth Sci. J. China Univ. and its surrounding regions by surface wave dispersion analysis, Mar.
Geosci., 38, 10–20. Geophys. Res., 25, 5–27.
Sleep, N., 1990. Hotspots and mantle plumes: some phenomenology. J. Wu, Y., Shyu, J., Chang, C., Zhao, L., Nakamura, M. & Hsu, S., 2009. Im-
geophys. Res., 95, 6715–6736. proved seismic tomography offshore northeastern Taiwan: implications
Sleep, N., 2006. Mantle plumes from top to bottom, Earth-Sci. Rev., 77, for subduction and collision processes between Taiwan and the southern-
231–271. most Ryukyu, Geophys. J. Int., 178, 1042–1054.
Schubert, G., Masters, G., Olson, P. & Tackley, P., 2004. Superplumes or Xia, S. & Zhao, D., 2014. Late Mesozoic magmatic plumbing system in
plume clusters? Phys. Earth planet. Inter., 146, 147–162. the onshore-offshore area of Hong Kang: insight from 3-D active-source
Shi, X. & Yan, Q., 2011. Geochemistry of Cenozoic magmatism in the seismic tomography, J. Asian Earth Sci., 96, 46–58.
South China Sea and its tectonic implications, Mar. Geol. Quat. Geol., Xia, S., Zhao, D., Sun, J. & Huang, H., 2016. Teleseismic imaging of the
31, 59–72. mantle beneath southernmost China: new insights into the Hainan plume,
Simkin, T. & Siebert, L., 1994. Volcanoes of the World, pp. 1–368, Geo- Gondwana Res., 36, 33–43.
science Press. Xia, S., Zhou, P., Zhao, D. & Cao, J., 2020. Seismogenic structure
Song, J., Kim, S., Rhie, J., Lee, S., Kim, Y. & Kang, T., 2018. Imaging of in the source zone of the 1918 M7.5 NanAo earthquake in the
lithospheric structure beneath Jeju Volcanic Island by teleseismic travel- northern South China Sea, Phys. Earth planet. Inter., 302, 106472,
time tomography, J. geophys. Res., 123, 6784–6801. doi:10.1016/j.pepi.2020.106472.
Tang, Q. & Zheng, C., 2013. Crust and upper mantle structure and its tectonic Yan, Q., Shi, X., Wang, K., Bu, W. & Xiao, L., 2008. Major element, trace
implications in the South China Sea and adjacent regions, J. Asian Earth element, Sr–Nd–Pb isotopic studies of Cenozoic alkali basalts from the
Sci., 62, 510–525. South China Sea, Sci. China D, 51, 550–566.
Tatsumi, Y., 1989. Migration of fluid phases and genesis of basalt magmas Yan, Q., Shi, X. & Castillo, P., 2014. The late Mesozoic-Cenozoic tectonic
in subduction zones, J. geophys. Res., 94, 4697–4707. evolution of the South China Sea: a petrologic perspective, J. Asian Earth
Toyokuni, G., Zhao, D. & Chen, K.H., 2016. Tomography of the source zone Sci., 85, 178–201.
of the 2016 South Taiwan earthquake, Geophys. J. Int., 207, 635–643. Yan, Q., Castillo, P., Shi, X., Wang, L., Liao, L. & Ren, J., 2015. Geochem-
Toyokuni, G., Matsuno, T. & Zhao, D., 2020a. P wave tomography beneath istry and petrogenesis of volcanic rocks from Daimao Seamount (South
Greenland and surrounding regions: 1. Crust and upper mantle, J. geophys. China Sea) and their tectonic implications, Lithos, 218, 117–126.
Res., 125, e2020JB019837. Yan, Q. et al., 2018. Hainan mantle plume produced late Cenozoic basaltic
Toyokuni, G., Matsuno, T. & Zhao, D., 2020b. P wave tomography beneath rocks in Thailand, Southeast Asia, Sci. Rep., 8, 2640, doi:10.1038/s41598-
Greenland and surrounding regions: 2. Lower mantle, J. geophys. Res., 018-20712-7.
125, e2020JB019839. Yan, Q., Straub, S. & Shi, X., 2019. Hafnium isotopic constraints on the
Tu, K., Flower, M., Carlson, R., Zhang, M. & Xie, G., 1991. Sr, Nd, and Pb origin of late Miocene to Pliocene seamount basalts from the South
isotopic compositions of Hainan basalts (south China): implications for a China Sea and its tectonic implications, J. Asian Earth Sci., 171,
subcontinental lithosphere Dupal source, Geology, 19, 567–569. 162–168.
Tu, K., Flower, M., Carlson, R., Xie, G., Chen, C. & Zhang, M., 1992. Yang, S.Y. & Fang, N., 2015. Geochemical variation of volcanic rocks from
Magmatism in the South China Basin, 1. Isotopic and trace element the South China Sea and neighboring land: implication for magmatic
evidence for an endogenous Dupal mantle component, Chem. Geol., 97, process and mantle structure, Acta Oceanol. Sin., 34, 112–124.
47–63. Yu, M., Yan, Y., Huang, C., Zhang, X., Tian, Z., Chen, W. & Santosh, M.,
Wang, K.L. et al., 2012a. Age and geochemical characteristics of Paleo- 2018. Opening of the South China Sea and upwelling of the Hainan plume,
gene basalts drilled from western Taiwan: records of initial rifting at the Geophys. Res. Lett., 45, 2600–2609.
southeastern Eurasian continental margin, Lithos, 155, 426–441. Yuan, L., Yan, Q., Shi, X., Zhang, H. & Liu, X., 2019. In situ LA-ICP-MS
Wang, X.C., Li, Z., Li, X., Li, J., Liu, Y., Long, W., Zhou, J. & Wang, analysis of minerals hosted by late Cenozoic basaltic rocks from Thailand,
F., 2012b. Temperature, pressure, and composition of the mantle source Minerals, 9, 446, doi:10.3390/min9070446.
region of Late Cenozoic basalts in Hainan Island, SE Asia: a consequence Zhang, G.L., Luo, Q., Zhao, J., Jackson, M., Guo, L. & Zhong, L., 2018.
of a young thermal mantle plume close to subduction zones?, J. Petrol., Geochemical nature of sub-ridge mantle and opening dynamics of the
53, 177–233. South China Sea, Earth planet. Sci. Lett., 489, 145–155.
Wang, X.C., Li, Z., Li, X., Li, J., Xu, Y. & Li, X., 2013. Identification of an Zhang, N. & Li, Z.X., 2018. Formation of mantle “lone plumes” in the global
ancient mantle reservoir and young recycled materials in the source region downwelling zone—a multiscale modelling of subduction-controlled588 D. Zhao, G. Toyokuni and K. Kurata
plume generation beneath the South China Sea, Tectonophysics, 723, the checkerboard test. The recovery rate is defined as the ratio of
1–13. the recovered and input amplitudes of Vp anomaly at each grid
Zhang, Y., Yu, K., Fan, T., Yue, Y., Wang, R., Jiang, W., Xu, S. & Wang, node. The grey and white colours denote recovery rates of 0–30
Y., 2020a. Geochemistry and petrogenesis of Quaternary basalts from and 30–100 per cent, respectively, and the pattern of Vp anomalies
Weizhou Island, northwestern South China Sea: evidence for the Hainan
(i.e. positive or negative) is correctly recovered. The black colours
plume, Lithos, 362, 105493.
denote that the pattern of Vp anomalies is wrongly recovered.
Zhang, Y., Yao, H., Xu, M. & Liu, B., 2020b. Upper mantle shear wave veloc-
ity structure of southeastern China: seismic evidence for magma activities Figure S5. The same as Fig. S4 but for another checkerboard test.
in the late Mesozoic to the Cenozoic, Geochem. Geophys. Geosyst., 21, In this test, the lateral grid interval is ∼150 km.
e2020GC009103. Figure S6. (a) East–west vertical cross-section of Vp tomography
Zhao, D., 2001. Seismic structure and origin of hotspots and mantle plumes, along the profile as shown in the map (b). Red and blue colours
Earth planet. Sci. Lett., 192, 251–265. denote low- and high-Vp perturbations, respectively, whose scale
Zhao, D., 2004. Global tomographic images of mantle plumes and subduct- is shown on the left. Red triangles and the black bar denote active
ing slabs: insight into deep Earth dynamics, Phys. Earth planet. Inter., volcanoes and the land area, respectively. The two black lines denote
146, 3–34. the 410 and 660 km discontinuities. (c) Distribution of hit counts
Zhao, D., 2007. Seismic images under 60 hotspots: search for mantle plumes,
(i.e. the number of rays passing around each grid node) and (d)
Gondwana Res., 12, 335–355.
Downloaded from https://academic.oup.com/gji/article/225/1/572/6044229 by guest on 26 October 2021
Zhao, D., 2015. Multiscale Seismic Tomography, pp. 1–304, Springer.
recovery rate along the same profile, whose scales are shown on
Zhao, D., Hasegawa, A. & Horiuchi, S., 1992. Tomographic imaging of P the right of each panel. The recovery rate is defined as the ratio
and S wave velocity structure beneath northeastern Japan, J. geophys. of the recovered and input amplitudes of Vp anomaly at each grid
Res., 97, 19 909–19 928. node. The grey and white colours denote recovery rates of 0–30
Zhao, D., Yu, S. & Ohtani, E., 2011. East Asia: seismotectonics, magmatism and 30–100 per cent, respectively, and the pattern of Vp anomalies
and mantle dynamics, J. Asian Earth Sci., 40, 689–709. (i.e. positive or negative) is correctly recovered. The black colours
Zhao, D., Fujisawa, M. & Toyokuni, G., 2017. Tomography of the subducting denote that the pattern of Vp anomalies is wrongly recovered. PhV,
Pacific slab and the 2015 Bonin deepest earthquake (Mw 7.9), Sci. Rep., volcanoes in the Philippines.
7, 44487, doi:10.1038/srep44487. Figure S7. The same as Fig. S6 but along the north–south profile
Zhou, X., Sun, T., Shen, W., Shu, L. & Niu, Y., 2006. Petrogenesis of
as shown in the map.
Mesozoic granitoids and volcanic rocks in South China: a response to
tectonic evolution, Episodes, 29, 26–33.
Figure S8. The same as Fig. S6 but along another east–west profile
Zou, H. & Fan, Q., 2010. U-Th isotopes in Hainan basalts: implications for as shown in the map. IOT, the Iwaotori-shima volcano.
sub-asthenospheric origin of EM2 mantle endmember and the dynamics Figure S9. The same as Fig. S6 but along another north–south pro-
of melting beneath Hainan Island, Lithos, 116, 145–152. file as shown in the map. The black reverse triangle denotes location
of the Ryukyu trench (RKT). PV, volcanoes in the Philippines; IOJ,
the Iriomote-jima submarine volcano; IOT, the Iwaotori-shima vol-
S U P P O RT I N G I N F O R M AT I O N cano.
Supplementary data are available at GJ I online. Figure S10. Map views showing the input model (upper panels) and
output results (lower panels) of a synthetic test. The input model
Figure S1. (a) P-wave tomographic model by Lei et al. (2009a). includes three low-Vp anomalies beneath Hainan, Indochina and the
(b) P-wave tomographic model by Xia et al. (2016). (c) S-wave South China Sea. The layer depth is shown atop each of the upper
tomographic model by Levedev & Nolet (2003). panels. Red and blue colours denote low and high Vp perturbations,
Figure S2. Schematic illustration of ray paths of P, pP, PP, PcP respectively, whose scale is shown on the right. The test results show
and Pdiff waves. The star symbol denotes a hypocentre. The cross that the three low-Vp anomalies are generally well recovered.
symbols denote seismic stations. Modified from Zhao (2015). Figure S11. Comparison of two Vp tomographic models obtained
Figure S3. Map views showing the distribution of P-wave rays (grey by this study with a damping parameter of 5.0 (a) and 15.0 (b).
lines) in different depth ranges beneath the study region. The depth The layer depth is shown in each map. Red and blue colours denote
range is shown above each map. The red triangles denote active arc low- and high-Vp perturbations, respectively, whose scale is shown
volcanoes and Cenozoic intraplate volcanoes. on the right. Red triangles denote active volcanoes. Blue squares
Figure S4. Map views showing results of a checkerboard resolution denote seismic stations used.
test at four selected depths. The layer depths are shown at the top. In
this test, the lateral grid interval is ∼250 km. The upper panels show Please note: Oxford University Press is not responsible for the con-
the input checkerboard model, whereas the middle panels show the tent or functionality of any supporting materials supplied by the
recovered images. Open and solid circles denote high and low Vp authors. Any queries (other than missing material) should be di-
perturbations, respectively, whose scale is shown on the right. The rected to the corresponding author for the paper.
lower panels show the distribution of recovery rate estimated fromYou can also read