DEFORMATION OF NACOF3 PEROVSKITE AND POST-PEROVSKITE UP TO 30 GPA AND 1013 K: IMPLICATIONS FOR PLASTIC DEFORMATION AND TRANSFORMATION MECHANISM ...
←
→
Page content transcription
If your browser does not render page correctly, please read the page content below
Eur. J. Mineral., 33, 591–603, 2021
https://doi.org/10.5194/ejm-33-591-2021
© Author(s) 2021. This work is distributed under
the Creative Commons Attribution 4.0 License.

        Deformation of NaCoF3 perovskite and post-perovskite up
        to 30 GPa and 1013 K: implications for plastic deformation
                     and transformation mechanism
           Jeffrey P. Gay1 , Lowell Miyagi2 , Samantha Couper2 , Christopher Langrand1 , David P. Dobson3 ,
                                    Hanns-Peter Liermann4 , and Sébastien Merkel1
              1 Univ. Lille, CNRS, INRA, ENSCL, UMR 8207 - UMET - Unité Matériaux et Transformations,
                                                    59000 Lille, France
                2 Department of Geology and Geophysics, University of Utah, Salt Lake City, UT 84108, USA
             3 Department of Earth Sciences, University College London, Gower Street, London WC1E 6BT, UK
                           4 Deutsches Elektronen-Synchrotron (DESY), 22607 Hamburg, Germany

                   Correspondence: Jeffrey P. Gay (jeffrey-phillip.gay@univ-lille.fr) and Sébastien Merkel
                                              (sebastien.merkel@univ-lille.fr)
            Received: 11 May 2021 – Revised: 9 August 2021 – Accepted: 19 August 2021 – Published: 30 September 2021

       Abstract. Texture, plastic deformation, and phase transformation mechanisms in perovskite and post-perovskite
       are of general interest for our understanding of the Earth’s mantle. Here, the perovskite analogue NaCoF3 is de-
       formed in a resistive-heated diamond anvil cell (DAC) up to 30 GPa and 1013 K. The in situ state of the sample,
       including crystal structure, stress, and texture, is monitored using X-ray diffraction. A phase transformation
       from a perovskite to a post-perovskite structure is observed between 20.1 and 26.1 GPa. Normalized stress drops
       by a factor of 3 during transformation as a result of transient weakening during the transformation. The per-
       ovskite phase initially develops a texture with a maximum at 100 and a strong 010 minimum in the inverse
       pole figure of the compression direction. Additionally, a secondary weaker 001 maximum is observed later
       during compression. Texture simulations indicate that the initial deformation of perovskite requires slip along
       (100) planes with significant contributions of {110} twins. Following the phase transition to post-perovskite, we
       observe a 010 maximum, which later evolves with compression. The transformation follows orientation relation-
       ships previously suggested where the c axis is preserved between phases and hh0 vectors in reciprocal space
       of post-perovskite are parallel to [010] in perovskite, which indicates a martensitic-like transition mechanism.
       A comparison between past experiments on bridgmanite and current results indicates that NaCoF3 is a good
       analogue to understand the development of microstructures within the Earth’s mantle.

1   Introduction                                                  development of crystallographic preferred orientation (Ya-
                                                                  mazaki and Karato, 2007; McCormack et al., 2011; Hunt et
Earth’s lower mantle is believed to be composed predom-           al., 2016), also known as texture, which can lead to seismic
inantly of bridgmanite, i.e., (Mg,Fe)SiO3 in the perovskite       anisotropy (Cobden et al., 2015; Walker et al., 2018b). Tex-
structure (Tschauner et al., 2014). At deep-lower-mantle con-     ture development can also be studied experimentally (Wenk
ditions, this composition transforms from the perovskite to       et al., 2006; Merkel et al., 2007; Miyagi et al., 2010) and
the post-perovskite structure (Murakami et al., 2004; Oganov      is thought to be a reasonable approximation for seismic
and Ono, 2004). The deformation and transformation of per-        anisotropy observed within the mantle (Wookey et al., 2002;
ovskite and post-perovskite phases are important for a num-       Nowacki et al., 2010; Ferreira et al., 2019).
ber of processes in the deep Earth (Čížková et al., 2010;           Seismic anisotropy within the Earth’s deep mantle is com-
Nakagawa and Tackley, 2011; Tackley, 2012), including the         monly measured using shear wave splitting. This shear wave

Published by Copernicus Publications on behalf of the European mineralogical societies DMG, SEM, SIMP & SFMC.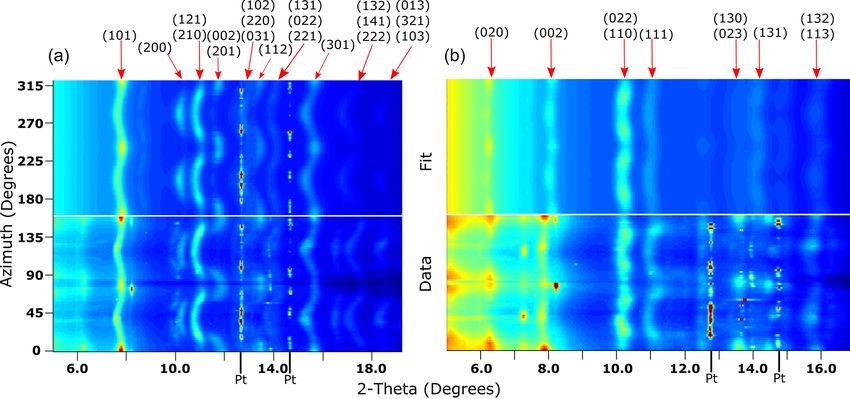
592                            J. P. Gay et al.: Deformation and transformation of NaCoF3 perovskite and post-perovskite

splitting can be used to characterize mantle strain fields,         in (Mg,Fe)SiO3 or MgGeO3 (Miyagi et al., 2008). Numerical
which in turn allows for mantle structures to be observed           modeling has also been implemented in order to investigate
(Savage, 1999). There are many regions within the lower             deformation mechanisms in perovskite and post-perovskite
mantle, past 1000 km, that are seismically isotropic (Pan-          (e.g., Ferré et al., 2007; Carrez et al., 2007; Mainprice et
ning and Romanowicz, 2006; Beghein et al., 2006) even               al., 2008; Metsue et al., 2009; Boioli et al., 2017; Carrez et
though numerous experimental studies demonstrate lower-             al., 2017). This allows for the study of not only the effect
mantle phases of bridgmanite and ferropericlase are highly          of chemistry, pressure, and temperature but also the effects
anisotropic and even increase in anisotropy with depth (Chen        of strain rate on perovskite and post-perovskite deformation,
et al., 1998; Mainprice et al., 2000). In the case of the D00 re-   which can not be measured in experiments using current ex-
gion, where a phase transformation from perovskite to post-         perimental techniques.
perovskite could take place (Murakami et al., 2004; Hern-              Questions remain regarding compression textures, de-
lund et al., 2005; Koelemeijer et al., 2018), strong anisotropy     formation mechanisms, and phase transformation mecha-
is observed (Garnero et al., 2004; Panning and Romanow-             nisms in perovskites and post-perovskites. The comparison
icz, 2006; Wookey and Kendall, 2007). It is difficult, how-         of NaCoF3 to (Mg,Fe)SiO3 in deformation experiments is
ever, to determine the physical origin of anisotropy (i.e., crys-   essential in order to determine if NaCoF3 is a relevant ex-
tallographic preferred orientation or periodic layering) due        perimental analogue. Additionally, understanding how trans-
to poor azimuthal sampling of D00 (Romanowicz and Wenk,             formation mechanisms vary between analogues and natu-
2017). Recent studies (Nowacki et al., 2013; Koelemeijer et         ral compositions, including their effects on deformation and
al., 2018; Pisconti et al., 2019) show that the effect of post-     transformation textures, can inform us on the validity of ana-
perovskite is observable in seismic data, but the details of        logues and their ability to predict the behavior of natural
the transformation between bridgmanite and post-perovskite          samples when direct studies of (Mg,Fe)SiO3 cannot be per-
have an impact on the observed data (Pisconti et al., 2019;         formed. Here we use a resistive-heated radial DAC com-
Walker et al., 2018a) and require further experimental char-        bined with synchrotron radiation at pressures and temper-
acterization. In order to characterize how bridgmanite and          atures between 1.1 and 29.6 GPa and 300 and 1013 K, re-
post-perovskite deform within the lower mantle and what             spectively, to observe in situ texture development and phase
mechanisms are responsible for the transformations of bridg-        change from a perovskite to a post-perovskite structure in
manite to post-perovskite, it is necessary to utilize experi-       NaCoF3 . We use these data to model plastic deformation and
mental mineral physics.                                             deformation mechanisms in perovskite. We find (100)h011i
   The study of the transition of perovskite to post-perovskite     slip and {110}h110i twins to be the most active deforma-
requires the application of pressure (P ). Several experimen-       tion mechanisms during initial deformation of the perovskite
tal methods can be used to study deformation and phase              phase. Texture measurements in these experiments are used
transformation in situ at high pressure, such as the diamond        to model orientation relationships and transformation mech-
anvil cell (DAC) (Wenk et al., 2004b; Miyagi and Wenk,              anisms between perovskites and post-perovskites. We de-
2016), the multi-anvil press (Cordier et al., 2004; Walte et        termine that the transformation of NaCoF3 perovskite to
al., 2009; Wang et al., 2013; Tsujino et al., 2016; Hunt et al.,    post-perovskite is martensitic in nature, with orientation re-
2016), and the rotational Drickamer apparatus (Girard et al.,       lationships matching those of NaNiF3 outlined in Dobson
2016). For many years, deformation experiments in the DAC           et al. (2013). Normalized stress measurements also demon-
were limited to ambient temperatures (T ). Recent develop-          strate a stronger perovskite phase than post-perovskite phase
ments, however, allow for the combined application of pres-         in NaCoF3 . Overall, these results can help us to better under-
sure and temperatures up to 1900 K (Liermann et al., 2009;          stand the deformation and phase transformation in perovskite
Miyagi et al., 2013; Immoor et al., 2020), which we will use        and post-perovskite phases and will lead to greater knowl-
here. In addition, structural analogues of (Mg,Fe)SiO3 can          edge of deep mantle dynamics.
undergo perovskite to post-perovskite phase transitions at
lower pressures and temperatures, making quantitative defor-
mation experiments less challenging. Several experiments on         2     Experimental details
analogues have resulted in perovskite and/or post-perovskite
deformation and transformation textures (Niwa et al., 2007;         2.1    High-P –T experiments
Okada et al., 2010; Dobson et al., 2011; Miyagi et al., 2011;
Dobson et al., 2013). Furthermore, deformation experiments          In this study, we use a graphite resistive-heated radial DAC
on analogues can be used to gain insight on the plasticity          apparatus to perform a uniaxial compression experiment on
of perovskite phases and can be compared to the behavior            a polycrystalline sample of NaCoF3 . Experiments were per-
of (Mg,Fe)SiO3 at mantle conditions (e.g., Fig. 10 in Wang          formed on beamline P02.2 of the PETRA III facility at
et al., 2013). Not all analogues behave in the same manner,         the Deutsches Elektronen Synchrotron (DESY) in Hamburg,
however. Deformation textures in CaIrO3 post-perovskite,            Germany. By utilizing synchrotron X-ray diffraction in ra-
for instance, are known to be different from those measured         dial geometry, the stress state and texture of the sample can

Eur. J. Mineral., 33, 591–603, 2021                                                   https://doi.org/10.5194/ejm-33-591-2021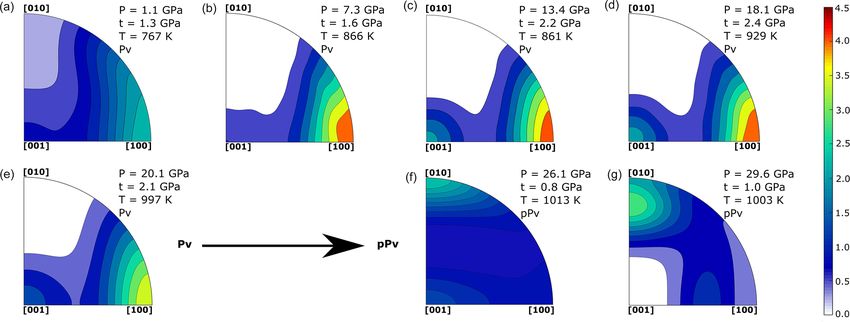
J. P. Gay et al.: Deformation and transformation of NaCoF3 perovskite and post-perovskite                                         593

be analyzed in situ at high pressure and temperature. An inci-
dent monochromatic X-ray beam focused to 5.8 µm× 3.2 µm
and PerkinElmer XRD 1621 detector with 200 µm× 200 µm
pixel size were used to capture the diffraction images. A
CeO2 standard from the National Institute of Standards and
Technology (NIST; 674b) was used for calibration in order
to correct for detector tilt and calculate a sample to detector
distance of 438.35 mm. Wavelength was fixed at 0.4908 Å.
   Powdered NaCoF3 perovskite from the study of Dobson et
al. (2011) was loaded into an X-ray transparent boron epoxy
gasket with an 80 µm diameter hole. A platinum flake was
also loaded to be used as a pressure marker, using the ther-
mal equation of state parameters of Zha et al. (2008) and the
EosFit program (Gonzalez-Platas et al., 2016).
   Details on the synchrotron beamline setup and DAC can
be found in Liermann et al. (2015) and Immoor et al. (2020).
The diamonds we used had a 300 µm culet size. Two thin              Figure 1. Pressure–temperature path during the experiment. Start of
graphite layers in contact with the anvils and surrounding the      high-temperature compression is at 1.1 GPa and 868 K. Perovskite
diamond tips were used for a restive heater, while two type-        to post-perovskite transformation is observed between 20.1 and
                                                                    26.1 GPa.
R thermocouples were used to monitor temperature. One of
the thermocouples is located between both graphite heaters
and the second on the diamond anvil next to the culet. Re-
ported temperatures are the average between both thermo-            Fig. 2. Graphite peaks become more visible as pressure in-
couple measurements. The graphite sheets contained a small          creases (e.g., Fig. 2b at 2θ values 6.0, 8.2, 13.4, and 14.6◦ ).
window that was carved out of the graphite in order to al-          This is due to the closure of the window carved into the heater
low the X-rays to pass through the heater. The DAC assem-           as the experiment proceeds. We exclude these regions in ad-
bly was placed within a vacuum chamber maintaining a pres-          dition to the 2θ ranges where platinum is overlapping during
sure of 10−3 mbar in order to prevent oxidation during heat-        the refinement process.
ing. A water cooling system kept at low temperatures was               Diffraction background was fit using polynomial func-
used to prevent the assembly from overheating. The sample           tions. Structural parameters of NaCoF3 were obtained from
was compressed using a gas membrane system, while radial            Shirako et al. (2012), and cell parameters and B factors
diffraction images were simultaneously collected.                   were further refined using the data. Crystallite size and mi-
   The sample was pre-compressed up to 3.4 GPa at ambi-             crostrains were refined using the Popa line-broadening size–
ent temperature to close the sample chamber. Temperature            strain model (Popa, 1998).
was then increased to 873 K over the course of 3 h. NaCoF3             Differential stress in NaCoF3 was fit using a model that
was compressed to a maximum pressure of 30.8 GPa and                relies on the elastic theory of Singh et al. (1998), which as-
heated at temperatures ranging from 861 to 1013 K (Table 1,         sumes isotropic elastic properties and fits a value for the dif-
Fig. 1). Diamonds broke at 30.8 GPa, marking the end of the         ferential stress according to the displacement of peak posi-
experiment. We observe the transformation of NaCoF3 per-            tions with orientations. In the model of Singh et al. (1998),
ovskite to a post-perovskite structure (e.g., Fig. 1) between       the average lattice strain across the sample is proportional to
20.1 and 26.1 GPa. During the first stage of compression            stress using t = 6GhQ(hkl)i, where G is the shear modulus
from 1.1 GPa to 14.8 GPa temperatures are held constant be-         of the polycrystal sample and hQ(hkl)i is the average lattice
tween 861 and 868 K. Thereafter, temperature is increased           strain across the sample. The MAUD fit requires an input
to 997 K at 20.1 GPa just before the transition. The post-          value of the shear modulus, which is unknown for NaCoF3
perovskite phase is then visible in the diffraction pattern at      perovskite and post-perovskite at high temperature. In view
26.1 GPa and 1013 K, although some perovskite may still be          of that limitation we use a constant value of G = 44 GPa, ex-
visible. Data files used can be found online (Gay et al., 2021).    tracted from first-principles calculations on a cubic NaCoF3
                                                                    perovskite at zero pressure and temperature (Chenine et al.,
2.2   Data analysis                                                 2018). The t/G values are then recalculated from the fitted t
                                                                    and the fixed G values. Do note, however, the G value used
Diffraction images were integrated over 5◦ azimuthal arcs           when refining t in MAUD has no impact on the final t/G
into 72 spectra and analyzed using the program MAUD (ma-            ratio. Also note that MAUD allows for extraction of individ-
terial analysis using diffraction) (Lutterotti et al., 1997) fol-   ual Q(hkl) for each diffraction peak, but the quality of our
lowing the general refinement procedure outlined in Wenk            data and the number of overlapping peaks for perovskite and
et al. (2014). An example of MAUD refinement is shown in            post-perovskite structures do not allow us to do so.

https://doi.org/10.5194/ejm-33-591-2021                                                       Eur. J. Mineral., 33, 591–603, 2021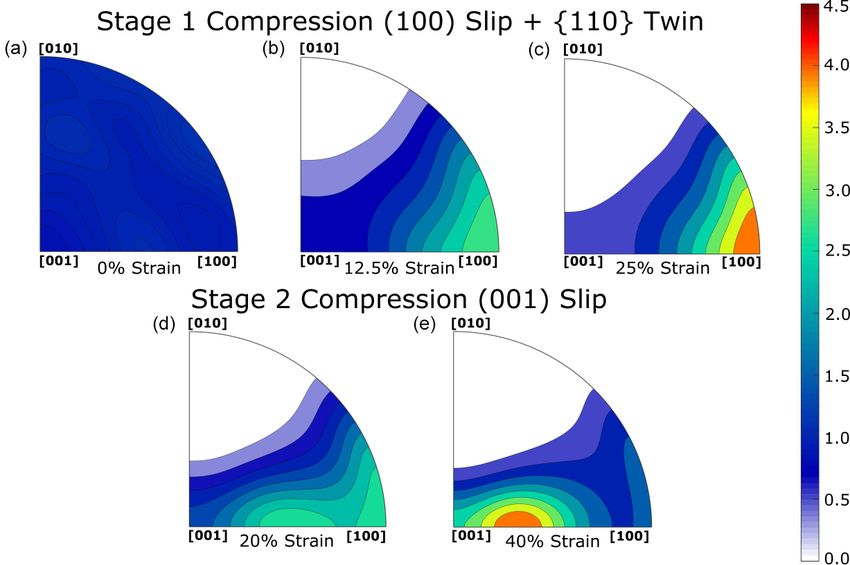
594                             J. P. Gay et al.: Deformation and transformation of NaCoF3 perovskite and post-perovskite

Table 1. Image number, pressure (P ), temperature (T ), lattice parameters, normalized stress, and crystallite size (CS) measured in the
experiment. Numbers in parenthesis for temperatures are uncertainties on the last digits, determined from the difference in readings of both
thermocouples. Errors are estimated to be 0.07 and 0.1 Å3 for perovskite and post-perovskite unit cell volumes, respectively, 0.002 Å for
unit cell parameters, 0.0002 for normalized stresses, and approximately 200 Å3 for crystallite sizes. NaCoF3 perovskite cell parameters are
displayed in the Pbnm space group.

                      Image     P (GPa)         T (K)        Pt                         NaCoF3
                                                         a (Å)    Phase     a (Å)    b (Å)    c (Å)     t/G     CS (Å)
                           3         3.4      301 (0)    3.907    Pv       5.297     5.580    7.694    0.028       277
                           7         4.0      423 (4)    3.906    Pv       5.293     5.570    7.681    0.039       286
                          12         3.7     507 (15)    3.907    Pv       5.305     5.560    7.678    0.039       249
                          17         1.1      767 (7)    3.920    Pv       5.392     5.588    7.774    0.029       272
                          38         1.1      868 (9)    3.918    Pv       5.363     5.553    7.720    0.010       465
                          46         4.2     866 (10)    3.907    Pv       5.302     5.526    7.653    0.022       475
                          52         7.3     866 (10)    3.893    Pv       5.227     5.503    7.592    0.037       428
                          57         9.0     865 (10)    3.886    Pv       5.162     5.488    7.547    0.041       388
                          66        13.4     861 (10)    3.868    Pv       5.034     5.468    7.469    0.049       337
                          69        14.8     861 (10)    3.863    Pv       4.995     5.467    7.444    0.051       231
                          73        18.1      929 (7)    3.852    Pv       4.921     5.456    7.391    0.054       143
                          77        20.1     997 (10)    3.844    Pv       4.852     5.485    7.339    0.048       104
                          79        26.1    1013 (14)    3.824    pPv      2.894     9.030    6.974    0.016        87
                          83        27.5    1006 (18)    3.819    pPv      2.884     9.022    6.950    0.018       100
                          86        28.5    1004 (19)    3.816    pPv      2.872     9.014    6.944    0.018       107
                          87        29.1    1003 (20)    3.814    pPv      2.868     9.012    6.935    0.018       171
                          88        29.6    1003 (20)    3.813    pPv      2.867     9.008    6.930    0.020       359

Figure 2. (a) Unrolled diffraction image of NaCoF3 perovskite at 20.1 GPa and 997 K, immediately before transformation to post-perovskite.
Below: measured diffraction (labeled data). Above: diffraction image recalculated by MAUD (labeled fit). Diffraction peaks of perovskite
are labeled by their Miller indices, and platinum peaks are indicated by Pt. (b) Diffraction and fit for post-perovskite phase at 26.1 GPa and
1013 K. In both (a) and (b) diffraction lines vary in position and intensity, revealing texture and stress development due to compression.
Graphite peaks from the heater are present at 6.0, 8.2, 13.4, and 14.6◦ 2θ. These diffraction peaks, becoming more visible as the experiment
proceeds, show no strain and were ignored if necessary during the refinement process.

Eur. J. Mineral., 33, 591–603, 2021                                                           https://doi.org/10.5194/ejm-33-591-2021
J. P. Gay et al.: Deformation and transformation of NaCoF3 perovskite and post-perovskite 595
Figure 3. Unit cell volumes of NaCoF3 perovskite and post-
Figure 4. Normalized stress t/G in NaCoF3 perovskite (green cir-
perovskite plotted vs. pressure. Lines are second-order Birch–
cles) and post-perovskite (blue diamonds) as a function of pressure.
Murnaghan equation of state, fit for each phase assuming constant
The solid line is a visual guide through the experimental data. The
temperature and used to illustrate compression behavior vs. experi-
perovskite to post-perovskite transition occurs between 20.1 and
mental values.
26.1 GPa.
Orientation distribution functions (ODFs) were calcu-
lated using the entropy Williams–Matthies–Imhof–Vinel (E- We used the program EosFit (Gonzalez-Platas et al.,
WIMV) algorithm which accounts for incomplete and arbi- 2016) to fit a second-order Birch–Murnaghan equation of
trary pole coverage. The ODF is a probability distribution state trend for perovskite between 1.1 GPa and 868 K and
function to find an orientation, which is normalized over the 20.1 GPa and 997 K and for all post-perovskite data. Consid-
entire sample. An ODF with a multiple of random distribu- ering the small ranges in temperature for the measurements,
tion (mrd) of 1 indicates a random orientation. Values greater temperature effects were ignored. The resulting bulk mod-
or smaller than 1 indicate preferred orientation within an ag- ulus for perovskite and post-perovskite in the 868–1013 K
gregate of grains, which we refer to as texture. Compression range are 74.9 and 85.9 GPa, respectively. Based on Fig. 3,
in the diamond anvil cell imposes a symmetry along the com- the drop of volume at the perovskite to post-perovskite tran-
pression direction, set as the z axis in MAUD. Therefore, we sition is estimated to be 6.6 Å3
impose a fiber symmetry and use an ODF resolution of 15◦ . Since the pressure and temperature effect on shear mod-
ulus is unknown for NaCoF3 , we report stresses in terms of
normalized stress t/G. This quantity is a more appropriate
3 Results representation of stress, does not require the extrapolation of
G, and has been used in past studies to compare materials to
NaCoF3 crystallizes in the perovskite structure at ambient each other (Duffy, 2007; Miyagi et al., 2009; Dorfman et al.,
conditions. We observe a transformation to post-perovskite 2015). As pressure increases from 1.1 to 18.1 GPa at temper-
between 20.1 and 26.1 GPa at temperatures of ≈ 1000 K. atures between 868 and 929 K, normalized stress in NaCoF3
Unit cell volumes of NaCoF3 in perovskite and post- perovskite increases from 0.010 to 0.054 (Fig. 4). Before the
perovskite are shown in Fig. 3 and the corresponding unit onset of transformation to post-perovskite, we observe a de-
cell parameters in Table 1. In this study, we use the Pbnm crease in normalized stress to 0.048 at 997 K. This decrease
space group for the orthorhombic setting of the perovskite in stress is likely due to relaxation as the transition is ini-
phase. MAUD does report errors for each of the fitted pa- tiated. The t/G value drops to 0.016 as post-perovskite is
rameters; however, these values underestimate the true phys- formed at 26.1 GPa and 1013 K. Upon further compression
ical error of the measurement. Hence, errors for unit cell vol- to 29.6 GPa at 1003 K, t/G in post-perovskite increases to
umes, unit cell parameters, normalized stress, and crystal- 0.020.
lite size have been estimated by running multiple series of Texture development during the experiment is shown as
MAUD refinements from different starting values. The error inverse pole figures of the compression direction (Fig. 5). In
values reported in the caption of Table 1 are the maximum the perovskite phase we observe a weak maximum at 100
variation of each quantity. We observe a smooth decrease in (2.2 mrd) after the closure of the sample chamber (Fig. 5a).
unit cell volume with pressure. As compression of NaCoF3 continues the maximum at 100
strengthens to an mrd value of 4.2 at 7.3 GPa (Fig. 5b). Upon
https://doi.org/10.5194/ejm-33-591-2021 Eur. J. Mineral., 33, 591–603, 2021596 J. P. Gay et al.: Deformation and transformation of NaCoF3 perovskite and post-perovskite
further compression to 13.4 GPa, a weak secondary maxi- tified in early transmission electron microscope (TEM) stud-
mum appears at 001 (Fig. 5c). This texture weakens before ies (Wang et al., 1992). This same 100 texture maximum
transitioning to post-perovskite at 26.1 GPa (Fig. 5f). This is was also observed in compressed NaMgF3 (Kaercher et al.,
likely a feature of the transformation. In all cases, there is a 2016). The secondary 001 maximum observed later in com-
clear minimum at 010 in the perovskite phase. pression was also observed in D-DIA deformation experi-
At 26.1 GPa NaCoF3 has transformed to a post-perovskite ments on NaMgF3 (Kaercher et al., 2016) and was reported
structure, and a weak preferred orientation can be observed at in the study of Miyagi and Wenk (2016) on bridgmanite at
010 (Fig. 5f). This texture strengthens upon compression to pressures below 55 GPa in which it was assigned to slip along
29.6 GPa with mrd values never exceeding 3. Additionally, (001).
a clear minimum at 001 develops upon compression of the Based on texture measurements, NaCoF3 is a good ana-
post-perovskite phase, as well as a small shift of 010 towards logue for constraining the plasticity of bridgmanite as both
001 (Fig. 5g). maxima at 100 and 001 are observed in both phases in
compression experiments. The interpretation of which de-
formation mechanisms are responsible for experimental tex-
4 Plastic deformation of NaCoF3 ture, however, requires a comparison with polycrystal plas-
ticity simulations. This allows the most relevant deformation
4.1 Compression textures in NaCoF3 perovskite mechanism controlling microstructures in the experiment to
be extracted and will be described in Sect. 4.3.
Texture evolution is indicative of ongoing plastic deforma-
tion and most likely dislocation glide or twinning. Other de- 4.2 Compression textures in NaCoF3 post-perovskite
formation mechanisms including dislocation climb or dif-
fusion could be active during deformation; however, these Texture in post-perovskite can arise from phase transforma-
mechanisms would not result in strong deformation textures tions (Okada et al., 2010; Miyagi et al., 2010, 2011; Dob-
like those observed in our experiments. In earth sciences, son et al., 2013; Miyagi and Wenk, 2016) or plastic defor-
deformation textures in perovskite-structured materials are mation (Merkel et al., 2006, 2007; Yamazaki et al., 2006;
motivated because the most abundant mineral in the Earth’s Niwa et al., 2007; Miyajima and Walte, 2009; Hunt et al.,
lower mantle is bridgmanite; (Mg,Fe)SiO3 in the perovskite 2016). Here, we measure textures in NaCoF3 post-perovskite
structure (Tschauner et al., 2014). Numerous studies have between 26.1 and 29.6 GPa at ≈ 1000 K. Post-perovskite is
hence addressed the deformation textures and mechanisms compressed over a restricted pressure range (≈ 4 GPa), little
in bridgmanite (e.g., Wang et al., 1992; Merkel et al., 2003; texture evolution is observed, and textures are interpreted to
Wenk et al., 2004a; Cordier et al., 2004; Wenk et al., 2006; arise primarily from transformation. There is a clear effect of
Ferré et al., 2007; Mainprice et al., 2008; Miyagi and Wenk, transformation textures vs. deformation textures, and our ob-
2016; Kraych et al., 2016; Boioli et al., 2017). In addition, served texture mostly results from the phase transformation;
other studies implement structural analogue compositions thus interpretation based on deformation mechanisms will be
such as CaIrO3 (Niwa et al., 2007), NaMgF3 (Kaercher et biased. For this reason, we will focus on the analysis of the
al., 2016), and CaGeO3 (Wang et al., 2013) as lower pres- perovskite to post-perovskite transformation in Sect. 5.
sures and temperatures are required to generate a compres-
sion texture, and data are easier to interpret. Furthermore, 4.3 Plastic deformation mechanism in perovskite
compression textures in NaCoF3 have not been investigated
before, which only allows us to compare them to other ana- Texture development depends on a number of factors in-
logues such as the ones mentioned above. It is important to cluding deformation geometry, total strain, starting texture,
note, however, that not all perovskite-structured materials be- and plastic deformation mechanism activity. Interpretations
have in the same manner during plastic deformation. can be made by using a visco-plastic self-consistent (VPSC)
Here, we measure compression textures in NaCoF3 be- model, which simulates the plastic deformation of polycrys-
tween 1.1 and 29.6 GPa at temperatures between 767 and talline aggregates depending on deformation mechanisms
1013 K. We observe a 100 compression texture very early and loading conditions (Wenk, 1999). VPSC modeling has
in the compression (Fig. 5a) which strengthens with further been used in the past to investigate deformation of per-
compression to 18.1 GPa (Fig. 5d). This increase of the 100 ovskites at lower-mantle conditions (Mainprice et al., 2008;
texture maximum is accompanied by a decrease in inten- Miyagi and Wenk, 2016; Kaercher et al., 2016). Based on
sity at 010. At 13.4 GPa, we observe the appearance of a these publications, we test the following deformation mech-
secondary maximum at 001. The 100 maximum induced by anisms, (100)[010], (100)[001], (100)h011i, (010)[100],
the first stage of compression compares favorably with ex- (010)h101i, (001)[100], (001)h110i, {111}h110i, and
periments on bridgmanite (Merkel et al., 2003; Wenk et al., {110}h110i twins, in order to generate the best fit texture
2004b; Miyagi and Wenk, 2016) in which it was assigned to observed in our experiments (Fig. 5). The final models used
a likely contribution of {110} mechanical twinning as iden- are shown in Table 2 and will be described below.
Eur. J. Mineral., 33, 591–603, 2021 https://doi.org/10.5194/ejm-33-591-2021J. P. Gay et al.: Deformation and transformation of NaCoF3 perovskite and post-perovskite 597
Figure 5. Inverse pole figures in the compression direction of NaCoF3 at various stages of compression. (a, b, c, d, e) Perovskite structure
(Pbmn setting). (f, g) Post-perovskite structure. Equal area projection. Color scale in multiples of random distribution (mrd). Values of t
reported in the figure assume constant shear modulus value of G = 44 GPa.
Table 2. CRSS, start activity, and end activity of slip systems from VPSC calculations for perovskite. Sample compression is modeled in two
stages. See text for details.
Slip system Stage 1 (25 % strain) Stage 2 (40 % strain)
CRSS Start activity End activity CRSS Start activity End activity
(100)[010] 3 9.9 % 10.8 % 5 8.4 % 5.1 %
(100)[001] 2 10.2 % 17.8 % 5 0.7 % 1.0 %
(100)h011i 2 32.3 % 44.3 % 5 5.8 % 4.3 %
(010)[100] 5 2.1 % 2.3 % 5 8.4 % 5.1 %
(010)h101i 5 11.5 % 6.8 % 5 3.3 % 2.0 %
(001)[100] 5 0.7 % 1.1 % 6 0.4 % 1.0 %
(001)[010] 5 7.5 % 3.7 % 6 0.0 % 0.0 %
(001)h110i 5 7.5 % 5.2 % 1 69.5 % 79.7 %
{111}h110i 30 1.4 % 7.4 % 30 3.4 % 2.4 %
{110}h110i twin 2 17.0 % 0.5 % 25 0.0 % 0.0 %
The critical resolved shear stress (CRSS) values reported 001. Indeed, dominant slip on (100) only results in the de-
in this paper are only relative values to one another. Due to pletion of both 010 and 001 (Kaercher et al., 2016) and is not
the absence of single crystal elastic information on NaCoF3 , consistent with our experimental results.
we lack the elasticity information required to model defor- We were then unable to obtain orientations on the sec-
mation textures using an elasto-visco-plastic self-consistent ondary 001 maximum while preserving the initial 100 tex-
(E-VPSC) model which would take into account elastic prop- ture as measured in the experiment above 13.4 GPa (Fig. 5c).
erties and absolute shear stresses. As a result, we use the Among the proposed deformation mechanisms, slip on (001)
visco-plastic self-consistent (VPSC) approach which does can indeed move orientations from 100 to 001, but such sim-
not include any effect of elasticity in which we adjust relative ulations will generate a slow movement of orientations from
CRSS values to best match our observed textures. Starting 100 to 001, as shown in the second stage simulations (Fig. 6d
from a set of 3000 random orientations (Fig. 6a), we can suc- and e). This is not observed in the experiments for which the
cessfully generate a strong 100 texture while depleting 010 001 maximum increases in the absence of intermediate orien-
and maintaining orientations at 001, as measured at 7.3 GPa tations between 100 and 001. Twinning is an efficient mode
(Fig. 5b), by applying 25 % strain in axial compression with for inducing fast grain reorientations without producing a
dominant slip on (100) and a significant contribution of {110} gradual texture shift. The fast reorientation of grains from
twins (Fig. 6c). It is necessary to include {110} twins in order 100 to 001 hence alludes to a potential contribution of an
to deplete the 010 direction while maintaining orientations at unknown twinning mode. Despite all our attempts, we were
https://doi.org/10.5194/ejm-33-591-2021 Eur. J. Mineral., 33, 591–603, 2021598 J. P. Gay et al.: Deformation and transformation of NaCoF3 perovskite and post-perovskite
Figure 6. Inverse pole figures (a, b, c) of first stage compression in VPSC simulation starting from a random texture at 0 % strain to 25 %
strain dominated by slip along (100) planes with significant contribution of {110} twins. Second stage of deformation (d, e) starting from (c),
allowing 20 % and 40 % strain with deformation dominated by (001) slip.
unable to characterize the observed 001 maximum based on 5.2 Stress
twinning laws reported for perovskites.
With the transition of perovskite to post-perovskite we mea-
sure a drop of normalized stress from 0.054 to 0.016 (a factor
5 Transformation of perovskite to post-perovskite in of 3). In comparison, studies by Hunt et al. (2009) and Dob-
NaCoF3 son et al. (2012) indicate post-perovskite deforms 5 to 10
times faster than perovskite when using analogues NaCoF3
Many questions have arisen regarding the transformation of and CaIrO3 based on strain rate measurements. Additionally,
perovskite to post-perovskite, including the transformation numerical simulations of diffusion in MgSiO3 by Ammann
mechanism itself (Tsuchiya et al., 2004; Oganov et al., 2005; et al. (2010) predicted a significantly weaker post-perovskite
Dobson et al., 2013), its effect on lattice preferred orienta- phase. The observed normalized strength drop in NaCoF3
tions (Okada et al., 2010; Miyagi et al., 2011), stress (Hunt et upon its transformation to post-perovskite is likely a result
al., 2009; Dobson et al., 2012), and anisotropy in the Earth’s of transformation plasticity or transient weakening. In the
lower mantle (Dobson et al., 2013; Walker et al., 2018b). absence of known values for elastic properties of NaCoF3
under high P /T , we are unable to report actual differential
5.1 Pressure
stress values. Despite this limitation, overall our results are
Transformation of NaCoF3 perovskite to post-perovskite consistent with a weakening of materials at the perovskite to
takes place between 20.1 and 26.1 GPa. The broad pressure post-perovskite transition.
range of conversion reported can be explained by signifi-
5.3 Mechanism
cant peak overlap between perovskite and post-perovskite
obscuring the phase transition. We observed the phase tran-
Phase transformations change crystal structures but also in-
sition at higher pressures than Dobson et al. (2011) and Yusa
duce a change in texture of materials. Transformations can be
et al. (2012), who observe the transition from perovskite to
diffusionless in nature, meaning the atoms within the mate-
post-perovskite at 18 GPa and 973 K and 14.5 GPa at 1173 K,
rial move in a homogeneous fashion or they can be recon-
respectively. This could be an effect of either stress or kinet-
structive in nature and move by means of long-range dif-
ics. During our experiment we do not allow as much time at
fusion. Diffusionless transformations involve orientation re-
the transition pressure as Dobson et al. (2011) who induced
lationships between the parent and daughter phase and are
the transformation in a multi-anvil press. Additionally, Yusa
sometimes referred to as martensitic (Christian et al., 1995).
et al. (2012) observe disproportionation phases after laser
Diffusive transformations, on the other hand, do not imply
heating above 21 GPa at 1100 K that we do not. This could
orientation relationships between the parent and daughter
potentially be explained by the overall lower temperatures in
phase.
our experiment.
Early predictions by Tsuchiya et al. (2004) indicate that
the perovskite to post-perovskite transformation should lead
Eur. J. Mineral., 33, 591–603, 2021 https://doi.org/10.5194/ejm-33-591-2021J. P. Gay et al.: Deformation and transformation of NaCoF3 perovskite and post-perovskite 599
to orientation relationships. They determine that [110], [110],
and [001] of Pbnm perovskite correspond to [100], [010],
and [001], respectively, in Cmcm post-perovskite. In paral-
lel, based on metadynamics, the simulations of Oganov et
al. (2005) predict a less cooperative mechanism with stack-
ing faults producing shear and fragments of post-perovskite
structures. Experimentally, Dobson et al. (2013) studied the
perovskite to post-perovskite transition in NaNiF3 based
on high-pressure experiments and electron microscopy on
the recovered samples. They indicate that the c axis of the
perovskite phase is preserved during the transformation to
post-perovskite. In addition, they observed that the post-
perovskite hh0 vector in reciprocal space is parallel to [010]
in perovskite.
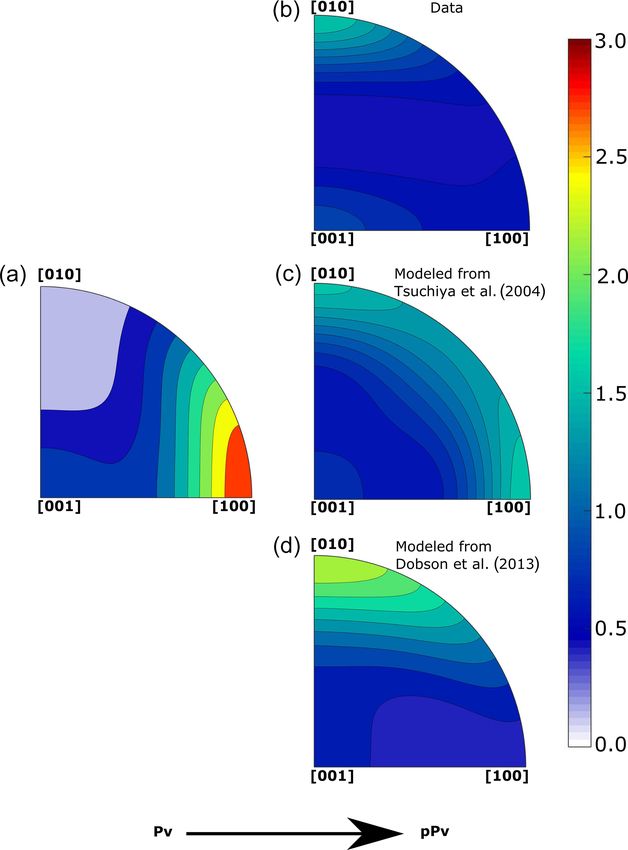
Here, we test these three different transformation models.
The orientation relationships of Tsuchiya et al. (2004), start-
ing from NaCoF3 perovskite at 20.1 GPa, result in a trans-
formation texture with diffuse weak maximums between
010 and 100 (Fig. 7c). The model proposed by Oganov et
al. (2005) is not consistent with our data because orienta-
tion relationships are only considered along the c direction.
We clearly observe a 010 texture in post-perovskite, implying
there are additional orientation relationships than that along
the c direction. When using the orientations relationships in
Dobson et al. (2013), the simulated post-perovskite texture
matches that measured experimentally (Fig. 7d). In both the
experimental and simulated textures, we observe a maximum
at 010. Moreover, the strength of the texture is consistent be-
Figure 7. (a) Perovskite texture at 20.1 GPa immediately before
tween experiments and simulations.
transformation to post-perovskite. (b) Post-perovskite texture at
Based on the above reasoning, we can conclude that the
26.1 GPa after transformation from experimental measurements. (c)
transformation from perovskite to post-perovskite in NaCoF3 Modeled transformation texture of post-perovskite using orientation
involves orientation relationships and hence falls within relationships from Tsuchiya et al. (2004). (d) Modeled transforma-
the group of displacive phase transformations. Furthermore, tion texture of post-perovskite using orientation relationships from
these relationships fit the model of Dobson et al. (2013), Dobson et al. (2013).
based on experiments performed on NaNiF3 . This supports
the idea that this mechanism could apply to natural per-
ovskite phases. maximum; however, we are unable to recreate it without
shifting the original 100 maximum. Such fast grain reorien-
tation could be explained by a twinning mode different from
6 Conclusion known perovskite twinning modes (Wang et al., 1992). Di-
rect comparisons to MgSiO3 deformation textures are made
This paper presented experimental results of NaCoF3 com- difficult because of the effect of starting material on the
pressed inside a resistive-heated radial diffraction DAC at MgSiO3 transformation textures (Miyagi and Wenk, 2016).
pressures of 1.1 to 29.6 GPa and temperatures between 300 Nevertheless, both the 100 and 001 compression textures ob-
and 1013 K. A phase transformation from NaCoF3 per- served in NaCoF3 have been observed in natural composi-
ovskite to post- perovskite was observed between 20.1 and tions (Merkel et al., 2003; Wenk et al., 2004b; Miyagi and
26.1 GPa. Wenk, 2016; Couper et al., 2020). NaCoF3 hence appears as
Deformation of NaCoF3 perovskite initially results in a a good analogue for plasticity studies relevant for the Earth’s
strong 100 maximum when the sample is at 7.3 GPa. VPSC mantle.
simulations show that this texture is formed by slip along The phase transition from perovskite to post-perovskite re-
(100) paired with important contributions from {110} twins. sults in a normalized strength drop from 0.054 to 0.016 (a
Later in the deformation process we observe a weak sec- factor of 3), which is likely a result of transformation plastic-
ondary 001 maximum appearing at 13.4 GPa. These defor- ity or transient weakening. Transformation of NaCoF3 per-
mation textures are similar to those of NaMgF3 shown in ovskite to post-perovskite is martensitic in nature as demon-
Kaercher et al. (2016). We attempt to model this secondary strated by the existence of orientation relationships between
https://doi.org/10.5194/ejm-33-591-2021 Eur. J. Mineral., 33, 591–603, 2021600 J. P. Gay et al.: Deformation and transformation of NaCoF3 perovskite and post-perovskite
both phases. The orientation relationships proposed by Dob- ERDF program of the European Union, and the “Métropole Eu-
son et al. (2013) can successfully reproduce our data. ropéenne de Lille”. This research was carried out at the P02.2
Perovskite analogues continue to provide valuable insight beamline of the PETRA III synchrotron at DESY, a member of the
to the behavior of materials at extreme pressures and tem- Helmholtz Association (HGF). The authors would also like to thank
peratures relevant for planetary mantles. For Earth’s mantle Feng Lin for assistance with VPSC modeling.
materials, it is important to understand the effect of temper-
ature on deformation mechanisms which may be different
Financial support. This research has been supported by the Asso-
from what is observed at 300 K. Analogues such as NaCoF3
ciation Nationale de la Recherche et de la Technologie (TIMEleSS,
allow for studies at lower pressures. It would be interesting
grant no. ANR-17-CE31-0025) and the Deutsche Forschungsge-
to study the effect of temperatures at these lower pressures meinschaft (grant nos. TH 1530/18-1, SA 2585/3-1, and SP1216/8-
to constrain the effect of temperature on the plasticity of per- 1). It was also supported by the bilateral PROCOPE-PPP program
ovskite phases. Further studies on analogues might also in- (grant nos. PHC 40555PC and DAAD 57390184). Christopher Lan-
clude the investigation of post-perovskite deformation tex- grand also received support from a fellowship of the Université de
tures in NaCoF3 and other analogues, as well as potential Lille and the Région Hauts-de-France. The research leading to this
post-post-perovskite phases (Crichton et al., 2016; Umemoto result has been supported by the EU Framework Programme for Re-
and Wentzcovitch, 2019). A general understanding of plastic- search and Innovation HORIZON 2020 (CALIPSOplus (grant no.
ity in perovskite and post-perovskite will help with improv- 730872)).
ing the interpretation of seismic models in terms of mantle
dynamics such as heat transfer through convection.
Review statement. This paper was edited by Max Wilke and re-
viewed by two anonymous referees.
Code and data availability. The data were processed using MAUD
(http://maud.radiographema.eu, Lutterotti et al., 1997) and MTEX
(https://mtex-toolbox.github.io, Bachmann et al., 2010) which are References
open source and freely available. VPSC modeling was performed
using the Los Alamos visco-plastic self-consistent code available Ammann, M. W., Brodholt, J. P., Wookey, J., and Dobson,
from Ricardo A. Lebensohn and Carlos N. Tomé. Maud and VPSC D. P.: First-principles constraints on diffusion in lower-
input files are available on Zenodo using the following link: https: mantle minerals and a weak D00 layer, Nature, 465, 462–465,
//doi.org/10.5281/zenodo.5513910 (Gay et al., 2021). https://doi.org/10.1038/nature09052, 2010.
Bachmann, F., Hielscher, R., and Schaeben, H.: Solid State Phe-
nomena, Texture Analysis with MTEX – Free and Open Source
Author contributions. LM and SM designed the project. LM, SM, Software Toolbox, 160, 63–68, https://doi.org/10.4028/www.
CL, SC, and HPL conducted the experiment. DPD provided the scientific.net/SSP.160.63 (last access 21 September 2021) 2010
sample. JPG and SM processed and interpreted the data. JPG and (code available at: https://mtex-toolbox.github.io, last access:
SM wrote the paper with comments from LM, SC, DPD, and HPL. 21 September 2021).
Beghein, C., Trampert, J., and van Heijst, H. J.: Radial anisotropy
in seismic reference models of the mantle, J. Geophys. Res.-Sol.
Competing interests. The contact author has declared that neither Ea., 111, B02303, https://doi.org/10.1029/2005JB003728, 2006.
they nor their co-authors have any competing interests Boioli, F., Carrez, P., Cordier, P., Devincre, B., Gouriet, K., Hirel,
P., Kraych, A., and Ritterbex, S.: Pure climb creep mechanism
drives flow in Earth’s lower mantle, Science Advances, 3, 1–7,
https://doi.org/10.1126/sciadv.1601958, 2017.
Disclaimer. Publisher’s note: Copernicus Publications remains
Carrez, P., Ferré, D., and Cordier, P.: Implications for plastic flow
neutral with regard to jurisdictional claims in published maps and
in the deep mantle from modelling dislocations in MgSiO3 min-
institutional affiliations.
erals, Nature, 446, 68–70, https://doi.org/10.1038/nature05593,
2007.
Carrez, P., Goryaeva, A. M., and Cordier, P.: Prediction of Mechan-
Special issue statement. This article is part of the special issue ical Twinning in Magnesium Silicate Post-Perovskite, Sci. Rep.,
“Probing the Earth: experiments and mineral physics at mantle 7, 17640, https://doi.org/10.1038/s41598-017-18018-1, 2017.
depths”. It is a result of the 17th International Symposium on Exper- Chen, G., Liebermann, R. C., and Weidner, D. J.: Elasticity of
imental Mineralogy, Petrology and Geochemistry, Potsdam, Ger- single-crystal MgO to 8 Gigapascals and 1600 Kelvin, Science,
many, 21–24 June 2020. 280, 1913–1916, https://doi.org/10.1126/science.280.5371.1913,
1998.
Chenine, D., Aziz, Z., Benstaali, W., Bouadjemi, B., Youb, O.,
Acknowledgements. The Chevreul Institute is thanked for its help Lantri, T., Abbar, B., and Bentata, S.: Theoretical Investiga-
in the development of this work through the ARCHI-CM project tion of Half-Metallic Ferromagnetism in Sodium-Based Fluoro-
supported by the “Ministère de l’Enseignement Supérieur de la perovskite NaXF3 (X = V, Co), J. Supercond. Nov. Magn., 31,
Recherche et de l’Innovation”, the region “Hauts-de-France”, the 285–295, https://doi.org/10.1007/s10948-017-4204-4, 2018.
Eur. J. Mineral., 33, 591–603, 2021 https://doi.org/10.5194/ejm-33-591-2021J. P. Gay et al.: Deformation and transformation of NaCoF3 perovskite and post-perovskite 601 Christian, J. W., Olson, G. B., and Cohen, M.: Classifi- perovskite up to 30 GPa and 1013 K, Zenodo [data set], cation of Displacive Transformations: What is a Marten- https://doi.org/10.5281/zenodo.5513910, 2021. sitic Transformation?, J. Phys. IV France, 05, C8-3–C8-10, Girard, J., Amulele, G., Farla, R., Mohiuddin, A., and Karato, S. https://doi.org/10.1051/jp4:1995801, 1995. I.: Shear deformation of bridgmanite and magnesiowüstite ag- Čížková, H., Čadek, O., Matyska, C., and Yuen, D. A.: Im- gregates at lower mantle conditions, Science, 351, 144–147, plications of post-perovskite transport properties for core- https://doi.org/10.1126/science.aad3113, 2016. mantle dynamics, Phys. Earth Planet. In., 180, 235–243, Gonzalez-Platas, J., Alvaro, M., Nestola, F., and Angel, R.: EosFit7- https://doi.org/10.1016/j.pepi.2009.08.008, 2010. GUI: A new graphical user interface for equation of state calcu- Cobden, L., Thomas, C., and Trampert, J.: The earth’s hetero- lations, analyses and teaching, J. Appl. Crystallogr., 49, 1377– geneous mantle: A geophysical, geodynamical, and geochemi- 1382, https://doi.org/10.1107/S1600576716008050, 2016. cal perspective, Springer International Publishing Switzerland, Hernlund, J. W., Thomas, C., and Tackley, P. J.: A dou- Cham, Switzerland, https://doi.org/10.1007/978-3-319-15627- bling of the post-perovskite, Nature, 434, 882–886, 9_13, 2015. https://doi.org/10.1038/nature03472, 2005. Cordier, P., Ungár, T., Zsoldos, L., and Tichy, G.: Dislo- Hunt, S. A., Weidner, D. J., Li, L., Wang, L., Walte, N. P., Brodholt, cation creep in MgSiO3 perovskite at conditions of the J. P., and Dobson, D. P.: Weakening of calcium iridate during its Earth’s uppermost lower mantle, Nature, 428, 837–840, transformation from perovskite to post-perovskite, Nat. Geosci., https://doi.org/10.1038/nature02472, 2004. 2, 794–797, https://doi.org/10.1038/ngeo663, 2009. Couper, S., Speziale, S., Marquardt, H., Liermann, H. P., and Hunt, S. A., Walker, A. M., and Mariani, E.: In-situ Miyagi, L.: Does Heterogeneous Strain Act as a Control on Seis- measurement of texture development rate in CaIrO3 mic Anisotropy in Earth’s Lower Mantle?, Front. Earth Sci., 8, post-perovskite, Phys. Earth Planet. In., 257, 91–104, 540449, https://doi.org/10.3389/feart.2020.540449, 2020. https://doi.org/10.1016/j.pepi.2016.05.007, 2016. Crichton, W., Bernal, F., Guignard, J., Hanfland, M., and Mar- Immoor, J., Marquardt, H., Miyagi, L., Speziale, S., Merkel, S., gadonna, S.: Observation of Sb2 S3 -type post-post-perovskite in Schwark, I., Ehnes, A., and Liermann, H.-P.: An improved setup NaFeF3 . Implications for ABX3 and A2 X3 systems at ultrahigh for radial diffraction experiments at high pressures and high tem- pressure, Mineral. Mag., 80, 659–674, 2016. peratures in a resistive graphite-heated diamond anvil cell, Rev. Dobson, D. P., Hunt, S. A., Lindsay-Scott, A., and Wood, I. Sci. Instrum., 91, 045121, https://doi.org/10.1063/1.5143293, G.: Towards better analogues for MgSiO3 post-perovskite: 2020. NaCoF3 and NaNiF3 , two new recoverable fluoride Kaercher, P., Miyagi, L., Kanitpanyacharoen, W., Zepeda-Alarcon, post-perovskites, Phys. Earth Planet. In., 189, 171–175, E., Wang, Y., Parkinson, D., Lebensohn, R. A., De Carlo, https://doi.org/10.1016/j.pepi.2011.08.010, 2011. F., and Wenk, H. R.: Two-phase deformation of lower man- Dobson, D. P., McCormack, R., Hunt, S. A., Ammann, M. W., tle mineral analogs, Earth Planet. Sc. Lett., 456, 134–145, Weidner, D., Li, L., and Wang, L.: The relative strength of per- https://doi.org/10.1016/j.epsl.2016.09.030, 2016. ovskite and post-perovskite NaCoF3 , Mineral. Mag., 76, 925– Koelemeijer, P., Schuberth, B. S., Davies, D. R., Deuss, A., and 932, https://doi.org/10.1180/minmag.2012.076.4.09, 2012. Ritsema, J.: Constraints on the presence of post-perovskite Dobson, D. P., Miyajima, N., Nestola, F., Alvaro, M., in Earth’s lowermost mantle from tomographic-geodynamic Casati, N., Liebske, C., Wood, I. G., and Walker, A. model comparisons, Earth Planet. Sc. Lett., 494, 226–238, M.: Strong inheritance of texture between perovskite and https://doi.org/10.1016/j.epsl.2018.04.056, 2018. post-perovskite in the D00 layer, Nat. Geosci., 6, 575–578, Kraych, A., Carrez, P., and Cordier, P.: On dislocation https://doi.org/10.1038/ngeo1844, 2013. glide in MgSiO3 bridgmanite at high-pressure and Dorfman, S. M., Shieh, S. R., and Duffy, T. S.: Strength and tex- high-temperature, Earth Planet. Sc. Lett., 452, 60–68, ture of Pt compressed to 63 GPa, J. Appl. Phys., 117, 065901, https://doi.org/10.1016/j.epsl.2016.07.035, 2016. https://doi.org/10.1063/1.4907866, 2015. Liermann, H.-P., Merkel, S., Miyagi, L., Wenk, H.-R., Shen, Duffy, T. S.: Strength of materials under static loading in G., Cynn, H., and Evans, W. J.: Experimental method for in the diamond anvil cell, AIP Conf. Proc., 955, 639–644, situ determination of material textures at simultaneous high https://doi.org/10.1063/1.2833175, 2007. pressure and high temperature by means of radial diffraction Ferré, D., Carrez, P., and Cordier, P.: First principles determination in the diamond anvil cell, Rev. Sci. Instrum., 80, 104501, of dislocations properties of MgSiO3 perovskite at 30 GPa based https://doi.org/10.1063/1.3236365, 2009. on the Peierls-Nabarro model, Phys. Earth Planet. In., 163, 283– Liermann, H.-P., Konôpková, Z., Morgenroth, W., Glazyrin, K., 291, https://doi.org/10.1016/j.pepi.2007.05.011, 2007. Bednarcik, J., McBride, E. E., Petitgirard, S., Delitz, J. T., Wendt, Ferreira, A. M., Faccenda, M., Sturgeon, W., Chang, S. J., M., Bican, Y., Ehnes, A., Schwark, I., Rothkirch, A., Tischer, M., and Schardong, L.: Ubiquitous lower-mantle anisotropy Heuer, J., Schulte-Schrepping, H., Kracht, T., and Franz, H.: The beneath subduction zones, Nat. Geosci., 12, 301–306, Extreme Conditions Beamline P02.2 and the Extreme Conditions https://doi.org/10.1038/s41561-019-0325-7, 2019. Science Infrastructure at PETRA III, J. Synchrotron Radiat., 22, Garnero, E. J., Maupin, V., Lay, T., and Fouch, M. J.: Variable az- 908–924, https://doi.org/10.1107/S1600577515005937, 2015. imuthal anisotropy in earth’s lowermost mantle, Science, 306, Lutterotti, L., Matthies, S., Wenk, H. R., Schultz, A. S., and 259–261, https://doi.org/10.1126/science.1103411, 2004. Richardson, J. W.: Combined texture and structure analysis of de- Gay, J. P., Miyagi, L., Couper, S., Langrand, C., Dobson, formed limestone from time-of-flight neutron diffraction spectra, D. P., Liermann, H.-P., and Merkel, S.: Data for defor- J. Appl. Phys., 81, 594–600, https://doi.org/10.1063/1.364220, mation and transformation of NaCoF3 perovskite and post- https://doi.org/10.5194/ejm-33-591-2021 Eur. J. Mineral., 33, 591–603, 2021
602                             J. P. Gay et al.: Deformation and transformation of NaCoF3 perovskite and post-perovskite

  1997 (data available at: http://maud.radiographema.eu, last ac-         Alarcon, E. Z.: Combined resistive and laser heating technique
  cess: 17 September 2021).                                               for in situ radial X-ray diffraction in the diamond anvil cell at
Mainprice, D., Barruol, G., Isma, W. B., Mainprice, D., Barruol, G.,      high pressure and temperature, Rev. Sci. Instrum., 84, 025118,
  Isma, W. B., Mainprice, D., Barruol, G., and Isma, W. B.: The           https://doi.org/10.1063/1.4793398, 2013.
  Seismic anisotropy of the Earth’s mantle: From single crystal to     Miyajima, N. and Walte, N.: Burgers vector determination in de-
  polycrystal, vol. 117, American Geophysical Union, Washington           formed perovskite and post-perovskite of CaIrO3 using thickness
  D.C., USA, https://doi.org/10.1029/GM117, 2000.                         fringes in weak-beam dark-field images, Ultramicroscopy, 109,
Mainprice, D., Tommasi, A., Ferré, D., Carrez, P., and                    683–692, https://doi.org/10.1016/j.ultramic.2009.01.010, 2009.
  Cordier, P.: Predicted glide systems and crystal preferred           Murakami, M., Hirose, K., Kawamura, K., Sata, N., and Ohishi, Y.:
  orientations of polycrystalline silicate Mg-Perovskite at               Post-Perovskite Phase Transition in MgSiO3 , Science, 304, 855–
  high pressure: Implications for the seismic anisotropy in               858, https://doi.org/10.1126/science.1095932, 2004.
  the lower mantle, Earth Planet. Sc. Lett., 271, 135–144,             Nakagawa, T. and Tackley, P. J.: Effects of low-viscosity
  https://doi.org/10.1016/j.epsl.2008.03.058, 2008.                       post-perovskite on thermo-chemical mantle convection in
McCormack, R., Dobson, D. P., Walte, N. P., Miyajima, N.,                 a 3-D spherical shell, Geophys. Res. Lett., 38, L04309,
  Taniguchi, T., and Wood, I. G.: The development of shape-               https://doi.org/10.1029/2010GL046494, 2011.
  and crystallographic-preferred orientation in CaPtO3 post-           Niwa, K., Yagi, T., Ohgushi, K., Merkel, S., Miyajima, N.,
  perovskite deformed in pure shear, Am. Mineral., 96, 1630–              and Kikegawa, T.: Lattice preferred orientation in CaIrO3
  1635, https://doi.org/10.2138/am.2011.3881, 2011.                       perovskite and post-perovskite formed by plastic deforma-
Merkel, S., Wenk, H. R., Badro, J., Montagnac, G., Gillet, P., Mao,       tion under pressure, Phys. Chem. Miner., 34, 679–686,
  H. K., and Hemley, R. J.: Deformation of (Mg0.9 ,Fe0.1 )SiO3            https://doi.org/10.1007/s00269-007-0182-6, 2007.
  Perovskite aggregates up to 32 GPa, Earth Planet. Sc. Lett.,         Nowacki, A., Wookey, J., and Kendall, J. M.: Deformation of the
  209, 351–360, https://doi.org/10.1016/S0012-821X(03)00098-0,            lowermost mantle from seismic anisotropy, Nature, 467, 1091–
  2003.                                                                   1094, https://doi.org/10.1038/nature09507, 2010.
Merkel, S., Kubo, A., Miyagi, L., Speziale, S., Duffy, T. S., Mao,     Nowacki, A., Walker, A. M., Wookey, J., and Kendall, J. M.:
  H. K., and Wenk, H. R.: Plastic deformation of MgGeO3 post-             Evaluating post-perovskite as a cause of D00 anisotropy in re-
  perovskite at lower mantle pressures, Science, 311, 644–646,            gions of palaeosubduction, Geophys. J. Int., 192, 1085–1090,
  https://doi.org/10.1126/science.1121808, 2006.                          https://doi.org/10.1093/gji/ggs068, 2013.
Merkel, S., McNamara, A. K., Kubo, A., Speziale, S., Miyagi,           Oganov, A. R. and Ono, S.: Theoretical and experimental evidence
  L., Meng, Y., Duffy, T. S., and Wenk, H. R.: Deformation of             for a post-perovskite phase of MgSiO3 in Earth’s D00 layer, Na-
  (Mg,Fe)SiO3 post-perovskite and D00 anisotropy, Science, 316,           ture, 430, 445–448, https://doi.org/10.1038/nature02701, 2004.
  1729–1732, https://doi.org/10.1126/science.1140609, 2007.            Oganov, A. R., Martoňák, R., Laio, A., Raiteri, P., and Par-
Metsue, A., Carrez, P., Mainprice, D., and Cordier, P.: Numer-            rinello, M.: Anisotropy of earth’s D00 layer and stacking faults
  ical modelling of dislocations and deformation mechanisms               in the MgSiO3 post-perovskite phase, Nature, 438, 1142–1144,
  in CaIrO3 and MgGeO3 post-perovskites – Comparison with                 https://doi.org/10.1038/nature04439, 2005.
  MgSiO3 post-perovskite, Phys. Earth Planet. In., 174, 165–173,       Okada, T., Yagi, T., Niwa, K., and Kikegawa, T.: Lattice-preferred
  https://doi.org/10.1016/j.pepi.2008.04.003, 2009.                       orientations in post-perovskite-type MgGeO3 formed by trans-
Miyagi, L. and Wenk, H. R.: Texture development and slip                  formations from different pre-phases, Phys. Earth Planet. In.,
  systems in bridgmanite and bridgmanite + ferroper-                      180, 195–202, https://doi.org/10.1016/j.pepi.2009.08.002, 2010.
  iclase aggregates, Phys. Chem. Miner., 43, 597–613,                  Panning, M. and Romanowicz, B.: A three-dimensional radi-
  https://doi.org/10.1007/s00269-016-0820-y, 2016.                        ally anisotropic model of shear velocity in the whole mantle,
Miyagi, L., Nishiyama, N., Wang, Y., Kubo, A., West, D. V.,               Geophys. J. Int., 167, 361–379, https://doi.org/10.1111/j.1365-
  Cava, R. J., Duffy, T. S., and Wenk, H. R.: Deformation                 246X.2006.03100.x, 2006.
  and texture development in CaIrO3 post-perovskite phase up           Pisconti, A., Thomas, C., and Wookey, J.: Discriminating Between
  to 6 GPa and 1300 K, Earth Planet. Sc. Lett., 268, 515–525,             Causes of D00 Anisotropy Using Reflections and Splitting Mea-
  https://doi.org/10.1016/j.epsl.2008.02.005, 2008.                       surements for a Single Path, J. Geophys. Res.-Sol. Ea., 124,
Miyagi, L., Merkel, S., Yagi, T., Sata, N., Ohishi, Y., and               4811–4830, https://doi.org/10.1029/2018JB016993, 2019.
  Wenk, H. R.: Diamond anvil cell deformation of CaSiO3 per-           Popa, N. C.: The (hkl) Dependence of Diffraction-Line Broad-
  ovskite up to 49 GPa, Phys. Earth Planet. In., 174, 159–164,            ening Caused by Strain and Size for all Laue Groups
  https://doi.org/10.1016/j.pepi.2008.05.018, 2009.                       in Rietveld Refinement, J. Appl. Crystallogr., 31, 176–180,
Miyagi, L., Kanitpanyacharoen, W., Kaercher, P., Lee, K. K.,              https://doi.org/10.1107/S0021889897009795, 1998.
  and Wenk, H. R.: Slip systems in MgSiO3 post-perovskite:             Romanowicz, B. and Wenk, H. R.: Anisotropy in the
  Implications for D 00 anisotropy, Science, 329, 1639–1641,              deep Earth, Phys. Earth Planet. In., 269, 58–90,
  https://doi.org/10.1126/science.1192465, 2010.                          https://doi.org/10.1016/j.pepi.2017.05.005, 2017.
Miyagi, L., Kanitpanyacharoen, W., Stackhouse, S., Militzer, B.,       Savage, M. S.: Seismic anisotropy and mantle deformation: What
  and Wenk, H. R.: The enigma of post-perovskite anisotropy: De-          have we learned from shear wave splitting?, Rev. Geophys., 37,
  formation versus transformation textures, Phys. Chem. Miner.,           65–106, https://doi.org/10.1029/98RG02075, 1999.
  38, 665–678, https://doi.org/10.1007/s00269-011-0439-y, 2011.        Shirako, Y., Shi, Y. G., Aimi, A., Mori, D., Kojitani, H., Yamaura,
Miyagi, L., Kanitpanyacharoen, W., Raju, S. V., Kaercher, P.,             K., Inaguma, Y., and Akaogi, M.: High-pressure stability rela-
  Knight, J., MacDowell, A., Wenk, H. R., Williams, Q., and               tions, crystal structures, and physical properties of perovskite and

Eur. J. Mineral., 33, 591–603, 2021                                                         https://doi.org/10.5194/ejm-33-591-2021
You can also read