Delivering higher renewable penetration in new land and housing developments through edge-of-grid microgrids - Case Study: Huntlee Energy Utility
←
→
Page content transcription
If your browser does not render page correctly, please read the page content below

Delivering higher renewable
penetration in new land
and housing developments
through edge-of-grid
microgrids
Case Study: Huntlee Energy Utility

May 2016
This report was produced with support from the Australian Renewable Energy Agency
(ARENA). ARENA was established by the Australian Government as an independent agency
on 1 July 2012 to make renewable energy technologies more affordable and increase the
amount of renewable energy used in Australia. ARENA invests in renewable energy projects,
supports research and development activities, boosts job creation and industry development,
and increases knowledge about renewable energy. More information about ARENA can be
found at: www.arena.gov.au

Follow us on Twitter: @ARENA_aus
Subscribe to updates: arena.gov.au/subscribe
NewActon Nishi, 2 Phillip Law Street, Canberra
GPO Box 643, Canberra ACT 2601
T: +61 2 6243 7773
Client: Australian Renewable Energy Agency
ABN: 35 931 927 899

Prepared by
Flow Systems
Level 2, 1 Alfred Street Sydney, NSW 2000
ABN 28 136 272 298

Key Contributors: Daniel Hilson and Max Zaporoshenko

Released: September 2016

                                                                                       2 of 59
Contents
1.     EXECUTIVE SUMMARY                                                               8
1.1    Lessons learnt 9
1.2    Barriers 10
1.3    Recommendations 10
2.     OPERATIONAL APPROACH                                                          12
2.1    Background12
2.2    Research approach 13
2.3    Case Study: Huntlee development15
2.4    What is the Huntlee Energy Utility? 16
2.5    Site specifics 17
2.6    What we will offer customers18
2.7    Safety standards20
2.8    Network planning21
3.     IMPACTS OF MICROGRIDS ON RENEWABLE ENERGY PENETRATION                         25
3.1    What are microgrids and how do they relate to new land and housing developments25
3.2    Impacts on renewable energy penetration in Australia26
3.3    Other social benefits of microgrids30
4.     ECONOMIC REVIEW OF EDGE OF GRID MICROGRIDS                                    36
4.1    Key assumptions36
4.2    The modelling process39
5.     TECHNOLOGY ASSESSMENT                                                         42
5.1    Control systems42
5.2    Home energy solutions46
6.     LESSONS LEARNT                                                                48
6.1    Market acceptance48
6.2    Technical lessons51
6.3    Regulatory lessons51
6.4    Commercial lessons53
7.     RESOLVING THE BARRIERS TO EDGE-OF-GRID MICROGRIDS IN AUSTRALIA                56
7.1    Regulatory barriers 56
7.2    Solving barriers through implementing the Huntlee microgrid58
Bibliography                                                                         59

                                                                                     3 of 59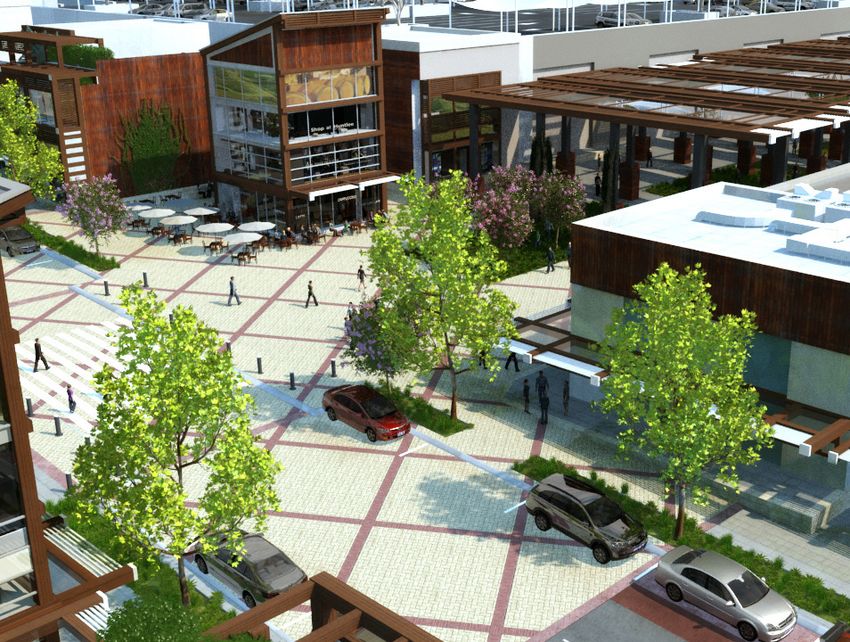
Tables and Figures
Figure 1    Huntlee infrastructure concept                                   15
Figure 2    Huntlee energy and water portal                                  15
Figure 3    Huntlee energy centre                                            16
Figure 4    Huntlee energy pricing portal                                    18
Figure 5    Microgrid reticulation network                                   20
Figure 6    Siemens microgrid concept                                        24
Figure 7    Australian rooftop solar market                                  25
Figure 8    APVI solar map                                                   27
Figure 9    Benefits of solar penetration from BAU                           28
Figure 10   Potential net benefits of microgrids on solar PV penetration     29
Figure 11   National energy objective                                        30
Figure 12   National CAPEX per customer against customer density AER         30
Figure 13   PV cost curve vs diesel cost curve                               31
Figure 14   Hunter regional plan                                             33
Figure 15   Battery cost curve                                               37
Figure 16   Battery cost curves                                              37
Figure 17   Gas price curves                                                 38
Figure 18   PV module cost curve                                             38
Figure 19   Huntlee forecasted load curves                                   39
Figure 20   Cetralised PV control system                                     42
Figure 21   Microgrid management concept                                     43
Figure 22   Generation scheduling concept                                    43
Figure 23   Converged metering and telemetry network Huntlee                 45

Table 1     Generation capacity                                              16
Table 2     Huntlee energy products                                          18
Table 3     SAIDI and SAIFI AUSGRID performance                              21
Table 4     SAIDI and SAIFI for alternative microgrid designs                21
Table 5     PV penetation in Huntlee vs BAU                                  25
Table 6     Assumptions - national PV penetration PV in microgrid and BAU    28
Table 7     Inflators                                                        39

                                                                            4 of 59
Acronyms
AER – Australian Energy Regulator
BAU – Business as usual
BEA – Brookfield Energy Australia
BoP – Balance of Plant
Co-gen – Cogeration
CAGR – Compound Annual Growth Rate
DG – Distributed Generation
DSO – Distribution System Operator
DUOS – Distribution Use of System Charges
ENA - Energy Networks Australia
GW - Gigawatt
HETA – Huntlee Energy Technology Alliance
HEU – Huntlee Energy Utility
HMM – Huntlee Microgrid Manager
IDNO – Independent Distribution Network Operator
KPI – Key Performance Indicuator
LV – Low Voltage
MG – Microgrid
MGMS – Microgrid Management System
MW - Megawatt
MV – Medium Voltage
NEM – National Energy Market
NEO – National Energy Objective
NSW – New South Wales
PDA – Priority Development Area
PV – Photovoltaic
SAIDI – System Average interruption duration index
SAIFI – System Average interruption frequency index
TUOS – Transmission Use of System

                                                      5 of 59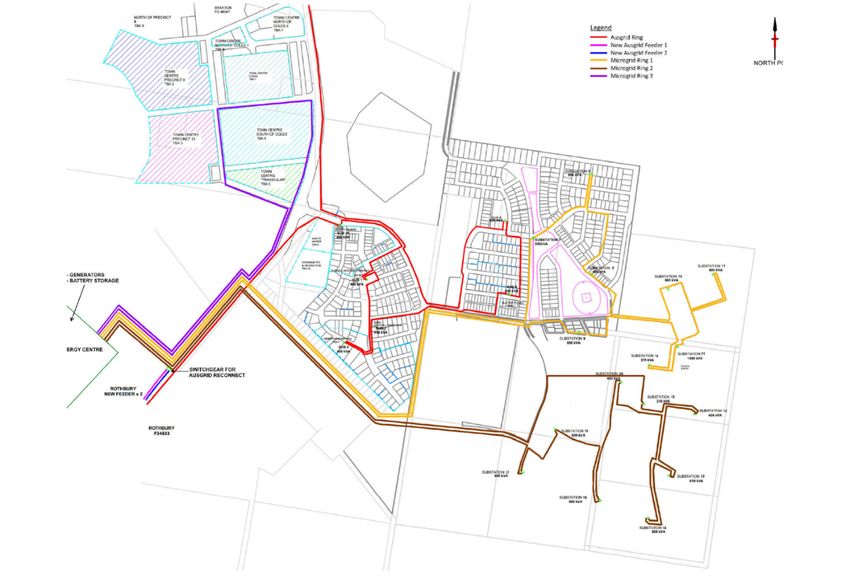
Brookfield Energy Australia (BEA) as the lead applicant has management with demonstrated track record
in the development and financing of large scale renewable energy projects and the development of
decentralised utility models involving last mile infrastructure.

BEA’s parent company, Brookfield Infrastructure Group (BIG) is the leader in community utilities in the
Australian market place. Through its local subsidiaries Flow Systems, BEA and TasGas, BIG has been
successful in building nine local energy and water communities covering over 25,000 homes when fully
developed. BIG has pioneered the concept of last-mile infrastructure innovation through its GTC subsidiary
(http://www.gtc-uk.co.uk/) and in low carbon district schemes through its Metropolitan business (http://www.
met-i.co.uk/) both in the UK. In the US BIG owns the largest district heating and cooling company, Enwave.

Flow Systems (Flow) is the organisation within BEA that delivers, operates and retails local utilities including;
Central Park energy and water infrastructure which is comprised of a district heating, cooling and embedded
electricity scheme and a local water recycling facility. Flow is a single retailer entity service servicing both
water and energy at Central Park. Flow is currently delivering the local edge-of-grid water utility on the
Huntlee site and will have billing relationships with every resident. Flow will be the billing agent for Huntlee
Energy.

LWP is one of Australia’s most innovative developers that prides itself on sustainability. Applying New Urbanist
principles putting people at the centre of their developments.

LWP are part owner and project manager of the project and have extensive knowledge and experience in
new town and community development. LWP aim to make Huntlee the premiere greenfield development in
NSW.

Given the complexity of microgrid projects, Brookfield has determined that partnering with a global expert
in Microgrid technologies would be vital to ensure that the project is delivered on time. Brookfield conducted
a market sounding including; Siemens, ABB and Schneider- the market leaders in Microgrid technology
globally. Brookfield selected Siemens based on their high level of design experience in Australia (they recently
implemented the Barangaroo microgrid) and quality of local staff.

Brookfield is working with Siemens in an alliance partnership contract. As part of the measure Siemens are
delivering the core modelling, design, implementation and performance guarantee for the core microgrid
power system and control components.

Baker McKenzie are leaders in the Australian market in legal advice in the areas of energy and environmental
markets. They have provided significant legal and regulatory advice as part of this grant and have become an
integral partner in resolving some of the more complex regulatory barriers that have confronted the project.

                                                                                                              6 of 59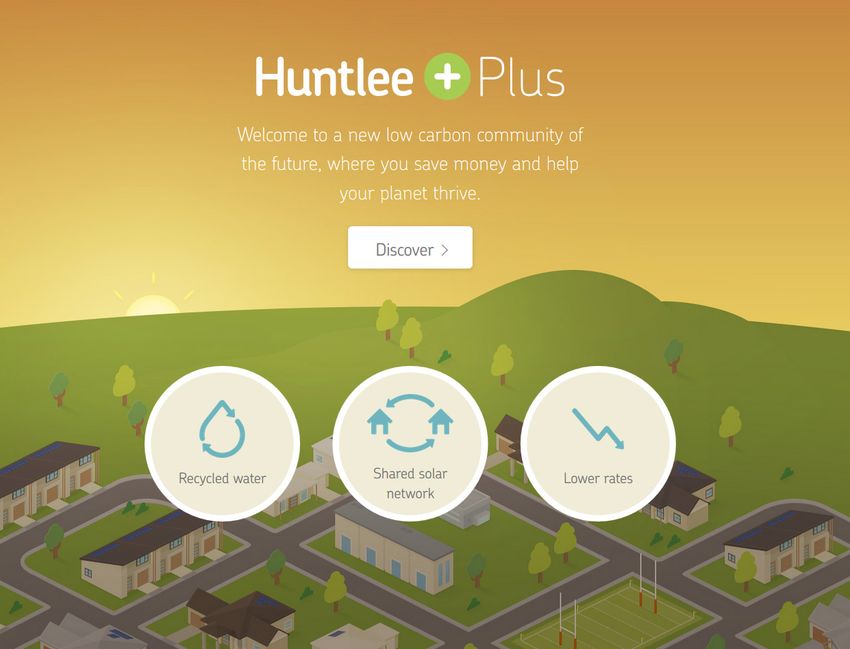
EXECUTIVE SUMMARY
EXECUTIVE SUMMARY

1. EXECUTIVE SUMMARY

This report demonstrates that Microgrids built on the edge of networks of large mixed use communities,
such as the 7,500 home community of Huntlee, can deliver significantly higher amounts of renewable
generation compared to traditional non-sustainable energy provision. It also demonstrates key benefits to the
energy market and society, including affordability and reliability. Importantly, it concludes that there are no
insurmountable barriers to delivery and that all barriers can be managed.

The demonstration project proposes the establishment of a local community energy utility (the ‘Huntlee
Energy Utility’) providing generation, network and retail services.

 •   Virtual Solar – 3-6kW on 95% of homes

 •   Solar Farm – 4MW expandable central solar farm to ensure sufficient solar penetration

 •   Smart Microgrid – Microgrid Management System’ and smart controllers at each customer
     connection

 •   Energy Centre – Gas generators, large battery storage

 •   Home Energy Packages – A variety of air-conditioning, hot water, heat pump and EV charging
     station options integrated with home controller

 •   Community Retail Services – smart metering, data management, billing and customer services

The Huntlee study shows how a Microgrid can be implemented economically while delivering key national
energy objectives of affordable, reliable, secure and safe supply.

                                                                                                            8 of 59
EXECUTIVE SUMMARY

1.1 Lessons learnt
Many of the commercial, technical, regulatory issues in relation to edge of grid Microgrids are similar in
nature to existing issues being considered in the energy market more widely. The innovation of the Huntlee
Microgrid meant that it pushed the boundaries on many of these issues and in some case required re-
thinking of the concepts.

The following are some of the key lessons learnt in this process:

  1. Expect that the Huntlee development would have up to 30MW of additional solar capacity at full
     development.
  2. If the Huntlee model could be successfully deployed nationally it could lead to as much as 400 MW
     additional capacity brought on line by 2041.
  3. Large scale microgrids have many of the challenges of the macrogrid , however microgrids enable
     better solutions to the issues faced by the macrogrid due to local control system capabilities. Managing
     peak demand is one of the key areas where Microgrids can outperform the wider network.
  4. If implemented correctly, Microgrids have many benefits for developers of land and housing
     developments in terms of reduced costs and product differentiation.
  5. If implemented with the right commercial model, Microgrids in land and housing developments will be
     well received by customers buying into those communities.
  6. Microgrids in land and housing developments have significant environmental, social and economic
     benefits and significantly improve delivery of the National Energy Objective, ARENA’s mandate and
     social objectives.
  7. Modelling these projects is extremely complex as there are few precedents and many variables.
  8. Battery prices in the short term were less commercial than anticipated for this application and will
     become commercial more commercial in a 5 year horizon based on current price curves. It became
     clear that managing solar spill through diverse load profiles was far more crucial than deploying
     batteries in the short term.
  9. It is critical that these microgrids are implemented in a manner that considers and balances the goals
     of all stakeholders: developers, residents, grid operators and owners and the wider community. There
     needs to be financial returns for each stakeholder along with a clear social license to operate.
  10. Given the innovative models and funding requirements of Microgrids the most efficient way to ensure
      wide-spread adoption of Microgrids is for a hybrid co-operative/ investor model otherwise known as a
      multi-user local ownership model.
  11. Microgrids are near to being financeable, however there is a gap due to the current pricing of batteries,
      the regulatory uncertainty, and in particular the issues associated with being a global first in terms of
      the obligations that are required to ensure that a developer and the community are comfortable with
      the project.
  12. The ideal context for Microgrids are communities which have significant servicing challenges or other
      drivers such as resilience or sustainability.
  13. The future introduction of carbon pricing will likely make Microgrids more economic than the wider
      grid.

                                                                                                            9 of 59
EXECUTIVE SUMMARY

1.2 Barriers
As with any innovation considerable barriers have emerged during this research.

Some of the key barriers included:
1. Dealing with the franchise rights of Ausgrid ( the local distribution company) to operate as a monopoly in
   areas designated to them under NSW Energy Supply Act.
2. Educating and working with the home builder supply chain rather than just the developer is essential for
   maximising the energy efficiency and demand management potential
3. Consumer lack-of understanding of microgrids
4. Appropriate regulatory framework for Multi-user local ownership model for microgrids
5. Lack of clarity in legislation for private electrical infrastructure in public roads
6. The need for clear operator of last resort framework for independant distribution companies
7. Lack of common technical standards for microgrids
8. Lack of recognition of the social, economic and environmental benefits of microgrids in the process of
   allocation of government infrastructure funding arrangements.

These barriers have been addressed in this report, either with resolutions or with suggestions provided to
regulators.

1.3 Recommendations
The key barrier to emergence of this market is the regulatory environment. The key recommendations for
regulators:
1. Establish a clear regulatory framework for microgrids
2. Establish the rules of engagement for microgrid in terms of retail, generation and network operation
   and ownership
3. Establish clear rules of engagement between existing distributors and the new microgrids

                                                                                                             10 of 59
OPERATIONAL APPROACH
OPERATIONAL APPROACH

2. OPERATIONAL APPROACH

2.1 Background
Microgrids offer an alternative for servicing new land and housing developments. This measure will
demonstrate that an edge-of-grid Microgrid technology will deliver higher renewable penetration into these
new developments than traditional approaches and will thereby deliver strongly on ARENA objectives to
reduce the costs and increase the use of renewable energy in Australia. The report also demonstrates that
this technical approach delivers strongly on the National Energy Objectives for safe, secure, reliable and
affordable power.

There are many drivers that make a structural network change necessary. A worldwide goal of reducing
carbon emissions has led to emission policies aiming to produce electricity from less carbon intensive
resources (AEMC 2012). The increased integration of renewable energy, particularly rooftop solar PV units,
and local cogeneration are making the current centralized grid structure in the national energy market (NEM)
inappropriate for the future needs of customers. Distributed generation penetration, new technologies, energy
efficiency, rising prices and other factors have resulted in a yearly decline in energy consumption since 2010.
The demand in 2013 was 4.3 percent lower than in the peak year of 2009 (Saddler 2014). The current
NEM infrastructure is not able to adapt to all these changes in its current form requiring a structural change
in the NEM is required in order to ensure reliable, secure supply at an efficient price.

These changes are also impacting on the process of land release of developable land for new housing
supply in Australia. There are many developers who seek to develop new communities that are sustainable
environmentally, economically and socially. They are also recognising that they have a duty of care to
their customers to provide infrastructure that is future proof, given many of these developments are 30
year projects. These developers align with the goals of ARENA and are recognising that Microgrids are a
technology that will deliver on their objectives.

This measure relates to a live opportunity to implement the most ambitious, privately-funded Microgrid
project in land and housing developments globally with the objective of lowering prices for end customers.
The Huntlee development in the Hunter Valley is a 7,500 home development being implemented by LWP, a
developer who prides themselves on innovative and sustainable place-making.

                                                                                                            12 of 59
OPERATIONAL APPROACH
LWP and a consortium of industry leading partners led by Brookfield Energy Australia (BEA) and Flow
Systems (Flow) have been working on this project for several years and this measure is an integral part
of demonstrating the feasibility and detailed design of this project. The outcomes of this measure will be
the validation that this innovative approach can be practically implemented, to outline barriers, to suggest
solutions to these barriers and to create a re-usable knowledge base. The aim will be to increase industry
capacity and remove regulatory and commercial roadblocks to wide-scale deployment of similar microgids in
the future. In addition to delivering these knowledge outcomes, this measure is a preparatory activity for the
commercial deployment of the Microgrid in Huntlee which will become the exemplar for developers who are
considering similar projects.
The measure will create knowledge and information that will give LWP and future developers comfort that
the Microgrid concept is technically and commercially feasible. This knowledge will also build capacity in
the market for high penetration renewable Microgrids within Australia and potentially drive a market with
significant export potential in an area that Australia has significant competitive advantage given its history of
implementing remote networks.
It is important to note that although there are several options to the deployment of Microgrids in terms of
business models, this report investigated only the approach taken by Huntlee which is often referred to as the
“multi-user” local ownership model for Microgrids, an approach that is widely seen as the most appropriate
model to ensure wide-spread adoption of the technology.
2.2 Research approach
The unique aspect of this research is that it was conducted on a live project opportunity, which will be the
subject of a future ARENA project grant application. While there was a process used to produce this report
and the relevant findings, there has been a simultaneous process in place to implement the actual project. As
such the technical and commercial aspects of the research have been conducted on the basis that they must
produce a “bankable” project.
It became clear that there are significant interdependencies between technical, commercial and regulatory
issues. The development of technical and commercial models was a highly iterative process, as new learnings
in one area would drive changes in other areas. The reality is that there are no existing technical, regulatory
or commercial frameworks that entirely capture the intent of the large scale community micro grid proposed
in this study.
The following is an overview of the approach to commercial, technical and regulatory aspects of the project.
2.21 Commercial Process
The process involved a number of steps. Firstly it was important to understand the core drivers of the key
project stakeholders being the financier (BEA) and the developer (LWP). Understanding the constraints of
risk and the perception of the opportunity was critical to identification of the commercial roadblocks. A set of
key performance indicators (KPI’s) was identified by both parties which created a set of feasibility “gates” that
required satisfaction in order for the project to proceed. Differing expectations and gates were established for
the developer and financier.
13 of 59OPERATIONAL APPROACH
2.22 Regulatory Model
The approach taken to understanding and applying the current regulatory regime was to gain a broad
appreciation of the current legal frameworks that would apply to this area. As we moved through the
commercial issues we would set our commercial objectives against the regulatory model. Once we had fairly
strong understanding of the current regulatory environment we were able to test the findings by seeking
feedback from the Australian Energy Regulator and other government agencies and through participation in
various AER and AEMC market sounding processes.
Once the formal position of the AER was understood we re-set the approach in order to come up with a final
position.
2.23 Technical Approach
The approach taken to the technical models was similar to any integrated resource planning approach for
an integrated network/retail energy market. A long term understanding of load was developed and mapped
against home and commercial energy usage futures. An understanding of seasonal peak demands and
then extreme weather events was determined and this drove the approach to peaking plants and demand
management. The optimal generation mix was developed using a long run marginal cost approach. This
overlayed a set of assumptions with respect to technology price curves and energy cost indexing. Customer
pricing was set against long term NEM pricing expectations, which created an effective cap on revenue
potential1.
A part of the project was consideration of the impact of network augmentation on the developer however
the current technical approach did not consider the integrated resource planning across the wider NEM
in detail. The calculation of benefits of non-network options in network planning is complex as it requires
consideration of demand mitigating options against the traditional options such as rewiring, network
reconfiguration and installation of protection devices. In addition to these are the social questions around
differing network options (Martins, 2011). The concept of non-network solutions to the challenge of the
NEM has been well documented and explored in a recent process driven by the University of Technology
Sydney2.
1 Best Practices in Electric Utility Integrated Resource Planning Examples of State Regulations and Recent Utility Plans
2 http://www.uts.edu.au/research-and-teaching/our-research/institute-sustainable-futures/our-research/energy-and-climate-1
14 of 59OPERATIONAL APPROACH
2.3 Case Study: Huntlee Development
Huntlee is located 2.5 hours from Sydney or 50 minutes from Newcastle. It is a $1.5 billion, 25-year project
which will yield 7,500 new dwellings and 20,000 new residents. It is to be developed as four villages around
a central town centre. It will include housing, education, commercial, health and recreational facilities and
aims to create 3,000 new jobs.
In 2013 LWP established a working group to explore innovative concepts, particularly around local utility
services. The Huntlee Enterprise and Technology Alliance (HETA), led by Damian Griffith, produced a series
of reports investigating the feasibility of an off-grid local network owned by a local utility. These reports
included regulatory advices, energy efficiency, high penetration solar and biomass generation options. HETA
was successful in launching a local water utility which is servicing the community. This water utility is being
implemented, operated and owned by Flow. These early advices have formed the groundwork for this
measure, and the measure builds on this to get to a final model that is financeable and replicable.
The developer (LWP) was motivated by its innovative
culture, and a desire to be a placemaker and build
a community and not just do a typical subdivision.
LWP also wanted to drive down the cost of living for
residents, contribute to the environmental benefits and
offer a differentiated product.
In 2014 LWP sought expressions of interest for the
energy project and following a six months tendering
process BEA and Flow were awarded the contract to
prepare a feasibility study for a local energy utility.
This ARENA grant is based on the work done by HETA
as well as the work done in the past year by BEA and
Flow to deliver a viable concept for an independent
community utility.
15 of 59OPERATIONAL APPROACH
2.4 What is the Huntlee Energy Utility?
This project revolves around the establishment of a local community utility which is technically implemented
as follows:
• High penetration renewable energy
with solar panels on each house being
owned and operated by the community
utility - a local smart microgrid.
• The community’s network will be
powered by a local energy centre
through a Microgrid Management
System (MGMS), battery storage and
gas generators.
• A centralised solar power plant.
• A set of consumer energy services Figure 1: Huntlee infrastructure concept
packages that have been created
around the concepts of innovative,
extensible, affordable, safe, secure and
reliable supply. In addition focus has
been given to obtaining and maintaining
a clear social license to operate using a
community co-operative structure.
• A retail energy function to support
metering, meter data management, billing
and customer services.
• A smart grid which includes technologies
to support better fault detection and
management.
Figure 2: Huntlee energy and water portal
Further information about the technical approach is outlined in the Techno-Economic Analysis in the later part
of the document.
16 of 59OPERATIONAL APPROACH
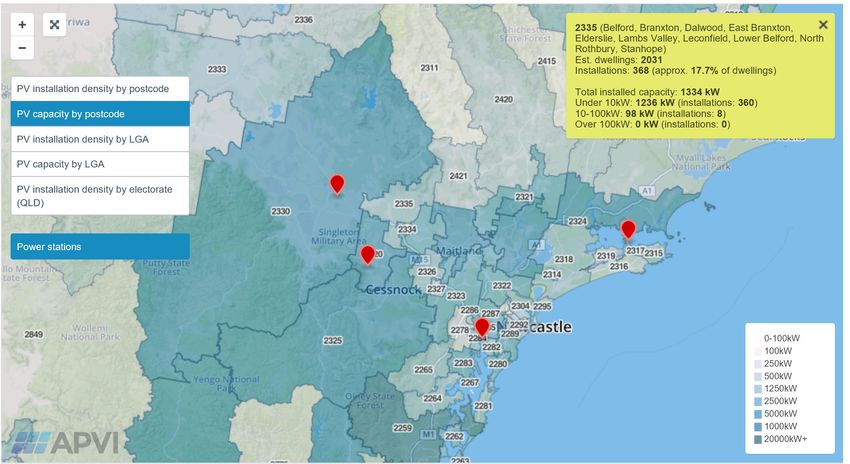
2.5 Site Specifics
2.51 Layout and Equipment
The local energy centre will consist of a central building which will house generators and heat recovery
equipment. There will also be a solar farm and a large centralised battery storage facility. Table 1 below
shows the total installed capacities of the equipment.
Technology Capacity
(2,400 lots)
Solar 10.1MW
Battery Storage 2.3MWh, 1MW max. output
Gas Generators 5.1MW
Diesel Generators 0.9MW
Table 1: Generation Capacity
Figure 3: Huntlee Energy Centre
17 of 59OPERATIONAL APPROACH
2.6 What we will offer customers
When modelling the financial investment case for the Huntlee Energy Utility, it was important to balance a
number of competing items and concepts from a community offering perspective:
• The power needed to be more affordable than that available from outside the community. The ability
not only to create lower cost energy from a Levelised Cost of Energy (LCOE) perspective, but also
incorporating the total lifecycle costs of energy services to a house, including the costs of energy cost
savings over time;
• It is vital, given the nature of a local distribution services operator being a monopoly, that the concept has
a strong social license to operate. As outlined in (IPSOS, 2015) 87 percent of consumers support roof-
top solar and only 5 percent of consumers are opposed to large scale solar. Interestingly, this report also
identified that:
• To fulfil the vision of the energy utility we need to offer products that will encourage energy efficiency
• We needed to ensure that we implemented infrastructure that could manage peak demand, but that
would be socially acceptable to customers
• We needed products that were easily understood by consumers
• We needed products and a supply chain that could work with the home builders in the community
• We needed to use technology that was seen as “smart” and “efficient”
The products for Huntlee were created via an iterative process with input from market research that was
conducted for the project. The products that emerged were essentially based on “smart” air-conditioning and
“smart” hot water systems along with community owned solar and electric vehicle charging stations.
An important innovation is that we have separated returns for the owner of the home from savings for the
residents, recognising that even if home owners rents their property, it is the owner that makes decisions
about the energy efficiency of their home.
Feedback from the market research indicated that simple products in the short-term was preferable. It
remains the intention to introduce more products over the long-term.
18 of 59OPERATIONAL APPROACH
Product Description Benefits
Solar Only Every home will be eligible for Home owner or occupier receives
solar which will be paid for by the low energy pricing
utility
Solar and Smart Hot Water Smart Hot water is essentially Home owner receives annual
controllable hot water. A series dividends and low energy pricing
of compatible efficient hot water
systems will be offered
Solar and Smart Air Conditioning Smart Air-Conditioning is Home owner receives annual
controllable air-conditioning. dividends and low energy pricing
A series of compatible energy
efficient air-conditioning systems
will be offered
Solar and Smart Hot Water and A combination of the above Home owner receives annual
Air-conditioning dividends(higher) and low energy
pricing
Solar and Ground-Sourced Heat A heat-pump using geo-thermal Home owner receives annual
Pump head differentials to provide hot dividends(higher) and low energy
water and air-conditioning pricing
Electric Vehicle Charging to the Lower price electricity and higher
above (can be added to any of the dividend
above packages)
Table 2: Huntlee energy products
Flow has created a calculator using the ARENA grant. This was aimed at clearly explaining products available
to home purchasers and home builders and to also enable the purchasers to make the connection between
their decisions and the local community utility.
Figure 4: Huntlee energy pricing portal
19 of 59OPERATIONAL APPROACH
2.61 Customer Charter
Along with plans and position, we needed to create a “Customer Charter” to clearly articulate the position of
the utility so that we could commit to deliverables that would ensure our social license.
We will:
• Aim to offer the best price
• Connect your property within the agreed timeframe
• Seven days notice of scheduled maintenance and engineering power disruption
• Services based on easy to understand terms and conditions
• Clear information about prices and price variations in advance
• No charge for late payment fees
• Payment management support during times of hardship or financial difficulty
• Extra care for vulnerable members of the community, through hardship protections, life support planning
and assistance with securing eligible customers government rebates and concessions
• Extend to customers, all relevant consumer protections set out in the National Energy Rules, to the extent
that they apply to the Off-Grid community
• Exceed or meet the services standards provided to on-grid communities by the local area distributor
• Deliver significantly lower carbon energy than the published National Electricity Market Carbon Dioxide
Equivalent per Megawatt hour (CO2-e/MWh)
2.7 Safety standards
All equipment shall be designed, manufactured, installed, tested and operated in accordance with relevant
Australian Standards. Where relevant Australian Standards do not exist, the equipment shall conform
to relevant international standards in the following priority order: IEC, CIGRE and IEEE. In addition, all
materials, equipment and work covered by this specification shall conform to the requirements of all statutory
authorities having jurisdiction over the site.
20 of 59OPERATIONAL APPROACH
In all references to standards and codes the latest edition at the time of order shall be used unless indicated
otherwise. The following standards are deemed applicable to ensure the safe delivery of electricity to Huntlee
consumers.
Standards:
• AS60038 • AS 3000
• AS 61000.3.100 • AS 61000
• AS 61000.2.2
In addition to the above, the design, operation and maintenance of the Microgrid shall comply with the
following acts and regulations:
• Electricity Supply Act 1995 (NSW)
• Electricity Supply (General) Regulation 2014 (NSW)
• Electricity Supply (Safety and Network Management) Regulation 2014 (NSW)
• Work Health and Safety Act 2011
• Work Health and Safety Regulation 2011
• Code of Practice – Electricity Transmission and Distribution Asset Management
2.8 Network Planning
The following diagram outlines the network reticulation for the off-grid network. At a high level this is very
similar to a standard Ausgrid network. This network will however have a layer of added smarts that will
enable it to operate more efficiently and provide a higher level of reliability than a standard electrical network
(see SECTION 4).
Figure 5: Microgrid reticulation network
21 of 59OPERATIONAL APPROACH
2.81 Benchmark for assessing downtime/failure rates
The benchmarks for assessing downtime and failure rates are well established globally. BEA will comply
with these standard benchmarks. Two related indices are applied when reporting reliability. The first, SAIDI,
is commonly referred to as the “Reliability Index” and represents the average number of customer minutes
lost by all network customers. SAIFI represents the average number of interruptions for all customers. It is
important to note that based on Australian Energy Regulator (AER) guidelines, the SAIDI includes scheduled
outages but excludes Major Event Days based on a Major Event Day Threshold (Tmed) calculations. Such an
outage is defined as a day where the daily SAIDI value exceeds a threshold value.
The following table is extracted from Ausgrid’s Electricity Network Performance Report 2014/2015 for urban
feeders. BEA proposes to match these performance benchmarks.
YEAR 2010/11 2011/12 2012/13 2013/14 2014/15
ACTUAL 82.37 72.21 56.43 64.74 58.41
SAIDI TARGET 80 80 80 80 80
ACTUAL 0.97 0.80 0.65 0.74 0.57
SAIFI
TARGET 1.20 1.20 1.20 1.20 1.20
Table 3: SAIDI and SAIFI AUSGRID performance
2.82 Microgrid Reliability Indices
For the electricity supply to lots in stages 10 to 15, the reliability performance has been calculated for
both maximised and minimised network design. The table below shows the figures of SAIFI and SAIDI for
maximum reliability and minimised cost designs, respectively. The minimum and maximum values are related
to results obtained at respective lots, whereas the average value is calculated based on the individual results
of all lots.
MAXIMUM RELIABILITY DESIGN MINIMISED COST DESIGN
SAIDI SAIFI SAIDI SAIFI
Minimum Value 16.8 0.412 15.6 0.355
Average Value 20.4 0.461 95.0 0.440
Maximum Value 27.1 0.545 238.4 0.489
Table 4: SAIDI and SAIFI for alternative microgrid designs
The two scenarios are compared in detail below:
• The maximised network reliability design shows a significantly better reliability performance compared
to minimised cost design. Maximised design results in similar average frequency of supply interruptions
compared to minimised design. But, with respect to unavailability or SAIDI, differences are significant as
for maximised design, this index is only 20 percent of the one obtained for minimised design.
• Due to the increased number of ring main units in the maximised design, the size of low voltage (LV)
networks supplied by any one ring main unit is reduced. Consequently, there are less components (and
customers) within an LV tripping area being affected in case of a failure. However, this advantage is at
22 of 59OPERATIONAL APPROACH
the cost of having additional ring main units in the high voltage (HV) cable ring contributing to the fault
occurrence and in the end leading to a slightly higher frequency of supply interruptions in scenarios for
the maximised design.
• For the maximised reliability design, customers strongly benefit from the interconnection possibilities
on the low voltage level which allows a fast re-supply of customers when isolating a faulted section of
network.
• When considering the scenarios individually, it can be stated that differences between minimum and
maximum values are moderate with respect to frequency of supply interruptions. Regarding unavailability,
however, differences are very high for the minimised network design. The probability of supply
interruptions or unavailability at the lot is about 15 times higher in the worst case.
• In the minimised cost scenario, maximum unavailability is experienced by customers at the end of the
radial LV feeders as their power supply is interrupted whenever a failure on the feeder occurs and the
duration of supply interruption equals to the down-time of faulty equipment unless power supply via
emergency generation units is provided quickly, i.e. faster than the average duration of supply interruption
(~4h).
23 of 59IMPACTS OF MICROGRIDS ON RENEWABLE ENERGY PENETRATION
IMPACTS OF MICROGRIDS
3. IMPACTS OF MICROGRIDS
ON RENEWABLE ENERGY
PENETRATION
3.1 What are Microgrids and how do they relate to new land and
housing developments
There is no universally accepted definition of a Microgrid as the technology is still developing. The accepted
minimum or maximum size (MW) for a Microgrid will depend on its generation resource types, and storage
and control possibilities (MG Institute 2014). One definition from the US department of Energy (2012) is:
‘a group of interconnected loads and distributed energy resources within clearly defined electrical
boundaries that acts as a single controllable entity with respect to the grid. A MG can connect and
disconnect from the grid to enable it to operate in both grid- connected or island- mode’.
For ease of use when we talk about Microgrids in this document we will be referring specifically to edge of
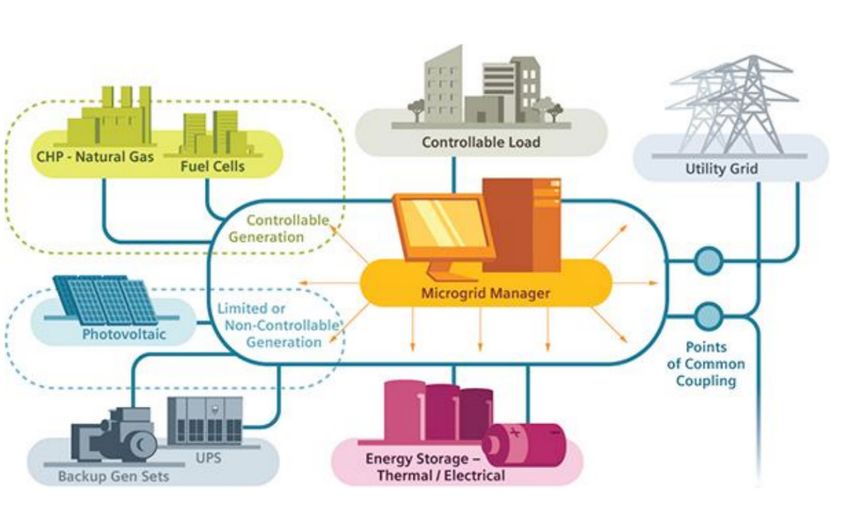
grid Microgrids. Figure 6 is Siemens conceptualisation of a Microgrid. This shows the function of a control
system with respect to the grid and the various input that are required from the control system. This control
relates to both the generation, storage and the physical network itself which becomes a network with greater
control and self-healing properties than the wider grid.
Figure 6: Siemens Microgrid Concept
25 of 59IMPACTS OF MICROGRIDS
Microgrids have typically been used as diesel generation substitutes for remote communities or for
universities, military, commercial and industrial contexts. In the last few years it is becoming clear that
Microgrids are not only beneficial to these applications, but are becoming a key part of the future grid
transformation more widely. In the current Energy Networks Australia funded “transformation roadmap”
Microgrids were seen as a significant part of the future of customer centric engagement3.
In the edge of grid context Microgrids can be used to service large numbers of mixed use communities,
typically based on low to mid density of dwellings. The Microgrid itself in this environment refers to the
physical network and generation assets.
3.2 Impacts on Renewable Energy Penetration in Australia
The purpose of this research is to establish whether Microgrids in the land and housing context will have a
significant impact on renewable energy penetration in Australia. The method is to use the Huntlee case as an
example to see the impact on that development and then to extrapolate this across Australia.
To determine the impact of Microgrids it is important to establish the baseline that we are comparing
against. There are many drivers of solar penetration in land and housing developments including location,
government incentives, developer preferences and the quality of the housing product (ie is it in an up-market
location).
The ESSA produced a fact sheet on renewable penetration in Australia and found the penetrations of solar in
each state as outlined in the following figure 7.
Figure 7: Australian rooftop solar market
3 Network Business models last accessed 25 April 2016 http://www.ena.asn.au/sites/default/files/network_business_models_accenture_report_
john_bradley_final.pdf
26 of 59IMPACTS OF MICROGRIDS
Within new land and housing developments it is expected that the penetration would be slightly higher than
in the past, although it depends on the developer drivers and the incentives at the time. There is limited
research into future adoption of solar in land and housing developments.
Our research suggests that Microgrids enable higher deployment of renewables if there is a model in place
that incentivises take-up of solar and thus providing an incentive to replace any government incentive
scheme. More than that, by creating a local “virtual power plant” and district storage solutions, it maximises
the efficiency of power use by socialising the output of panels within the community, minimising the solar spill
from within the community.
In addition to the economic drivers, as our market research demonstrated there is also the buy-in that the
community has to the concept that will drive additional adoption.
Finally, the nature of Microgrids means that the optimal mix of solar/battery deployment can be achieved by
adding renewable energy to the mix through central solar plants even if the take up on homes is not enough.
Commercial areas can also be included in the mix which leverages the larger roof space areas within the
community.
3.21 Modelling the benefits
Through modelling the Huntlee Microgrid we found that the optimal solar uptake rate to make the the
Microgrid economic is considered to be a 5kW rooftop array on each dwelling. Given it is not possible to
know how many homes will adopt solar, we used an estimate of 2kW of solar per home to account for either
smaller arrays than anticipated or lower adoption of solar panels.
To establish a BAU benchmark we used the Australian PV institute tool. Figure 9 shows the PV penetration
currently in Branxton postcode being at 368 out of 2335 dwellings or 17.7 percent4. The total installed
capacity is 1334 kW or 3.6 kW per dwelling.
Figure 8: APVI solar map
4 http://pv-map.apvi.org.au/historical#9/-32.6879/151.4410
27 of 59IMPACTS OF MICROGRIDS
We created a model to understand the benefits of the Microgrid against business as usual (BAU). As outlined
above the Huntlee Microgrid PV per home would be 4 kW with 100 percent penetration regardless due to
the make-up of penetration from a ground-mounted PV plant on site. Given the reductions in solar prices
(see table 5) an assumption was made that PV penetration in future homes would increase by 15 percent
per annum.
Aspect Huntlee BAU Huntlee Microgrid
PV size (kW per home) 3.6 4
PV Adoption 20% 95%
Annual increase in PV penetration (outside Huntlee) 15% N/A
Lots per annum 200
PV Output per kW 1362 1362
Table 5: PV penetation in Huntlee vs BAU
For Huntlee we are assuming in our financial model that 200 new homes would be added per annum. The
graph in figure 10 outlines the net benefits of the Huntlee Microgrid against BAU, which is that by the time
the community has 7500 lots it would have an additional 13 MW or 15 GWh of PV penetration.
Figure 9: Benefits from solar penetration from BAU
What this did not take into consideration was the increased penetration on commercial buildings which
would significantly add to this penetration.
This basic model does not relate to the value in terms of solar output. RFI Solar identified that in 10 years
time it is estimated that the same size panel will produce 18 percent more power. This will significantly
increase the net benefits of solar penetration in Microgrids.
It is more difficult to determine the impact of these models on the grid more widely as there are varying
levels of solar uptake in each state. To determine the penetration consideration must be given to a national
average, and also how many of the new homes will install solar panels within a few years of being
constructed.
28 of 59IMPACTS OF MICROGRIDS
To estimate the figure we looked at the current penetration rates in Branxton (figure 10), and then looked at
the existing household penetration.
Currently more than one in seven Australian households had installed solar PV. This is a 15 percent
penetration rate across all Australian households. In NSW household penetration was 10.25 percent. In
South Australia and Queensland the household penetration rate is 25 percent and 24 percent respectively.
Some suburbs in greater Brisbane and Adelaide have recorded household solar PV penetration rates above
50 percent5.
The following analysis is based on the conservative assumption that there will be up to 1,000,000 new land
and housing homes in Australia in the next 25 years to 2041. If we were to aim for 15 percent of these
homes to be serviced by Microgrids , then that would be approximately 6,000 new homes serviced by micro
grids each year. The following assumptions are similar to those above, except there is an assumption that
25 percent of homes will be built with PV today and that there would be an incremental 20 percent more
built with solar each year. The 25 percent is supported by the ENA Fact Sheet along with the Electricity
transformation roadmap which estimated that around 50 percent of energy would be produced locally by
2050 (Energy Networks Australia, 2015).
Aspect National BAU Huntlee Microgrid
PV size (kW per home) 3.6 4
PV Adoption 25% 95%
Annual increase in PV penetration (outside Huntlee) 20% N/A
Lots per annum 200
PV Output per kW 1362 1362
Table 6: Assumptions - national PV penetration PV in Microgrid and BAU
The result of this is around 250 MW of additional solar from now to 2041 producing 317 GWh hours per
annum. This is again conservative given the improved energy output and the fact that commercial areas
were not included in the analysis. Figure 10 shows the potential national net benefits of Microgrids to solar
penetration.
Figure 10: Potential Net Benefits of Microgrids on Solar PV Penetration
5 http://www.energycouncil.com.au/Library/PageContentFiles/14251626-ae50-48a1-8fb0-70841eae409f/ESA002_factsheet_renewables.pdf
29 of 59IMPACTS OF MICROGRIDS
3.3 Other social benefits of Microgrids
3.31 Benefits for Developers
This Measure is concerned with the application of Microgrids in land and housing developments. The project
at the centre of the study Huntlee is a new town so by definition represents an extension of the existing grid.
Often large new developments such as Huntlee present an ideal application for Microgrids:
• Typically these areas have high headworks charges (ie charges for getting utility infrastructure to a site)
• Developers are trying to differentiate themselves with innovation and sustainable product
• The new trend towards integrated infrastructure that takes advantages of synergies between infrastructure
(the energy/water nexus)
• New build does not have the legacy infrastructure of infill infrastructure
• Given these are often 30 year developments, deploying future-ready infrastructure is a critical decision at
the start of a development
In the case of Huntlee, the drivers were primarily sustainability, affordability and innovation. The area is
relatively well serviced given its position in the Hunter Valley, an area that has been at the centre of coal-fired
generation for NSW. Even with this infrastructure the headworks charges are as high as $9 M for the life-
cycle of the development.
There are many limitations in our current infrastructure delivery model that do not allow developers to deliver
new homes in the best possible manner to create liveable and affordable communities. The objective of HETA
was to challenge the way that land is serviced by water, energy and telecommunications infrastruture.
The developer recognised the integrated benefits of combining local energy and water infrastructure (often
referred to as the water/energy nexus). By driving appropriate water cycle management higher amounts of
greenspace are available via locally sourced irrigation even during sustained heat-waves. This lowers heat
island effect and therefore decreases the amount of energy draw from the community. At the heart of these
types of principles is the idea of area specific economic systems that enable higher productivity, sustainability
and liveability for new developments. It revolves around “fit-for-purpose infrastructure” and Microgrids are at
the heart of this form of servicing land.
3.32 Electricity network planning benefits “promote efficient investment in, and efficient
operation and use of, electricity services for the
To understand the overall benefits of microgrids to long term interests of consumers of electricity
electricity planning it is important to look wider than with respect to:
new land and housing developments. A framework
for a contestable market for microgrids will be (a) price, quality, safety, reliability and security of
based on its overall impact on the National Energy supply of electricity; and
Objective (NEO). As such it includes existing edge of
grid networks and other commercial and military (b) the reliability, safety and security of the
applications. national electricity system”
The National Energy Objective (NEO) is outlined In many quarters the approach to be successful
in Figure 11. In various parts of this report it the edge of grid model will need to demonstrate
demonstrates that microgrids deliver benefits from that it aligns with this objective.”
the perspective of all of these criteria and more.
Figure 11: National Energy Objective
30 of 59IMPACTS OF MICROGRIDS
Figure 12 (Australian Energy Regulator, 2015) identifies that the cost to distributors for providing
network services increase as they are forced to service areas of lower customer density. The place for
Microgrids is the ability to service new land and housing developments which are inherently low density,
in ways that reduce the cost borne by the local distributor, but reduces the overall socialised cost to the
network, as that local community is served in manner that is fit-for-purpose.
Figure 12: National CAPEX per customer against customer density AER
A reference for the types of savings that could be achieved was presented in Thorpe, 2015 also outlined
that there is 100,000 km of network that could currently be classed as edge of grid. They stated that if “a
ten percent saving in only ten per cent of these lines were available for a Microgrid, the saving would be of
the order of $50M, far outweighing the likely cost of regulatory and policy changes needed to facilitate the
option.”
In another report created by AECOM for ARENA another key market that (AECOM, 2014) identified is mines
and communities being run on diesel generators:
“over 1.2GW of diesel generation capacity
installed in off-grid Australia which supplies
electricity to mines and communities at a cost
of $240-450/MWh in fuel only (excluding
capital costs). These costs are expected to
rise over time and are vulnerable to price
shock events or supply chain interruptions in
international markets.”
Figure 13: PV cost curve vs diesel cost curve
31 of 59IMPACTS OF MICROGRIDS
3.33 Economic Value Streams
The economic value streams created by Microgrids are primarily derived from the value-capture of lower or
nil (if off-grid) transmission use of system (TUOS) and distribution use of system (DOUS) fees, along with any
fees associated with network losses given that the Microgrid uses 100 percent locally generated energy. The
other value capture comes from greater ability to manage the critical peak within the community, creating a
flatter demand curve – the holy grail of energy management.
In a well-regulated market, grid-connected Microgrids can also deliver benefits back to the grid through a
transactive market for ancillary services. By aggregating loads and providing localised control, they have the
potential to improve voltage profiles and postpone network upgrades (where thermal limits are key factor),
control support, congestion management, reduced grid losses, improved power quality and provide black-
start and grid-forming operation.
Value streams can also be achieved through improving price elasticity of the wider market as Microgrids
reduce reliance on peaking plants with their ability to island at peak demand events.
To give one example, Dunstan et al (2011c, pp. 65-8) suggested that in the period to 2020 there is the
potential for Distributed Generation (DG) to provide over 4000 MW of peak power at a lower cost than
expanding centralised supply capacity. This represents about 10 per cent of peak power requirements.
The other economic value stream is created through deferral of infrastructure upgrades in the network. There
are currently regulatory frameworks to capture this value such as the non-network options regimes that
have been created by the AER.
All these value-capture streams can then be used to pay for the infrastructure, deliver an economic return to
an investor in the infrastructure and then be used to deliver dividends to a community.
3.34 Power quality and reliability – a comparison with the Ausgrid Network
Microgrids can deliver not only higher levels of power quality and reliability but are also able to create
various tiers of quality and reliability in a way that is fit for purpose. In the case of Huntlee, decisions can be
made in the long term (once the community is more comfortable and engaged in the utility) as to whether
compromises can be made on quality for some applications to drive prices down in the long term.
To understand the reliability of the Microgrid we created a comparison to the Ausgrid network. It is important
to note that this network design and associated reliability assessment was done for 300 lots only. These
numbers rely on scale and as we model a larger number of lots, the figures improve. Ausgrid’s numbers are
calculated on a full scale utility network and therefore yield a better result.
According to Ausgrid’s Electricity Network Performance Report 2014/15, the urban feeder performance
(normalized) trend comes to:
• 0.746 1/a actual SAIFI (average value based on the years 2010-2015) – target: 1.2 1/a
• 66.83 min/a actual SAIDI (average value based on the years 2010-2015) – target: 80 min/a
Given these assumptions, the calculated average frequency of supply interruptions for the Huntlee Microgrid
is almost half of the actual SAIFI value for both scenarios. This relation is expected to still be valid when the
generation units (Diesel generators and PV plants) are considered in addition.
With respect to unavailability performance, the values calculated for a minimised investment scenarios are
exceeding both actual and target SAIDI. For the maximised scenario, calculated values are about 1/3 of the
actual SAIDI and 1/4 of the target SAIDI. It is expected that if the minimised cost scenario is chosen, the
32 of 59IMPACTS OF MICROGRIDS
actual SAIDI of Huntlee Microgrid would be closer to the range of the Ausgrid SAIDI mentioned above. The
actual SAIDI is expected to be significantly better than Ausgrid’s performance trend if one of the maximised
scenarios is realised.
There is one good reason why Microgrids are currently primarily used by Military, Universities, schools and
hospitals, they all demand reliability that is not provided by the wider grid.
An example of this resilience is that Hurricane Sandy cut power to 8.5 million people, including one million
without power for a week and 60 percent of diesel generators failed for critical facilities. At the same time a
5 MW cogeneration plant and 5.3 MW solar Microgrid kept Princeton university live throughout. At the same
time Oaks Hospital on Long Island was able to disconnect and operate for fifteen days using 1.25 MW CHP
and 47 Kilowatts of solar.
In terms of Huntlee this resilience is further extended by the local water centre which will enable local
generation of water from sewer for use in toilet flushing, clothes washing and irrigation.
3.35 Unlock housing supply and assist delivering the vision of developers
When developers look at new land, they have to consider the cost of servicing the land for essential services
such as transport, water and energy. The Huntlee development was relatively well serviced from an electricity
perspective however the infrastructure was still going to cost Approximately $6.6M net present cost in lead-in
infrastructure costs in a business as usual basis. The local providers of power had a very uniform regulated
process for engaging with the developer which means that they were not able to explore options such as the
Microgrid.
In many cases around Australia development
sites are not moving forward in prime locations
because they cannot be serviced in an affordable
and timely way. In the Hunter itself there is a
demand for 60,000 new dwellings to 2036
(Hunter Planning, 2015)
The South East Queensland, SEQ, 2009-31
Regional Plan for priority development areas
(PDAs) allocates 754 000, additional dwellings
needed to accommodate the population growth in
the south east region.
Another example is the NSW Government
established the North West and South West
Priority Growth Areas in 2005 to sustainably
plan Sydney’s growth on its urban edge. Over
the next 25-30 years, the Priority Growth Areas
will become new communities for up to 500,000
Figure 14: Hunter Regional Plan
people with 181,000 homes
All of these developments will require significant infrastructure investment in the area. Typically investment
needs to be staged in a way that allows for the extension of exising infrastructure, rather than allowing for
“out of sequence” developments to occur. This stifles new developments which may be ideal for development,
but remote from existing trunk infrastructure lines.
33 of 59You can also read