Delta-Tocotrienol Modulates Glutamine Dependence by Inhibiting ASCT2 and LAT1 Transporters in Non-Small Cell Lung Cancer (NSCLC) Cells: A ...
←
→
Page content transcription
If your browser does not render page correctly, please read the page content below
H

      OH
           OH
                metabolites
Article
Delta-Tocotrienol Modulates Glutamine Dependence
by Inhibiting ASCT2 and LAT1 Transporters in
Non-Small Cell Lung Cancer (NSCLC) Cells:
A Metabolomic Approach
Lichchavi Dhananjaya Rajasinghe, Melanie Hutchings and Smiti Vaid Gupta *
 Department of Nutrition and Food Science, Wayne State University, Detroit, MI 48202, USA;
 lichchavi.rajasinghe@wayne.edu (L.D.R.); dv2329@wayne.edu (M.H.)
 * Correspondence: sgupta@wayne.edu; Tel.: +1-313-577-5565

 Received: 30 November 2018; Accepted: 4 March 2019; Published: 13 March 2019

 Abstract: The growth and development of non-small cell lung cancer (NSCLC) primarily depends on
 glutamine. Both glutamine and essential amino acids (EAAs) have been reported to upregulate mTOR
 in NSCLC, which is a bioenergetics sensor involved in the regulation of cell growth, cell survival,
 and protein synthesis. Seen as novel concepts in cancer development, ASCT2 and LAT transporters
 allow glutamine and EAAs to enter proliferating tumors as well as send a regulatory signal to
 mTOR. Blocking or downregulating these glutamine transporters in order to inhibit glutamine uptake
 would be an excellent therapeutic target for treatment of NSCLC. This study aimed to validate
 the metabolic dysregulation of glutamine and its derivatives in NSCLC using cellular 1H-NMR
 metabolomic approach while exploring the mechanism of delta-tocotrienol (δT) on glutamine
 transporters, and mTOR pathway. Cellular metabolomics analysis showed significant inhibition in
 the uptake of glutamine, its derivatives glutamate and glutathione, and some EAAs in both cell lines
 with δT treatment. Inhibition of glutamine transporters (ASCT2 and LAT1) and mTOR pathway
 proteins (P-mTOR and p-4EBP1) was evident in Western blot analysis in a dose-dependent manner.
 Our findings suggest that δT inhibits glutamine transporters, thus inhibiting glutamine uptake into
 proliferating cells, which results in the inhibition of cell proliferation and induction of apoptosis via
 downregulation of the mTOR pathway.

 Keywords: cancer; mTOR; vitamin E; SLC1A5; tocotrienols; apoptosis; cell growth; cell transporters;
 essential amino acids; ASCT2; glutaminolysis; alanine; glutathione; glutamate; lung;
 bio actives; nutraceuticals

1. Introduction
     Non-small cell lung cancer (NSCLC) presents itself as aggressive tumors arise from the airway
epithelial cells (majority) and interior parts of the lungs [1]. It remains one of the leading causes
of disease-related mortalities in the world. The current therapeutic options for NSCLC, which
include surgery, radiotherapy, and chemotherapy [1], have slightly improved NSCLC survival rate at
some developmental stages in both men and women. However, there has been a plateauing of the
overall five-year survival rate, hovering ~12–18% between the years 1975 and 2011 [2]. Also, several
studies report that there is a high probability of reoccurrence and development of resistance to drug
therapies in NSCLC after treatment with chemotherapeutic agents, surgical resection, and radiation
therapy [3]. This warrants efforts to identify novel therapeutic agents and targets for preventing and
treating NSCLC.

Metabolites 2019, 9, 50; doi:10.3390/metabo9030050                         www.mdpi.com/journal/metabolites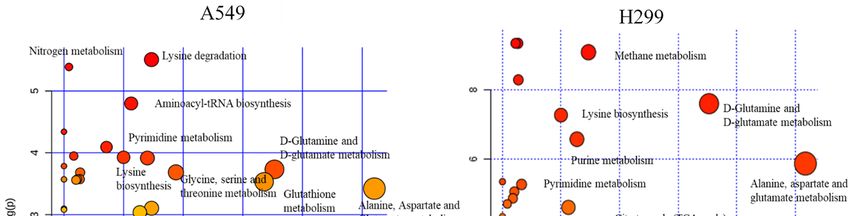
Metabolites 2019, 9, 50                                                                               2 of 21

      Research in nutrition-based modulation against diseases has opened up new horizons in cancer
prevention, contributing to drug discovery and development processes for numerous chronic diseases,
including cancer [4,5]. Most bioactive agents extracted from plants show minimum cell cytotoxicity
while simultaneously targeting multiple signaling pathways involved in cell growth, apoptosis,
invasion, angiogenesis, and metastasis in cancer cells [6,7]. Tocotrienols (α, β, γ, and δ), isomers
of vitamin E, are found in vegetable oils, including rice bran oil and palm oil, wheat germ, barley,
annatto, and certain other types of seeds, nuts, and grains [8]. They exert biological effects including
antiangiogenesis, antioxidant activities, and anticancer activities [9,10]. Our previous studies clearly
demonstrated that delta-tocotrienol (δT) inhibits the proliferation and metastatic/invasion potential
while concurrently inducing apoptosis in NSCLC cells, in a dose-dependent manner [11]. We also
identified some of the probable molecular targets of δT treatments on NSCLC [11–13]. Therefore, δT is
multitargeted and can be considered a valuable potential approach to further investigate for treatment
of NSCLC.
      Metabolomics, a novel, versatile, and comprehensive approach, can provide unbiased information
about metabolite concentrations, altered signaling pathways, and their interactions. Most current
cancer metabolomics studies focus on finding diagnostic biomarkers and understanding fundamental
mechanisms in cancer [14]. Nonetheless, this approach could also be used effectively for identifying
the efficacy of treatments [15]. The NSCLC metabolome is a potentially informative reflection of
the impact of the disease and its dynamics which could lead to promising developments in cancer
research, strongly geared toward the discovery of new biomarkers of disease onset, progression,
and effects of treatment regimens. Given that cancer cells, including NSCLC, show aberrant energy
metabolism [16,17], it is of interest to investigate the changes in energy metabolism in NSCLC cells
upon δT treatment, utilizing the global advantage of the metabolomic approach [18].
      Glutamine plays a role as an indirect energy source in NSCLC, which produces ATP through
glutamine-driven oxidative phosphorylation [19]. Extra consumption of glutamine in tumors is used
for generating metabolic precursors for uncontrolled cell proliferation. These precursors include
elevated levels of nucleic acids, lipids, and proteins for cell proliferation [20], as well as increased GSH
production for cell death resistance [21]. Current literature provides further evidence that glutamine
in cancer facilitates exchange of EAAs (essential amino acids) with glutamine into proliferating cells
via glutamine transporters, which induces mTOR (mammalian target of rapamycin) activation in
NSCLC and other types of cancer [22,23]. Activated mTOR then promotes protein translation and
cell growth via activation of its downstream genes such as S6k1 and 4EBP1 [24]. Alanine, serine,
cysteine-preferring transporter 2 (ASCT2), also known as (SLC1A5), and bidirectional L-type amino
acid transporter 1 (LAT1) are the two primary transporters for glutamine uptake [25,26]. LAT1 enables
transport of the EAAs to improve cancer cell growth via mTOR-induced translations, and ASCT2
sustains the cytoplasmic amino acid pool to drive LAT1 function [27]. This collaboration of ASCT2
and LAT1 reduce apoptosis and enhance the energy production and cell growth via net delivery of
glutamine inside the cell [27].
      A recent study reported that A549 and H1229 lung cancer cells show glutamine dependency,
and that deprivation of glutamine inhibits cell growth [28]. Decreases in glutamine uptake, cell cycle
progression, and mTORC1 pathway after inhibition of ASCT2 functionality by chemicals or shRNA
in vitro was observed in prostate and pancreatic cancer cell lines [29]. Also, inhibition of LAT1 using
BCH (2-aminobicyclo-(2,2,1)-heptane-2-carboxylic acid) in H1395 lung cancer cell line reduced the
cellular leucine uptake and consequently inhibited mTOR pathway activity, which finally reduced cell
proliferation and viability [30]. Induction of apoptosis was also reported in hepatoma, hybridoma,
leukemia, myeloma, and fibroblast cells after glutamine deprivation [31,32]. Our preliminary
metabolomics studies showed that δT treatments inhibited glutamine levels in A549 and H1299
cells. Also, in our previous studies, induction of apoptosis and inhibition of cell growth was observed
in A549 and H1299 cells in a dose-dependent manner after δT treatments [11,33–36]. Therefore, the aim
of this study was to verify the metabolic dysregulation of glutamine and its derivatives upon δT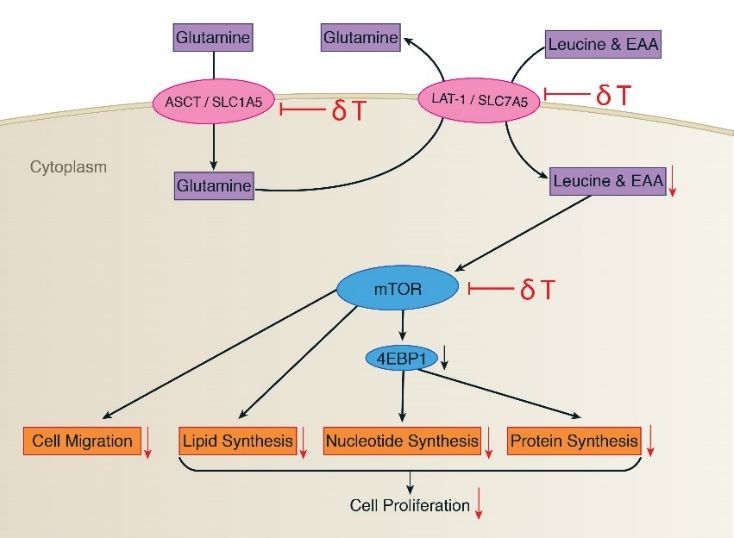
Metabolites 2019, 9, 50                                                                             3 of 21
Metabolites 2018, 8, x                                                                            14 of 21

 treatment while
derivatives uponinvestigating
                 δT treatmentthe effectinvestigating
                               while    of δT on the expression  of δT
                                                     the effect of  glutamine transportersof(ASCT2
                                                                       on the expression           and
                                                                                             glutamine
 LAT1) and  the mTOR  pathway.
transporters (ASCT2 and LAT1) and the mTOR pathway.

2.Results
2. Results

 2.1. δT Changes Metabolite Profiles in A549 and H1299 Cells
2.1. δT Changes Metabolite Profiles in A549 and H1299 Cells
       To investigate the changes in metabolism and metabolites with δT intervention, supervised
      To investigate the changes in metabolism and metabolites with δT intervention, supervised
 OPLS-DA analysis was performed using NMR spectral data acquired from intracellular cell lysate.
OPLS-DA analysis was performed using NMR spectral data acquired from intracellular cell lysate.
 The OPLS-DA score plot of cellular NMR metabolic profile resulting from 30 µM δT treated and control
The OPLS-DA score plot of cellular NMR metabolic profile resulting from 30 µM δT treated and
 cells lines are shown in Figure 1A. The OPLS-DA score plot exhibited clear separation between control
control cells lines are shown in Figure 1A. The OPLS-DA score plot exhibited clear separation
 and treatment groups in A549 cells and H1299 cells with δT treatment; the high Q2 and R2 values
between control and treatment groups in A549 cells and H1299 cells with δT treatment; the high Q2
 indicate a considerable difference in the cellular metabolic profile of treated cells compared to control
and R2 values indicate a considerable difference in the cellular metabolic profile of treated cells
 cells while validating the model that we used for OPLS-DA analysis.
compared to control cells while validating the model that we used for OPLS-DA analysis.
       To identify the metabolites represented in the NMR spectral regions (bins) that varied significantly
      To identify the metabolites represented in the NMR spectral regions (bins) that varied
 between control and treatment groups, the corresponding loading S-Line plot from the OPLS-DA
significantly between control and treatment groups, the corresponding loading S-Line plot from the
 model was generated. Figure 1B shows a representative S-Line plot corresponding to the score plot
OPLS-DA model was generated. Figure 1B shows a representative S-Line plot corresponding to the
 of Figure 1. These bin numbers were further analyzed to identify the significant metabolites (using
score plot of Figure 1. These bin numbers were further analyzed to identify the significant metabolites
 Chenomx) that contributed to the separation of the control and treatment groups seen in the OPLS-DA
(using Chenomx) that contributed to the separation of the control and treatment groups seen in the
 model. Based on the analysis of S-Line plot bin numbers, the key bin numbers responsible for the
OPLS-DA model. Based on the analysis of S-Line plot bin numbers, the key bin numbers responsible
 differences could be attributed to glutamine, glutamate and glutathione, and some amino acids in both
for the differences could be attributed to glutamine, glutamate and glutathione, and some amino
 cell lines.
acids in both cell lines.

                                                   (A)
                                              Figure 1. Cont.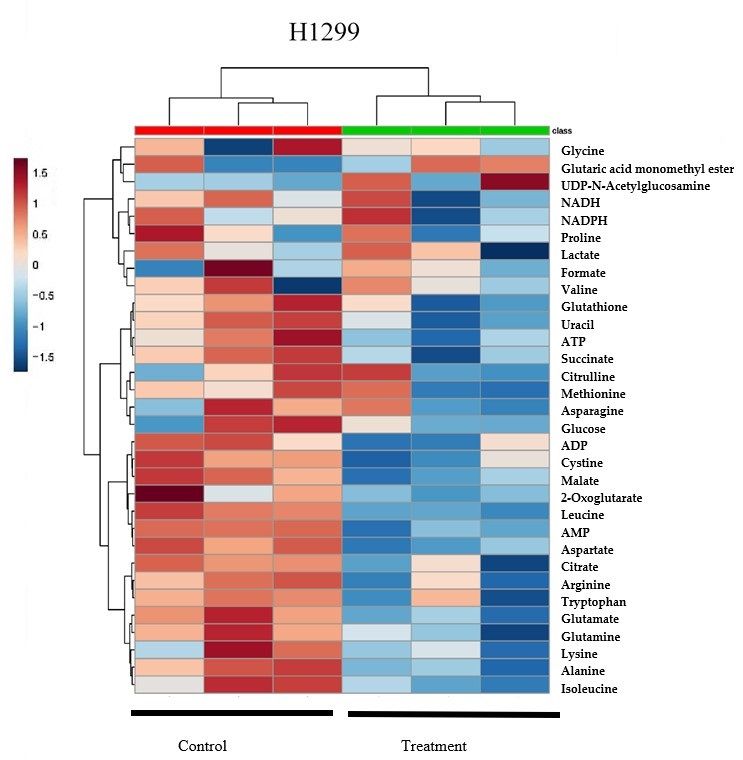
Metabolites 2019, 9, 50 4 of 21
Metabolites 2018, 8, x 15 of 21
(B)
Figure 1. OPLS-DA analysis of metabolome of lung cancer cancer cell
cell lines
lines after
after treating
treating with/without
with/without δTδT for
72 h. (A) OPLS-DA Scores plot based on the cellular metabolic profiling of lung cancer cell lines, namely
A549 (Top)
(Top) and
andH1299
H1299(Bottom);
(Bottom); the 3030
the µMµM treatment
treatment(Yellow) andand
(Yellow) control (green)
control were were
(green) generated using
generated
SIMCA+
using software;
SIMCA+ the results
software; indicated
the results that cellular
indicated metabolic
that cellular profiling
metabolic of lung
profiling cancer
of lung cell lines
cancer was
cell lines
significantly
was changed
significantly afterafter
changed δT treatment for 72
δT treatment h.72
for (B)h.The
(B)S-Line plots plots
The S-Line of OPLS-DA analysis
of OPLS-DA of A549
analysis (top)
of A549
and H1299
(top) (Bottom)
and H1299 from treatment
(Bottom) (30 µM)
from treatment and
(30 µM)control (0 µM) cells.
and control (0 µM) The key The
cells. metabolites that changed
key metabolites that
significantly
changed are marked
significantly on the S-Line
are marked plot and
on the S-Line plotinclude (1) leucine,
and include (2) glutamine,
(1) leucine, (3) glutamate,
(2) glutamine, (3) glutamate,(4)
glutathione,
(4) (5) lactate,
glutathione, (6) taurine,
(5) lactate, and and
(6) taurine, (7) formate.
(7) formate.
2.2. Quantification of
2.2. Quantification of Metabolites
Metabolites Reveals
Reveals That δT Alters
That δT Alters Glutamine
Glutamine Metabolism
Metabolism
Chenomx
Chenomx 7.6 7.6 Suite
Suite NMR
NMR software was used
software was used to to probe
probe thethe metabolome
metabolome profiles
profiles in
in the
the treatment
treatment
and control groups. 1H-NMR spectra provided information on over
and control groups. 1H-NMR spectra provided information on over 45 metabolites (both cell 45 metabolites (both cell
lines),
lines), including
including amino amino
acids, acids, intermediates
intermediates of theof the tricarboxylic
tricarboxylic acid cycle
acid cycle (TCA),
(TCA), energyenergy molecules,
molecules, and
and nucleic acid associated molecules
nucleic acid associated molecules (Table 1). (Table 1).
The
The table
table shows
shows thethe detailed
detailed results
results including
including p-values,
p-values, mean
mean and and standard
standard deviation
deviation from
from thethe
t-test for the groups (with or without 30 µM of δT treatment) tested. Among
t-test for the groups (with or without 30 µM of δT treatment) tested. Among the metabolites that werethe metabolites that
were significantly
significantly different
different in concentration
in concentration in the
in the δT δT treated
treated vs.vs.control
controlcells,
cells,we
we identified
identified several
several
metabolites
metabolites from the glutamine metabolism and related pathways that were significantly decreased
from the glutamine metabolism and related pathways that were significantly decreased
(p
(p < 0.05) in
< 0.05) inthe
thetreatment
treatmentgroup
groupasas compared
compared to to controls.
controls. In addition,
In addition, we found
we found that metabolites
that metabolites such
such as leucine and some essential amino acids had significantly lower
as leucine and some essential amino acids had significantly lower concentrations in both concentrations in cell
bothlinescell
lines
after after δT treatment.
δT treatment. TheseThese essential
essential aminoamino
acidsacids
includeinclude isoleucine,
isoleucine, leucine,
leucine, lysine,
lysine, methionine,
methionine, and
and tryptophan. Moreover, the metabolites related to cell proliferation such as 2-oxoglutarate,
tryptophan. Moreover, the metabolites related to cell proliferation such as 2-oxoglutarate, citrate, citrate,
succinate, malate, aspartame,
succinate, malate, aspartame, ATP,
ATP, ADP,
ADP,NADPH,
NADPH,and anduracil
uracil significantly
significantly decreased
decreased (p (p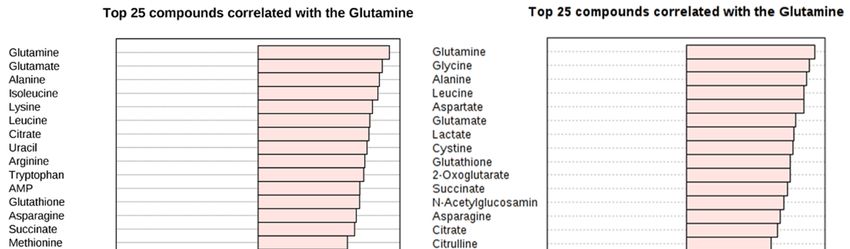
Metabolites 2019, 9, 50                                                                                   5 of 21

      Table 1. List of metabolite concentrations determined using NMR in A549 (A) H1299 (B) cells. p-values
      less than 0.05 were considered statistically significant for univariate analysis. Treatment column
      indicates the samples with the 30 µM treatment of δT. All the concentrations are reported in µM.
      (A)

                                           Mean ± SD        Mean ± SD                    Fold Changes
                 Metabolite Name                                             p-Value
                                            (Control)       (Treatment)                   Control/Trt
         Amino Acids
                      Aspartate            102.3 ± 11.9       55.9 ± 4.7      0.0016          1.8
                      Glutamate             80.8 ± 7.9        48.7 ± 4.7      0.0019          1.7
                          Leucine           33.7 ± 4.1        17 ± 3.7        0.0030          2.0
                          Glycine           33.1 ± 1.2        20.4 ± 4.2      0.0035          1.6
                          Alanine               31 ± 1.4      19.8 ± 3.9      0.0045          1.6
                      Glutamine             99.9 ± 6.7       64.7 ± 13.3      0.0073          1.5
                      Histidine                 54 ± 8.4     85.9 ± 31.3      0.0815          0.6
                     Asparagine            116.9 ± 16.2      54.5 ± 13.1      0.0033          2.1
                          Taurine           90.3 ± 19.9      78.2 ± 26.8      0.2822          1.2
                           Valine           23.8 ± 1.4        21.6 ± 6.3      0.2878          1.1
                     Tryptophan                 81.3 ± 15    72.7 ± 28.7      0.3340          1.1
                          Proline           51.9 ± 49.3      63.7 ± 25.7      0.3659          0.8
                           Lysine           41.6 ± 22.8       37.2 ± 6.1      0.4075          1.1
                      Isoleucine            31.5 ± 9.9        30.6 ± 7        0.4499          1.0
                     Methionine                 5.8 ± 5.3     5.5 ± 3.4       0.4653          1.1
                          Arginine                 nd            nd
         Intermediate of TCA Cycle and Energy Metabolism
                          Lactate           138.5 ± 5.6       99.9 ± 3.6      0.0003          1.4
                   2-Oxoglutarate           43.6 ± 3.3        29.3 ± 4.7      0.0061          1.5
                           AMP                  32.1 ± 5      45 ± 1.7        0.0063          0.7
          Glutaric acid monomethyl ester    17.8 ± 6.4        34 ± 2.8        0.0077          0.5
                          Malate            90.2 ± 10.7      48.7 ± 10.3      0.0111          1.9
                      Succinate                 9.3 ± 2.6     5.2 ± 2.8       0.0645          1.8
                          Glucose          119.1 ± 53.4      187.3 ± 63.7     0.1139          0.6
                           ADP              47.8 ± 8.3        40.8 ± 4.8      0.1370          1.2
                          Citrate           42.4 ± 3.8       35.6 ± 11.6      0.1959          1.2
                          NADH              38.4 ± 3.5        43.4 ± 16       0.3040          0.9
                          NADPH                 47 ± 6.3     51.3 ± 12.5      0.3118          0.9
                            ATP             42.2 ± 5.4       42.9 ± 11.3      0.4653          1.0
         Nucleic acid Associataed Metabolites
                           Uracil               98 ± 14.1     60.1 ± 24       0.0387          1.6
            UDP-N-Acetylglucosamine             6.9 ± 2.1     3.9 ± 3.4       0.1266          1.8
         Other
                     Glutathione            69.6 ± 2.1        41.7 ± 6.7      0.0011          1.7
                      Citrulline            81.9 ± 5.1        63.9 ± 13       0.0438          1.3
                          Cystine           81.4 ± 6.3        58.4 ± 19       0.0582          1.4
               N-Acetylglucosamine          21.9 ± 9.3        12.8 ± 5.2      0.1065          1.7
                          Formate          294.3 ± 68.5      312.8 ± 8.9      0.3334          0.9
                      Fumarate                  25 ± 3.2      27.7 ± 5        0.2363          0.9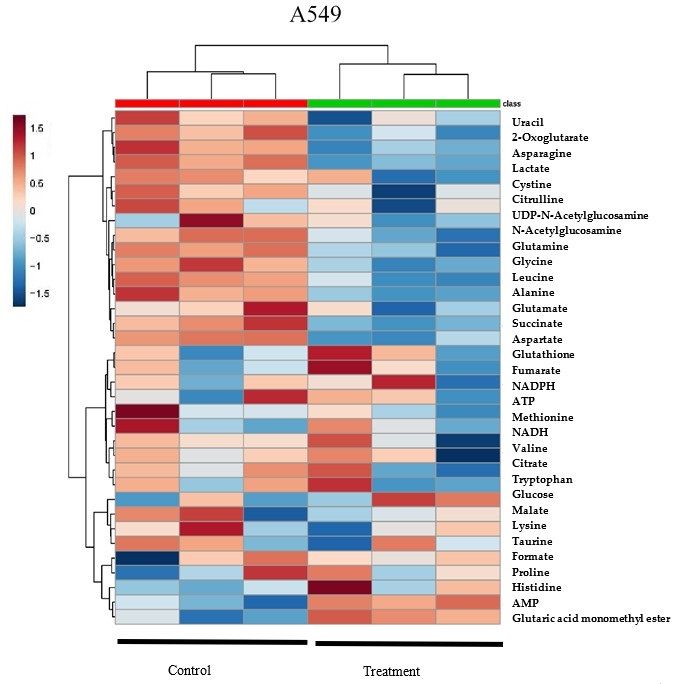
Metabolites 2019, 9, 50                                                                                 6 of 21

                                                     Table 1. Cont.
      (B)

                                           Mean ± SD            Mean ± SD                Fold Changes
                 Metabolite Name                                               p-Value
                                            (Control)           (Treatment)               Control/Trt
         Amino Acids
                      Aspartate                105.5 ± 3.5       77.4 ± 4.3    0.0010        1.4
                      Glutamate                 80.1 ± 5.7       49.3 ± 6.2    0.0033        1.6
                          Leucine               31.8 ± 1.3       18.3 ± 0.8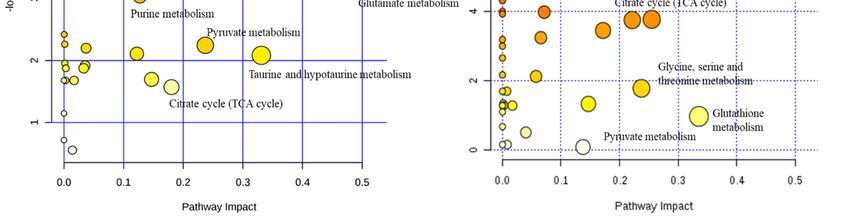
Metabolites 2019, 9, 50 7 of 21
Metabolites 2018, 8, x 16 of 21
Heatmap analysis from MetaboAnalyst 3.0 revealed that A549 and H1299 cell lysates had similar
changing trends of
the supplement in metabolites of δT cell
δT impacts both treated
linesgroups versusmanner.
in a similar control (Figure
At the 2A),
samewhich
time, suggests
our heatmapthat
the supplement
results of δTthat
also revealed impacts both
control andcell lines in agroups
treatment similarsupplemented
manner. At the withsame time, clustered
δT were our heatmap into
results also revealed that control and treatment groups supplemented with δT were
two major groups (Green and Red groups at the top of the Heatmap) which suggest clear separation clustered into two
major
in twogroups
groups(Green
with andtheirRed groups atand
metabolites the top
alsoofvalidates
the Heatmap) which suggest
the separation clear separation
in OPLS-DA analysis.in two
The
groups with their metabolites and also validates the separation in OPLS-DA analysis.
random forest importance plot identified 15 metabolites key in classifying the data with aspartame, The random
forest importance
alanine, plot identified
leucine, glutamate 15 metabolites
glutathione, key in classifying
and glutamine having thethe datainfluence
most with aspartame, alanine,
on classification
leucine, glutamate glutathione, and glutamine having the most influence on classification (Figure 2B).
(Figure 2B).
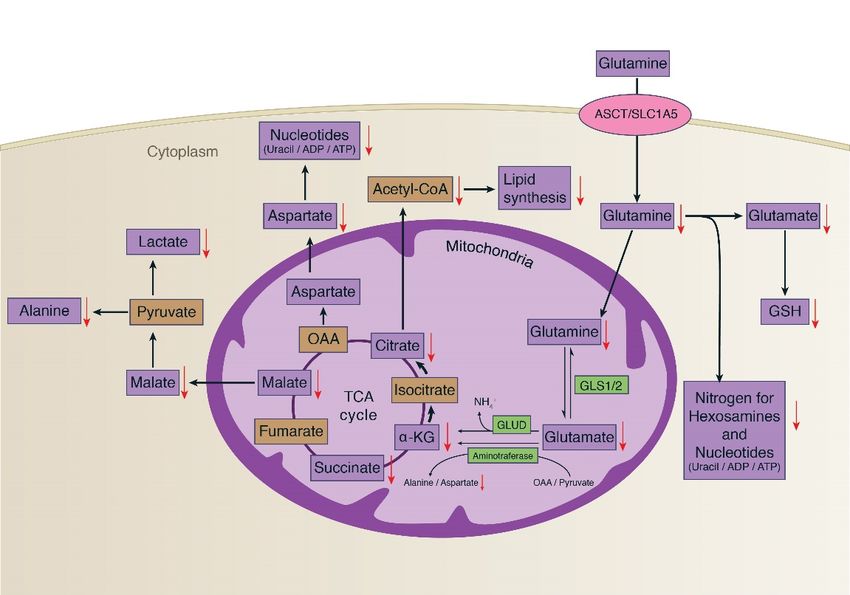
To
To further comprehend
further comprehend the the biological
biological relevance
relevance of of the
the identified
identified metabolites
metabolites from
from Chenomx
Chenomx
analysis, we performed pathway analysis using MetaboAnalyst 3.0 software
analysis, we performed pathway analysis using MetaboAnalyst 3.0 software [25]. Some of [25]. Some of the
the key
key
altered
altered pathways
pathways identified
identified from
from pathway
pathway analysis
analysis include
include lysine
lysine biosynthesis,
biosynthesis, purine
purine metabolism,
metabolism,
alanine,
alanine, aspartate
aspartateandandglutamate
glutamate metabolism,
metabolism, glutamine andand
glutamine glutamate metabolism,
glutamate citratecitrate
metabolism, cycle (TCA
cycle
cycle), and pyruvate metabolism for both cell lines (Figure
(TCA cycle), and pyruvate metabolism for both cell lines (Figure 3A). 3A).
Figure 2. Cont.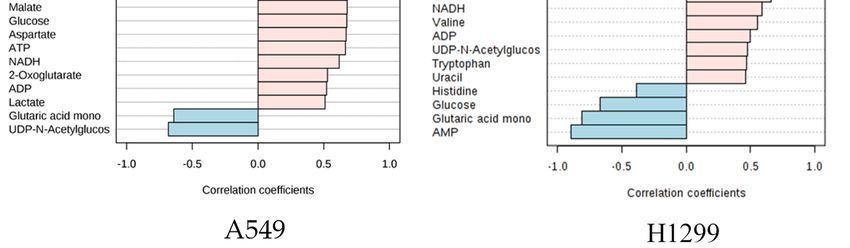
Metabolites 2018, 9,
Metabolites 2019, 8, 50
                     x                      178 of
                                                of 21
                                                   21

                               (A)

                          Figure 2. Cont.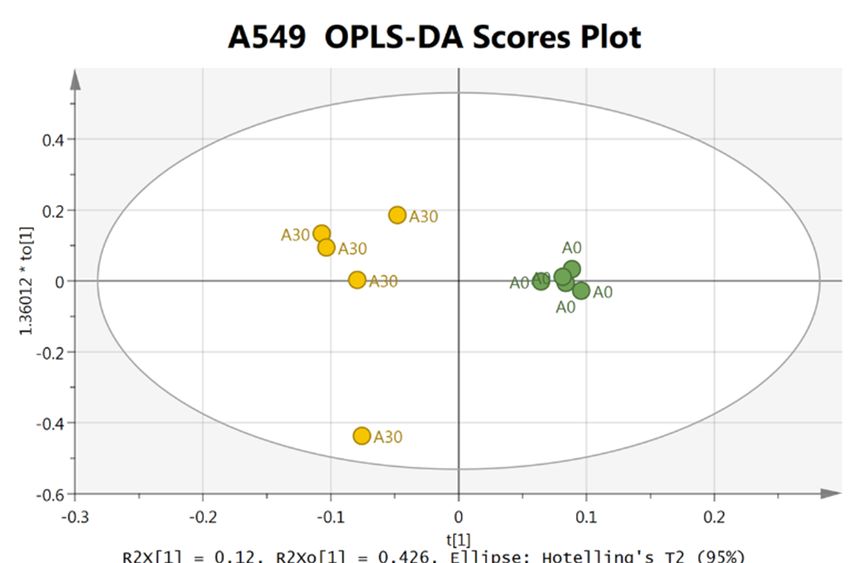
Metabolites 2019, 9, 50                                                                                                   9 of 21
 Metabolites 2018, 8, x                                                                                               18 of 21

                                                              (B)
       Figure2.2.Hierarchical
      Figure       Hierarchical clustering
                                  clustering analysis
                                              analysis of
                                                        of δT-altered
                                                            δT-altered metabolites
                                                                         metabolites(Heatmap)
                                                                                       (Heatmap)and andcontribution
                                                                                                          contributionofof
      metabolites in A549 and H1299. The metabolites, quantified with Chenomx software analysisofof
       metabolites   in A549  and  H1299.   The  metabolites,  quantified   with Chenomx    software  analysis     NMR
                                                                                                                     NMR
       spectra  of A549   and  H1299   cells after incubating   with  or without   δT for 72 h, were  used
      spectra of A549 and H1299 cells after incubating with or without δT for 72 h, were used to generate    to generate
       theheat
      the   heatmap
                 map(A) (A)using
                            usingMetaboanalyst
                                    Metaboanalyst software.
                                                      software. Each
                                                                 Eachcolumn
                                                                         columnrepresents
                                                                                  representsa asample,
                                                                                                 sample,andandeach
                                                                                                                 eachrow
                                                                                                                       row
       representsthe
      represents    theexpression
                         expression profile
                                     profile of
                                              of metabolites.
                                                 metabolites. Blue
                                                                Bluecolor
                                                                       colorrepresents
                                                                             representsaadecrease,
                                                                                            decrease,andandred
                                                                                                             redcolor
                                                                                                                  coloranan
       increase.The
      increase.  Thevery
                       verytop
                            top row
                                 row with
                                      with green
                                            green color
                                                   color indicates
                                                          indicates the
                                                                     thecontrol
                                                                          controlsamples
                                                                                  samplesand
                                                                                           andredredcolor
                                                                                                     colorrow
                                                                                                            rowindicates
                                                                                                                 indicates
       the samples    with the 30  µM   treatment   of δT. Random     Forest (B) showed   in bottom
      the samples with the 30 µM treatment of δT. Random Forest (B) showed in bottom graphs identifiesgraphs   identifies
       thesignificant
      the  significantfeatures.
                        features.The
                                   The features
                                       features are
                                                 are ranked
                                                     ranked byby the
                                                                  the mean
                                                                      meandecrease
                                                                             decreaseininclassification
                                                                                          classificationaccuracy
                                                                                                          accuracywhen
                                                                                                                     when
       they  are permuted.
      they are permuted.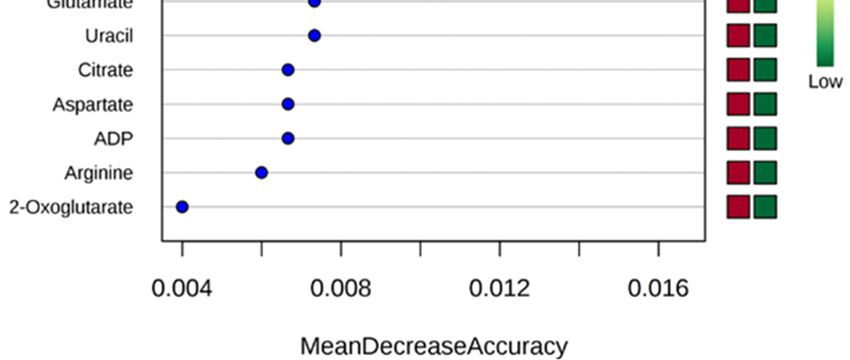
Metabolites 2019, 9, 50 10 of 21
Metabolites 2018, 8, x 19 of 21
(A)
(B)
Figure 3. The
Figure 3. Themost
mostpredominant
predominant altered
alteredmetabolic
metabolic pathways
pathways (A)(A)
and toptop
and 25 25
metabolites
metabolitescorrelated
correlated
with glutamine
with glutamine (B).(B).
Summary
Summary of of
thethe
altered metabolism
altered metabolism pathways
pathways (A)(A)
after treating
after with/without
treating with/without δT δT
forfor
72 72
h, as
h, analyzed
as analyzed using MetaboAnalyst
using MetaboAnalyst 3.0.3.0.
TheThesizesize
andand
color of each
color circle
of each was
circle based
was on on
based pathway
pathway
impact value
impact and
value andp-value, respectively.
p-value, respectively. Circles, larger
Circles, and
larger higher
and along
higher thethe
along Y axis, show
Y axis, showhigher
higherimpact
impact
of pathway
of pathway on on
thethe
organism.
organism. TheThe
toptop
25 metabolites,
25 metabolites, correlating with
correlating glutamine
with glutamine level (B)(B)
level after treating
after treating
with/without
with/without δT δT
for for
72 h.
72 X-axis shows
h. X-axis showsmaximum
maximum correlation; pink
correlation; color
pink shows
color showspositive correlation
positive correlation
whereas
whereasblue shows
blue shows negative
negativecorrelation.
correlation.
AsAsrandom
random forest importance
importanceplot andand
plot pathway analysis
pathway indicateindicate
analysis that glutamine-based metabolites
that glutamine-based
play a significant
metabolites contribution
play a significant to glutamine
contribution metabolism
to glutamine and related
metabolism and pathways, correlation
related pathways, between
correlation
other metabolites
between were assessed
other metabolites using Pearson
were assessed correlation
using Pearson analysis
correlation to validate
analysis the relationship
to validate between
the relationship
glutamine and metabolites in other pathways. Interestingly, nearly 20 metabolites
between glutamine and metabolites in other pathways. Interestingly, nearly 20 metabolites showed showed more than
(>0.7)
more correlation
than with glutamine
(>0.7) correlation and metabolites
with glutamine belonging
and metabolites to the key
belonging to impaired pathways
the key impaired identified
pathways
from pathway
identified analysisanalysis
from pathway using MetaboAnalyst 3.0 software.
using MetaboAnalyst The metabolites
3.0 software. in glutamine
The metabolites and glutamate
in glutamine and
metabolism include glutathione, glutamate, 2-oxoglutarate which show a 0.9, 0.7,
glutamate metabolism include glutathione, glutamate, 2-oxoglutarate which show a 0.9, 0.7, and 0.6 and 0.6 correlation
in A549 and
correlation 0.8, 0.8,
in A549 andand0.8, 0.8
0.8,correlation in H1299in(Figure
and 0.8 correlation H1299 3B).
(Figure 3B).
2.3. δT Inhibits Glutamine Transporters (LAT-1 and ASCT2) and the mTOR Pathway in A549 and H1299
CellsMetabolites 2019, 9, 50 11 of 21
2.3. δT Inhibits
Metabolites 2018, 8,Glutamine
x Transporters (LAT-1 and ASCT2) and the mTOR Pathway in A549 and 20 of 21
H1299 Cells
Metabolomic analysis
Metabolomic and subsequent
analysis and subsequentquantification of metabolites
quantification usingusing
of metabolites ChenomxChenomxNMRNMRsuitesuite
(Edmonton, AB, Canada) revealed the potent effect of δT on glutamine metabolism,
(Edmonton, AB, Canada) revealed the potent effect of δT on glutamine metabolism, downstream downstream
metabolites
metabolites of
of glutamine
glutamineand andessential
essentialamino
amino acids
acids(Figures
(Figures1 and 2, Table
1 and 1). Current
2, Table literature
1). Current literature
provides evidence that glutamine uptake and some essential amino acids, including are
provides evidence that glutamine uptake and some essential amino acids, including leucine, leucine,
associated withwith
are associated the the
activation of the
activation mTOR
of the mTOR pathway
pathway[37].[37].
Thus,Thus,
Western blot blot
Western analysis was was
analysis
performed to
performed to investigate
investigate thethe effect
effect of
ofδT
δTononthe
themTOR
mTORpathway
pathwayand andglutamine
glutaminetransporters.
transporters.Upon
Upon
intervention with δT (30 µM), the glutamine transporters (LAT-1 and ASCT2) andand
intervention with δT (30 µM), the glutamine transporters (LAT-1 and ASCT2) keykeymTOR
pathway proteins (P-mTOR and p-4EBP-1) were found to be inhibited, relative to thetountreated
mTOR pathway proteins (P-mTOR and p-4EBP-1) were found to be inhibited, relative the
untreated controls
controls (Figure 4). (Figure 4).
(A)
Figure 4. Cont.Metabolites 2018, 9,
Metabolites 2019, 8, 50
x 12 of
21 of 21
21
(B)
Figure 4. δT inhibits glutamine transporters
transporters (LAT-1
(LAT-1 and ASCT2) and the mTOR pathway in A549 and
H1299 cells. (A) The expressions
expressions of LAT-1,
LAT-1, ASCT2,
ASCT2, p-mTOR,
p-mTOR, mTOR,
mTOR, p-4EBP-1,
p-4EBP-1, 4EBP1,
4EBP1, and
and β-actin
β-actin
proteins were
proteins were detected by Western
Western blot
blot analysis
analysis in
in A549
A549 and
and H1299
H1299 after
after treating with 0 µM and 30 µM
concentrations of δT for 72 h. (B) The fate of glutamine uptake in A549 and H1299 involving metabolites
associated key proteins
(purple), associated proteins (pink),
(pink), and
and functions
functions (orange).
(orange). Glutamine
Glutamine in cancer
cancer facilitates
facilitates
proliferating cells via glutamine
exchanging of EAAs (essential amino acids) into proliferating glutamine transporters (LAT1
ASCT2), which induces
and ASCT2), induces mTOR
mTOR activation
activation in A549
A549 and
and H1299.
H1299. Activated
Activated mTOR
mTOR then
then promotes
promotes
translation and cell growth via activation
protein translation activation of its
its downstream
downstream genes
genes 4EBP1.
4EBP1. The
The black
black arrows
arrows
indicate pathway direction,
direction, while
whilethe
thered
reddownward
downwardarrows
arrowsindicate
indicateinhibition.
inhibition.
3.
3. Discussion
Discussion
In
In this
this study,
study, wewe used
used multivariate
multivariate analysis
analysis ofof NMR
NMR spectra
spectra and
and NMR
NMR quantification
quantification data
data to
to
observe differences in the intracellular metabolomes. We discovered clear differences
observe differences in the intracellular metabolomes. We discovered clear differences in the in the intracellular
metabolomes, and subsequently
intracellular metabolomes, the contributing
and subsequently metabolites,metabolites,
the contributing of the control of and δT treated
the control andcells using
δT treated
OPLS-DA
cells using and Heat map
OPLS-DA analysis
and Heat map(Figures
analysis 1(Figures
and 2A). Also,
1 and weAlso,
2A). observed a minora difference
we observed in the
minor difference
results obtained through multivariate analysis of NMR spectra and NMR quantification
in the results obtained through multivariate analysis of NMR spectra and NMR quantification variation variation in
this analysis
in this which
analysis whichis common
is common in metabolomic
in metabolomic data sets.
data This
sets. type
This of variation
type of variation is well documented
is well documented in
several publications in the current literature [6]. Most variations arise from the metabolites
in several publications in the current literature [6]. Most variations arise from the metabolites present present
in
in very
very low
low concentrations.
concentrations. In In addition,
addition, metabolites whose resonances
metabolites whose resonances yield
yield aa very
very high
high number
number of of
overlapping peaks also suffer from variations in quantitation [6]. The two different
overlapping peaks also suffer from variations in quantitation [6]. The two different methods were methods were
therefore used in
therefore used in conjunction
conjunction to to verify
verifythe
thedata.
data.
Previously, using histone
Previously, using histone ELISA
ELISAand andANNEXIN
ANNEXINV V stain-based
stain-based flowflow cytometry
cytometry analysis,
analysis, we
we reported that the 10 to 30 µM range of δT was not necrotic to A549 and H1299
reported that the 10 to 30 µM range of δT was not necrotic to A549 and H1299 cells, and that it induced cells, and that
it induced in
apoptosis apoptosis in a dose-dependent
a dose-dependent mannerAlso,
manner [11,12]. [11,12]. Also,
using using
MTS andMTS and clonogenic
clonogenic assays assays
in the
in
previous studies, we demonstrated that 30 µM of δT inhibited cell growth significantly in thein
the previous studies, we demonstrated that 30 µM of δT inhibited cell growth significantly the
A549
A549
and H1299 cells lines [12]. Other metabolomics investigations have also reported changes in
and H1299 cells lines [12]. Other metabolomics investigations have also reported changes in
metabolism
metabolism afterafterinducing
inducingapoptosis
apoptosisinindifferent cancer
different types,
cancer namely
types, leukemia
namely leukemiacell lines [38]. [38].
cell lines Our data
Our
data suggests that metabolite changes in the control vs. δT treated lung cancer cell populations are a
result of induction of apoptosis after δT treatment.Metabolites 2019, 9, 50 13 of 21
suggests that metabolite changes in the control vs. δT treated lung cancer cell populations are a result
of induction of apoptosis after δT treatment.
The role of natural dietary components in cancer growth and progression has become a very
popular subject with minimum effect or no effect on normal cells. Several cell culture studies showed
that δT was not causing apparent impairment towards the noncancerous cell lines, although it
significantly effects different cancer cell types, including lung cancer. For instance, Human Fetal
Lung Fibroblast Cells treated with 100 µm or higher of δT did not show any toxic effect including
induction of apoptosis and DNA damage [18]. In another study, 10 µM DT3, a lower dose than our
treatment, was determined to be nontoxic, and enhanced cell viability and proliferative potential in
the human lung fibroblast cell lines MRC-5 and HFL1, as shown by WST-1 and clonogenic assays [39].
In addition, Immortal human pancreatic duct epithelial cell lines did not show any significant inhibitory
effect on cell proliferation and cell cycle progression when they were incubated with δT [40]. Similarly,
normal human melanocytes treated with δT (5–20 µg/mL) for 24 h or 48 h did not affect cell growth at
both time intervals [41]. Preclinical and clinical evidence also supports the use of δT to reduce tumor
growth with no effects on healthy humans or animals, making δT attractive compounds. No adverse
effects were observed upon administration of 300 mg/kg dose of δT, in any tissues or organs of
mice [42]. In humans, δT can be safely administered at doses up to 1600 mg twice daily [43]. In another
study with osteopenic women, supplementation for 12 weeks did not affect body composition, physical
activity, quality of life, or intake of macro- and micronutrients [44]. All of the aforementioned studies
used δT concentrations above 30 µM that we used for this study, and it is obvious that δT does not
affect healthy cells including human fetal lung fibroblast cells. Therefore, a control arm of normal lung
cells with expressed or unexpressed LAT1 and/or ASCT2 were not included in our study design.
Further, LAT1 or ASCT2 transporters with cancer is nowadays well-assessed [9]. Overexpression
of LAT1 is well described in many human cancers and it certainly relates to metabolic changes occurring
in cancer development and progression [45]. LAT-1 is expressed in cancers of most human tissues
according to GENT database [46], which suggests an important role of LAT-1 expression on cancer
development. In contrast, it is poorly expressed or, in some cases, absent in most of the corresponding
noncancer human tissues [46]. In the immunohistochemistry analysis of the normal lung, LAT1 protein
was identified only on granular regions in the cytoplasm of chondrocytes of the bronchial cartilage,
serous cells of the bronchial glands, and alveolar macrophages within the normal lung, whereas
the expression was zero for nonciliated bronchiolar epithelial cells (Clara cells), goblet cells of the
bronchus, mucinous cells of the bronchial glands, and alveolar type I or type II cells [47]. In the same
study, expression of LAT1 protein appeared in the cytoplasm of bronchial surface epithelial cells as
a single nodular spot, which was considered to represent an intracellularly localized nonfunctional
protein [47]. ASCT2 transporters also are poorly expressed or, in some cases, absent in most of the
corresponding noncancer human tissues according to GENT database [46]. Hassanein et al. identified
ASCT2 transporters expressed in stage I NSCLC when compared to matched controls using shotgun
proteomic analysis [48]. In addition, ASCT2 deficient mice showed regular functions such as normal
B-cell development, proliferation, and antibody production [49]. Therefore, control arms of normal
lung cells that are expressed or unexpressed (LAT1 and ASCT2) was also not included in our study
design as there was a minimum expression and/or functionality observed for LAT1 and ASCT2 in
other tissues and noncancerous tissues.
A significant reduction of glutamine, glutamate, GSH and 2-oxoglutarate after treating with 30 µM
of δT on NSCLC cell lines was observed (Table 1). The key aberrant pathways identified using the
pathway analysis tool include glutamate and glutamine, alanine, aspartate, glutathione metabolism,
and the TCA cycle (Figure 3). In addition, the metabolites identified from these pathways show a
strong correlation with glutamine levels (Figure 3B). Further, glutamine and its related metabolites
were identified in the S-plot of OPLS-DA analysis and the Random Forest importance plot as the key
players causing the separation, reflecting the differences in their metabolomic profiles (Figures 1 and
2B). Glutamine deprivation has been shown to induce apoptosis in hepatoma, hybridoma, leukemia,Metabolites 2019, 9, 50 14 of 21
myeloma, and fibroblast cells [50]. In contrast, increased levels of glutamine were detected in lung
cancer tissue especially in NSCLC when compared to other types of cancer, such as colon or stomach
cancer [47]. Glutamine dependency has been reported in H1299 and A549 cells [28]. Our findings
strongly suggest the beneficial impact of δT on glutamine and related pathways in non-small cell lung
cancer cells.
Considering metabolism of glutamine (Figure 5), one of its major roles in cancer cell proliferation
is to replenish the TCA cycle intermediates removed by the process called glutaminolysis,
and GSH synthesis [30,31]. In the process of glutaminolysis, the glutaminase enzyme (GLS1/2)
catalyzes the conversion of glutamine to glutamic acid and the subsequent conversion of
glutamate to α-ketoglutarate (2-oxoglutarate), catalyzed by glutamate dehydrogenase (GLUD) [32].
Aminotransferase also catalyzes the reaction from glutamate and oxaloacetate to aspartate or alanine
and α-ketoglutarate. In this study, a significant reduction of glutamine, glutamate, and TCA cycle
intermediates after treating with 30 µM of δT was observed, which is an indicator of reduced energy
metabolism (Figure 5). In cancer cells, the enhanced production of 2-oxoglutarate and glutamate from
glutamine metabolism can be observed, as it helps to maintain the citric acid cycle intermediate for
energy production [32]. Glucose and glutamine provide substrates for macromolecular synthesis
supplying both ATP and carbon skeletons in cancer cells [29]. This supports uncontrolled cell
proliferation in cancer cells and requires a large number of macromolecules to create new biomass,
including DNA, proteins, and lipids [28]. Our data suggests that by decreasing the availability of
Metabolites 2018, 8, x 29 of 21
glutamine, δT retards this process, thereby leading to inhibition of uncontrolled cell proliferation in
A549 and H1299 as reported in our previous studies [11,12,35].
Figure
Figure5.5.Glutamine
Glutaminemetabolism
metabolismand and the
the effect of δT
effect of δT on
onglutamine
glutaminemetabolism
metabolismininA549A549andand H1299
H1299
cells.
cells. Glutamine mainly replenishes the TCA cycle intermediates and GSH synthesis in cancer cellcell
Glutamine mainly replenishes the TCA cycle intermediates and GSH synthesis in cancer
proliferation.
proliferation.InIn
the
theprocess,
process,glutaminase
glutaminaseenzymes
enzymes(GLS1/2)
(GLS1/2)catalyzes
catalyzesthetheconversion
conversion of
of glutamine
glutamine to
glutamic acidacid
to glutamic andand
thethe
subsequent
subsequent conversion
conversionofofglutamate
glutamate to α-ketoglutarate
α-ketoglutarate(α-kG),
(α-kG),catalyzed
catalyzedby by
glutamate dehydrogenase (GLUD) and
glutamate dehydrogenase (GLUD) and amino transferase. This process supports for uncontrolled cell
transferase. This process supports for uncontrolled cell
proliferationinincancer
proliferation cancercells
cellsand
andrequires
requires aa large number
number of ofmacromolecules
macromoleculestotocreatecreatenew
new biomass,
biomass,
includingDNA,
including DNA,proteins,
proteins,and
andlipids.
lipids. The
The black
black arrows
arrows indicate
indicatethe
thepathway’s
pathway’sdirection, while
direction, thethe
while redred
downward arrows indicate the inhibition of metabolites as an effect of δT
downward arrows indicate the inhibition of metabolites as an effect of δT treatment. treatment.
Supplementary Materials: The following are available online at www.mdpi.com/xxx/s1. Table S1: List of
metabolite concentrations determined using Chenomx NMR Suite in A549 cells. Table S2: List of metabolite
concentrations determined using Chenomx NMR Suite in H1299 cells. Figure S1: Effects of δT on A549 (A) and
H1299 (B) on the metabolome of lung cancer cell lines.Metabolites 2019, 9, 50 15 of 21
Considering possible causes for the significant decrease in glutamine and its downstream
metabolites, we hypothesized that it may be due to inhibition of glutamine transporters. We thus
measured the protein levels of glutamine transporters, namely LAT1 and ASCT2, known to play a
fundamental role in glutamine uptake process in normal cell physiology. LAT-1 facilitates glutamine
efflux in exchange for the influx of leucine and other essential amino acids (EAA) across the cell
membrane; similarly, ASCT2 mediates uptake of neutral amino acids including glutamine [51].
Our observations from western blot analysis established that δT treatments inhibit the expression of
LAT-1 and ASCT2 (Figure 4). We also quantified detectable EAA including leucine in cell lysates,
the concentration of which were decreased significantly after treating NSCLC cells with δT by NMR
analysis. Inhibition of EAA in A549 and H1299 cells upon δT treatment reflects function of LAT-1
which facilitate glutamine efflux in exchange for the influx of leucine and other essential amino acids
(EAA). This supports the beneficial effects of δT on LAT1 transporters inside A549 and H1299 cells.
In addition to facilitating the transport of EAAs for protein synthesis, LAT1 and ASCT2 stimulate
the growth of cancer cells via mTOR [27,52,53]. In head and neck squamous cell carcinoma cell lines,
inhibition of the LAT-1 transporter using an inhibitor lowered the levels of phosphorylation of mTOR
and its downstream signaling molecules [54]. Thus, if the inhibition of glutamine transporters and
EAA uptake with δT treatment is valid, it is logical to expect inhibition or lower activation of mTOR
pathway after treating with δT in NSCLC. Indeed, we observed lower activation of mTOR along with
LAT-1 and ASCT2 after treating with δT, using Western blot analysis, which illustrates that inhibition
of glutamine transporters affect the mTOR signaling pathway (Figure 4).
mTOR functions are mediated by two downstream proteins, the eukaryotic initiation factor 4E
(eIF4E)-binding protein 1 (4E-BP1) and p70 ribosomal S6 kinase 1 (p70S6K1, S6K1) (Figure 4) [55].
For further confirmation, we tested the expression levels of downstream genes of mTOR namely
P-4E-BP1. We observed the similar inhibitory effect on mTOR downstream proteins 4E-BP1suggesting
an inhibitory effect of glutamine transporters passing through mTOR to downstream pathway
(Figure 4). mTOR downstream proteins 4E-BP1 and S6K1 regulate F-actin reorganization,
focal adhesion formation, and tissue remodeling through the proteolytic digestion of extracellular
matrix via upregulation of matrix metalloproteinase 9 (MMP-9) [56]. Interestingly, in our previous
study, we observed that δT reduced cell migration, invasion and adhesion in a dose- and
time-dependent manner, and inhibited MMP-9 expressions in NSCLC cells [13,34], which is an
additional supporting inhibitory function of δT.
Further, in the previous study, we demonstrated that δT induces apoptosis in a dose-dependent
manner in NSCLC from Annexin based flow cytometry analysis and histone ELISA [12]. The current
literature also provides evidence to support the relationship between GSH and apoptosis. For instance,
GSH depletion in cancer cells induces apoptosis in vitro and in vivo [57]. Dalton TP et al. showed
GSH-depleted knockout mouse of γ-GCS died from massive apoptotic cell death [58]. Elevated levels
of GSH are also associated with apoptotic resistant phenotypes in several models of apoptosis in
previously reported studies [59,60], and GSH depletion by itself has been observed to either induce or
stimulate apoptosis [59,61]. GSH quantification, after treating with δT in A549 and H1299 cells, shows
a clear decline in intercellular GSH levels in both cell lines (Table 1). The results reveal there may also
be a possible association between GSH levels and induction of apoptosis in NSCLC cells after treating
with δT.
4. Materials and Methods
4.1. Cell Culture and Treatment with δ-T
NSCLC cell lines A549 and H1299 were cultured in RPMI medium (Mediatech, Manassas, VA,
USA) supplemented with 10% fetal bovine serum and 1% penicillin and streptomycin in 5% CO2 at
37 ◦ C. The culture medium was renewed every 2 to 3 days. Adherent cells were detached by incubation
with trypsin-EDTA and centrifuged at 80× g. The treatment media was prepared by mixing δT (Metabolites 2019, 9, 50 16 of 21 DMSO as a vector) in the RPMI medium, whereas the control was treated only with RPMI media. Three δT solutions at concentrations of 10 µM, 20 µM, and 30 µM containing
Metabolites 2019, 9, 50                                                                             17 of 21

4.6. Multivariate Data Analysis: OPLS-DA
     The processed, digitized NMR spectral data table from ACD software (version 10) was imported
into the SIMCA (version 15) software (Sartorius Stadium Biotech, Germany for Multivariate data
analysis (MVDA). The data table was transposed and labeled accordingly. The integrals corresponding
to the spectral region from 4.5 to 6 ppm were excluded as this region contains water peaks and
exchangeable protons. Spectral regions displaying no peaks, DMSO, and spectral regions of methanol
to all the samples were also excluded from the dataset. PCA, OPLS-DA models were created by
generating optimum number of principal components needed to fit the data, using the autofit option
in the software. Each model’s characteristics are described by how well it fits the data and its ability to
predict new data accurately. Thus the value for R2 describes how well the data fits the model while the
value of Q2 relates to the models ability to predict unknown data correctly. These are calculated by the
for the purpose of evaluating and validating the models generated. The following cutoff criteria are
used for validating the models that were generated. For NMR metabolomic data, it is recommended
that the model generated has a Q2 > 0.5, a value of R2 higher than Q2 with the difference between
them being no greater than 0.3. These criteria were adhered to for all the models utilized for the
investigation. Samples were identified and distinguished by their respective labels and colored for
visual convenience. The data was subjected to Pareto-scaling prior to analysis. The Hotelling T2 test
(based on the 95% confidence interval) and DMOD-X test (based on the distance from the model plane)
was used to remove any statistically extreme outliers while maintaining a minimum of 4 replicates
in each group. Initially, unsupervised Principal Component Analysis (PCA) was performed to view
the clustering effects in the samples (Supplemental Materials). Subsequently, OPLS-DA, a supervised
pattern recognition method, was performed to maximize the identification of variation between
groups tested.

4.7. Metabolite Identification and Quantification from Chenomx NMR Suite
     The metabolites were identified using Chenomx NMR suite (Chenomx Inc., Edmonton, AB,
Canada). The fid files from the 1D 1H-NMR spectra were imported into the Chenomx software.
This software has its own processing interface where spectra were Fourier-transformed and baseline
corrected. Phasing was done using DSS reference peak at 0.0 ppm, and the water peak was also deleted.
The processed spectra were analyzed in the profiler module of the software. The 600 MHz library
with the corresponding pH was selected. Identification and concentrations of different metabolites
were calculated by fitting the set of peaks for those compounds in the sample spectrum. If the area
was crowded with many peaks, then multiple metabolites were adjusted at one time to match the
reference spectrum closest to the sample spectrum. The identified and quantified compounds were
then exported into an excel sheet.

4.8. Additional Multivariate Data Analysis and Metabolic Pathway Identification Using MetaboAnalyst
3.0 Software
      MetaboAnalyst 3.0 software, a web-based metabolomics data processing tool [63], was used
to statistically analyze the metabolites identified using Chenomx NMR suite. Quantified data from
Chenomx NMR suite were scaled using range scaling algorithm. Clustering differences, heat maps,
and a Random Forest analysis plot were generated. Further, the top 25 metabolites correlating with
glutamine were identified using Pearson correlation analysis and the significant features were identified
by Random Forest analysis. Additionally, quantified data from Chenomx NMR suite was transferred
into an excel table which allowed us to perform a Student’s t-test and calculate fold changes. A p-value
of less than 0.05 was considered to be statistically significant for univariate analysis.
      Metabolic pathway identification was performed with the pathway analysis option of
Metaboanalyst 3.0 software. Briefly, the Homo Sapiens Pathway Library was selected as a reference,
and the pathway analysis was performed to generate pathway analysis output on all matched
Metabolites 2019, 9, 50 18 of 21
pathways, based on the p-values from pathway enrichment analysis and pathway impact values
from pathway topology analysis.
Further, metabolites that were changing most significantly between the control and 30 µM
treatment were traced back to their origin, and the pathways were interpreted for metabolism changes
using current biochemistry.
4.9. Western Blot for Protein Expression Analysis
One million cells of each of A549 and H1299 were seeded in 100-mm dishes and incubated for 24 h;
then, the original media was replaced by media with/without δT and incubated for another 72 h. After
72 h incubation, cells were washed with ice-cold PBS and lysed in the cold 1X cell lysis buffer (Cell
Signaling Technology, Danvers, MA, USA) for 30 min on ice with 1X protease inhibitor (Cell Signaling
Technology, Danvers, MA, USA). The cell lysate was kept at −80 ◦ C overnight before quantifying.
Protein concentrations were estimated using Pierce BCA Protein Assay kit (Bio-Rad Laboratories,
Hercules, CA, USA). Total cell lysates (40 µg) were mixed with equal amounts of 6x laemmli buffer
(Bio-Rad Laboratories, Hercules, CA, USA), followed by boiling at 100 ◦ C for 5 min. Samples were
loaded on 10% SDS-polyacrylamide gel electrophoresis, and then the gel was electrophoretically
transferred to a nitrocellulose membrane (Whatman, Clifton, NJ, USA) in transfer buffer (25 mM
Tris, 190 mM glycine, 20% methanol) using a Bio-Rad Trans-Blot® Turbo™ Transfer System (Hercules,
CA, USA). The membranes were incubated for 1 h at room temperature with 5% BSA in 1x TBS
buffer containing 0.1% Tween. After incubation, the membranes were incubated overnight at
4 ◦ C with primary antibodies (1:1000). The following antibodies ASCT2, LAT-1, p-mTOR, mTOR,
p-4EBP-1,4-EBP1, and B-actin (Cell Signaling Technology, Danvers, MA, USA) were used in the
analysis. The membranes were washed three times with TBS-T and subsequently incubated with the
secondary antibodies (1:5000) containing 2% BSA for 2 h at room temperature. The signal intensity was
then measured by chemiluminescent imaging with ChemiDoc XRS (Bio-Rad Laboratories, Hercules,
CA, USA).
5. Conclusions
In this work, the anticancer effects of δT on NSCLC cell lines A549 and H1229 were investigated
and confirmed by 1H-NMR metabolomics analysis. A closer look into the intracellular metabolome of
NSCLC cells revealed significant and potentially beneficial alterations in glutamine concentrations
and related metabolism upon treatment with δT. The data purports that δT exerts its action by
inhibiting glutamine uptake into proliferating cells by inhibition of glutamine transporters, thereby
resulting in inhibition of cell proliferation and induction of apoptosis via downregulation of the mTOR
pathway (Figures 4B and 5). Through this work, NMR-based cellular metabolomics helps provide
possible opportunities for evaluating the therapeutic effect of phytochemicals and systemic changes in
cancer metabolism.
Supplementary Materials: The following are available online at http://www.mdpi.com/2218-1989/9/3/50/s1.
Table S1: List of metabolite concentrations determined using Chenomx NMR Suite in A549 cells. Table S2: List of
metabolite concentrations determined using Chenomx NMR Suite in H1299 cells. Figure S1: Effects of δT on A549
(A) and H1299 (B) on the metabolome of lung cancer cell lines.
Author Contributions: Conceptualization, L.D.R. and S.V.G.; Methodology, L.D.R.; Software, L.D.R.; Formal
Analysis, L.D.R. and M.H.; Investigation, S.V.G.; Resources, S.V.G.; Data Curation, L.D.R.; Writing—Original
Draft Preparation, L.D.R. Writing—Review and Editing, L.D.R., M.H., and S.V.G; Supervision, S.V.G.; Funding
Acquisition, S.V.G.
Funding: This research was conducted using intra-mural funding.
Acknowledgments: We thank Alexander Buko, Vice President Business and Product Development at Human
Metabolome Technologies America for comments on results and language and the assistance with additional
bioinformatics methods that greatly improved the manuscript. We are also immensely grateful to Bashar Ksebati
for NMR instrument support.
Conflicts of Interest: The authors declare no conflicts of interest.Metabolites 2019, 9, 50 19 of 21
References
1. Society, A.C. Lung Cancer (Non-Small Cell). Available online: http://www.cancer.org/acs/groups/cid/
documents/webcontent/003115-pdf.pdf (accessed on 09 March 2019).
2. American Cancer Society. Cancer Facts & Figures 2016; American Cancer Society: Atlanta, GA, USA, 2016.
3. Kelsey, C.R.; Clough, R.W.; Marks, L.B. Local Recurrence Following Initial Resection of NSCLC: Salvage Is
Possible with Radiation Therapy. Cancer J. 2006, 12, 283–288. [CrossRef] [PubMed]
4. Newman, D.J.; Cragg, G.M. Natural products as sources of new drugs over the 30 years from 1981 to 2010.
J. Nat. Prod. 2012, 75, 311–335. [CrossRef] [PubMed]
5. Wang, J.L.; Gold, K.A.; Lippman, S.M. Natural-agent mechanisms and early-phase clinical development.
Top. Curr. Chem. 2013, 329, 241–252. [CrossRef]
6. Aggarwal, B.B.; Shishodia, S. Molecular targets of dietary agents for prevention and therapy of cancer.
Biochem. Pharmacol. 2006, 71, 1397–1421. [CrossRef]
7. Surh, Y.J. Cancer chemoprevention with dietary phytochemicals. Nat. Rev. Cancer 2003, 3, 768–780. [CrossRef]
[PubMed]
8. Theriault, A.; Chao, J.-T.; Wang, Q.; Gapor, A.; Adeli, K. Tocotrienol: A review of its therapeutic potential.
Clin. Biochem. 1999, 32, 309–319. [CrossRef]
9. De Silva, L.; Chuah, L.H.; Meganathan, P.; Fu, J.-Y. Tocotrienol and cancer metastasis. BioFactors 2016, 42,
149–162. [CrossRef]
10. Constantinou, C.; Papas, A.; Constantinou, A.I. Vitamin E and cancer: An insight into the anticancer activities
of vitamin E isomers and analogs. Int. J. Cancer 2008, 123, 739–752. [CrossRef] [PubMed]
11. Rajasinghe, L.D. Anti-Cancer Effects of Tocotrienols in NSCLC. Ph.D. Thesis, Wayne State University, Detroit,
MI, USA, 2017.
12. Ji, X.; Wang, Z.; Geamanu, A.; Sarkar, F.H.; Gupta, S.V. Inhibition of cell growth and induction of apoptosis
in non-small cell lung cancer cells by delta-tocotrienol is associated with notch-1 down-regulation. J. Cell.
Biochem. 2011, 112, 2773–2783. [CrossRef]
13. Rajasinghe, L.D.; Pindiprolu, R.H.; Gupta, S.V. Delta-tocotrienol inhibits non-small-cell lung cancer cell
invasion via the inhibition of NF-κB, uPA activator, and MMP-9. OncoTargets Ther. 2018, 11, 4301–4314.
[CrossRef]
14. Kwon, H.; Oh, S.; Jin, X.; An, Y.J.; Park, S. Cancer metabolomics in basic science perspective. Arch. Pharm.
Res. 2015, 38, 372–380. [CrossRef]
15. Puchades-Carrasco, L.; Pineda-Lucena, A. Metabolomics Applications in Precision Medicine: An Oncological
Perspective. Curr. Top. Med. Chem. 2017, 17, 2740–2751. [CrossRef]
16. Tran, Q.; Lee, H.; Park, J.; Kim, S.H.; Park, J. Targeting Cancer Metabolism—Revisiting the Warburg Effects.
Toxicol. Res. 2016, 32, 177–193. [CrossRef] [PubMed]
17. Mohamed, A.; Deng, X.; Khuri, F.R.; Owonikoko, T.K. Altered glutamine metabolism and therapeutic
opportunities for lung cancer. Clin. Lung Cancer 2014, 15, 7–15. [CrossRef] [PubMed]
18. Abubakar, I.B.; Lim, S.-W.; Loh, H.-S. Synergistic Apoptotic Effects of Tocotrienol Isomers and Acalypha
wilkesiana on A549 and U87MG Cancer Cells. Trop. Life Sci. Res. 2018, 29, 229–238. [CrossRef] [PubMed]
19. Zhdanov, A.V.; Waters, A.H.C.; Golubeva, A.V.; Dmitriev, R.I.; Papkovsky, D.B. Availability of the key
metabolic substrates dictates the respiratory response of cancer cells to the mitochondrial uncoupling.
Biochim. Biophys. Acta BBA-Bioenerg. 2014, 1837, 51–62. [CrossRef]
20. Gonzalez Herrera, K.N.; Lee, J.; Haigis, M.C. Intersections between mitochondrial sirtuin signaling and
tumor cell metabolism. Crit. Rev. Biochem. Mol. Biol. 2015, 50, 242–255. [CrossRef]
21. Robert, S.M.; Sontheimer, H. Glutamate Transporters in the Biology of Malignant Gliomas. Cell. Mol. Life Sci.
CMLS 2014, 71, 1839–1854. [CrossRef]
22. Fuchs, B.C.; Finger, R.E.; Onan, M.C.; Bode, B.P. ASCT2 silencing regulates mammalian target-of-rapamycin
growth and survival signaling in human hepatoma cells. Am. J. Physiol. Cell Physiol. 2007, 293, C55–C63.
[CrossRef]
23. Shimizu, K.; Kaira, K.; Tomizawa, Y.; Sunaga, N.; Kawashima, O.; Oriuchi, N.; Tominaga, H.; Nagamori, S.;
Kanai, Y.; Yamada, M.; et al. ASC amino-acid transporter 2 (ASCT2) as a novel prognostic marker in
non-small cell lung cancer. Br. J. Cancer 2014, 110, 2030–2039. [CrossRef]You can also read