Demographic Perspectives on the Rise of Longevity - Mortality and Longevity Aging and Retirement - SOA.org
←
→
Page content transcription
If your browser does not render page correctly, please read the page content below

Mortality and Longevity

 Aging and Retirement

 Demographic Perspectives on the Rise
 of Longevity

January 2020
2

 Demographic Perspectives on the Rise of
 Longevity

AUTHOR James W. Vaupel, Ph.D. SPONSOR Society of Actuaries:
 Interdisciplinary Center on Population Aging and Retirement Research
 Dynamics, University of Southern Denmark Committee on Life Insurance Research
 Financial Reporting Section
 Francisco Villavicencio, Ph.D. Mortality and Longevity Research
 Department of International Health Product Development Section
 Bloomberg School of Public Health, Johns Hopkins University Reinsurance Section

 Marie-Pier Bergeron-Boucher, Ph.D.
 Interdisciplinary Center on Population Dynamics
 University of Southern Denmark

 Funding: This research was supported by AARP, the AXA Research Fund, and the US National Institute on Aging (P01 AG031719).

 Conflict of interest: None.

 Caveat and Disclaimer

 The opinions expressed and conclusions reached by the authors are their own and do not represent any official position or opinion of the Society of
 Actuaries or its members. The Society of Actuaries makes no representation or warranty to the accuracy of the information.

 Copyright © 2020 by the Society of Actuaries. All rights reserved.

 Copyright © 2020 Society of Actuaries
3

CONTENTS
Abstract .................................................................................................................................................................... 4
Section 1: The Past and Present of Longevity ............................................................................................................ 5
 1.1 Fixed Frontier of Survival ............................................................................................................................ 5
 1.2 The Advancing Frontier of Survival............................................................................................................. 5
Section 2: The Future of Longevity .......................................................................................................................... 12
Section 3: The Present and Future of Forecasting Longevity .................................................................................... 14
Section 4: Acknowledgments .................................................................................................................................. 19
References .............................................................................................................................................................. 19
About The Society of Actuaries ............................................................................................................................... 24

 Copyright © 2020 Society of Actuaries
4

Demographic Perspectives on the Rise of
Longevity

Abstract
This article summarizes the findings of the most significant demographic publications on human longevity and
explores possible future trends in life expectancy at birth. Demographic data on age-specific mortality are used to
estimate life expectancy, and validated data on exceptional lifespans are used to study the maximum length of life. In
the countries doing best each year, life expectancy started to increase around 1840 at a pace of almost 2.5 years per
decade. This trend has continued until the present. Contrary to classical evolutionary theories of senescence and
contrary to the predictions of many experts, the frontier of survival is advancing to higher ages. Furthermore,
individual lifespans are becoming more equal, reducing inequalities, with octogenarians and nonagenarians
accounting for most deaths in countries with high life expectancy. If the current pace of progress in life expectancy
continues, most children born this millennium will celebrate their 100th birthdays. Considerable uncertainty, however,
clouds forecasts of life expectancy and maximum lifespans: life expectancy and maximum lifespan might increase very
little if at all or longevity might rise much faster than in the past. Substantial progress has been made over the past
three decades in deepening understanding of how long humans have lived and how long they might live. The social,
economic, health, cultural and political consequences of further increases in longevity are so significant that the
development of more powerful methods of forecasting is a priority.

Key words: Forecasts, Life expectancy, Lifespan equality, Maximum lifespan, Mortality

 Copyright © 2020 Society of Actuaries
5

Section 1: The Past and Present of Longevity
1.1 FIXED FRONTIER OF SURVIVAL
How much can human lifespan be extended? This is a top scientific question today (1)—and has been a topic of
great interest at least since the exploits of Gilgamesh almost 5,000 years ago (2). Around 350 B.C. Aristotle provided
a persuasive, pessimistic answer. He compared the “vital heat” of life to a fire that was burning down (3). The fire
could be put out prematurely by throwing sand or water on it—which was analogous to death from an epidemic or
in war. Or the fire could die down naturally—which was analogous to old-age mortality. Premature mortality could
be reduced but the natural length of life could not be extended. This concept of a fixed frontier of survival was the
dominant idea about longevity from 350 B.C. until recently. A highly cited article published in 1980 restated similar
ideas to Aristotle’s: “The inevitable result is natural death, even without disease. Although a disease process may
appear to be the cause of death, the actual cause is loss of the organism’s ability to maintain homeostasis” (4,
p.131). At the end of the 20th century, the United Nations still assumed a fixed limit to life expectancy in their
projections. Some scholars set the limit at age 85 (4, 5): “S. Jay Olshansky […] says we’re near our upper limit for
average life spans. ‘Possibly we can get it up from 80 to 85,’ he says, noting that already ‘Japan is closing in on it’.”
(6). A controversial article from 2016 claimed evidence of a limit to human lifespan, at around 115 years (7).

One argument for a limit to human lifespan is that evolution does not care about old age because older women are
post-reproductive and older men have few children. To some extent, older people help children survive and thereby
contribute to maximizing the number of offspring (8), but this effect is small, especially over the long period of
human evolution when few individuals reached age 70 (9). Hence, we are not designed to live into advanced old age
(10, 11). Evolutionary processes favor genetic variants and physiological processes that enhance reproduction and
survival at young ages. On the other hand, there is no strong evolutionary pressure against genetic variants or
physiological processes that have deleterious effects at older ages, especially if these genes or physiological
processes have positive effects at younger ages.

W. D. Hamilton (12), in line with the work of Medawar (13), Williams (14) and Kirkwood (15), captured this
perspective by mathematical equations. He concluded that deterioration with age was inevitable for all species and
that only radical genetic changes could extend lifespans. In particular, “after a few hundred years of draconian
eugenic measures […] the human lifespan might be stretched out just a little […] say [to] 75 instead of […] 70.”
Hence, he asserted that research on “extension of active life seems to me comparable with the alchemists’ search
[…] [and] detracts both from unavoidable truth and from realistic social programs.” (12, p.91)

1.2 THE ADVANCING FRONTIER OF SURVIVAL
The idea of a fixed frontier of survival is debated. Recent studies show progress in old age survival, weakening the
concept of fixed limit, or at least foreseeable limit. Until the 1990s serviceable data on death rates after age 85 were
not available, but since then reliable statistics have been compiled for many countries and over many years (16, 17).
Data for Sweden show that before 1950 there was little progress in reducing mortality for 85-year-old Swedes:
Aristotle was more or less right until then. But afterwards there were dramatic improvements (16). For Swedish
women, the risk of death at age 85 has been cut from about 17% in 1950 to 7% in 2018 (17, 18). There were similar
progress for men, and at ages 90 and 95 for both women and men (16-18).

This finding has been replicated for many countries (19, 20) and is supported by the most recent data from the
Human Mortality Database (17). Furthermore, Hamilton’s assertion that deterioration with age is inevitable for all
species has been theoretically proved to be wrong (21, 22), something that has also been demonstrated empirically
(23, 24). Figure 1 shows the average annual improvements in age-specific death rates in the preceding ten years
(20) for French, Japanese, Swedish and US females between ages 80 and 100. In Sweden, progress in mortality is
observed between ages 80 and 95, but not after, as previously shown (25, 26). However, reductions in death rates
(positive rates of mortality improvement) are observed in France and Japan at all ages in most years. In the US,

 Copyright © 2020 Society of Actuaries

6

death rates increased around the year 2000, but decreased before the mid-1990s and since the mid-2000s, showing
progress at older ages in recent years. For US females, the risk of death at age 85 decreased from 14% in 1950 to 7%
in 2017. Similar progress was also observed at older ages (e.g. from 31% to 22% at age 95). Another example is
provided by German unification: Before 1990 people in East Germany suffered higher death rates than people in
West Germany. After unification, the East German disadvantage at ages above 65 rapidly disappeared (27). This
quasi-experimental evidence demonstrates that even very old people can benefit from improved conditions (28).

Figure 1
AVERAGE RATES OF MORTALITY IMPROVEMENT (RMI) IN THE PRECEDING TEN YEARS AT AGES 80 TO 100: FRENCH,
JAPANESE, SWEDISH AND US FEMALES, 1980-2016

Note: Calculations by method in (20) using data from (17)

The improvements in survival at older ages are due to a postponement of mortality to older ages. That is, lifespans
have been extended and mortality risks have shifted toward higher ages. A recent article on the “Advancing Front of
Old-Age Human Survival” cogently demonstrates this (29). Table 1 provides an illustration. Note, for example, that in
France the probability of death at age 70 in 2016 equals the probability of death at age 59 for females and 58 for
males half a century ago (17). On average, for the countries and ages shown in Table 1, over the past 50 years mortality
has been postponed by about a decade.

 Copyright © 2020 Society of Actuaries
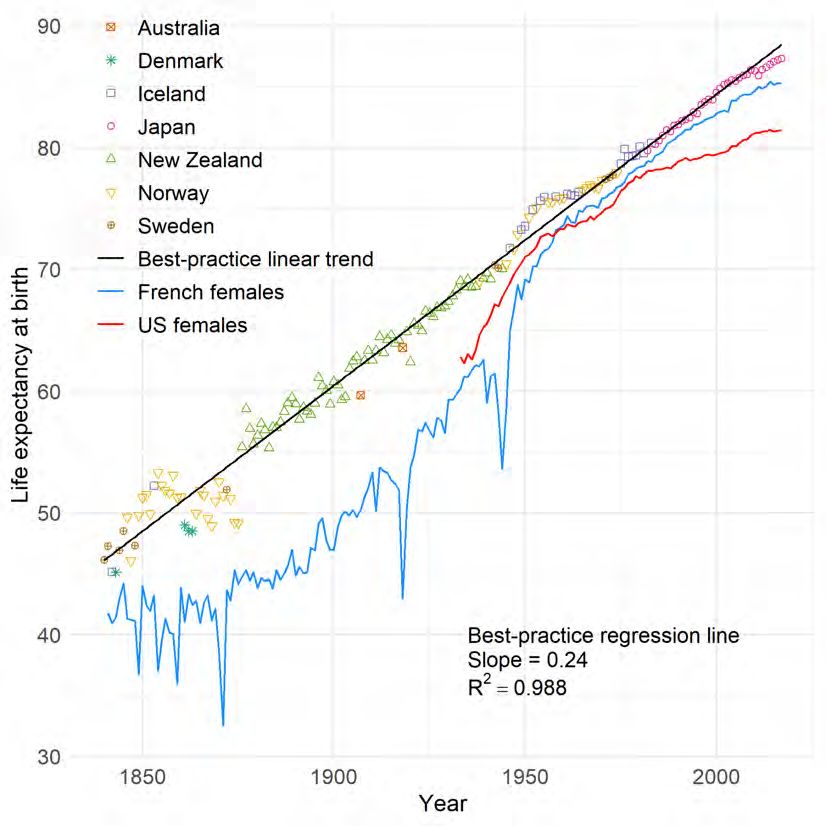
7

Table 1
CURRENT AGE (2016) AND AGE OF EQUIVALENT MORTALITY 50 YEARS AGO (1966)

 Equivalent age in 1966

 Females Males
 Age
 France Japan Sweden USA France Japan Sweden USA
 50 40 37 42 44 40 37 42 43
 60 51 45 53 53 51 49 52 51
 70 59 55 63 63 58 59 61 59
 80 71 67 73 74 69 69 73 71
 90 84 80 85 84 84 82 86 84

Note: Mortality measured as the probability of death at a given age in 2016, and compared with the age with the same probability of
death in 1966 using data from (17).

The advancing frontier of survival is part of a larger life-expectancy revolution (30). In 1840 Swedish women enjoyed
the world’s longest life expectancy at birth: 46 years. Over time the world record steadily increased, with different
countries taking the lead. For the last three decades, Japan has been the record holder. Life expectancy at birth for
Japanese women in 2016 was more than 87 years (17). So, from 46 in 1840 to 87 today, best-practice life expectancy
has almost doubled—rising at a remarkably steady pace of almost two and a half years per decade, three months per
year, six hours per day. Particular countries followed more erratic trajectories than the straight-line best-practice
increase, as illustrated for French and US women in Fig. 2. US life expectancy has stagnated in recent years, due to a
rise in premature mortality and “deaths of despair” below age 65, including accidental poisoning, such as misuse of
opioids and fentanyl (31, 32). Still, at older ages, US mortality has been declining in recent years (32), as shown in Fig.
1.

If period life expectancy over time increases three months per year, then life expectancy for people born in successive
years increases even more rapidly—because as a baby gets older, the person benefits from the progress being made
over time (33). For instance, in part because of this effect and in part because France was catching up with best
practice, for French females born in successive decades from the 1880s to the 1920s, life expectancy rose about four
to five years each decade (17, 33), as opposed to the almost 2.5 years per decade increase in best-practice life
expectancy (Fig. 2).

 Copyright © 2020 Society of Actuaries
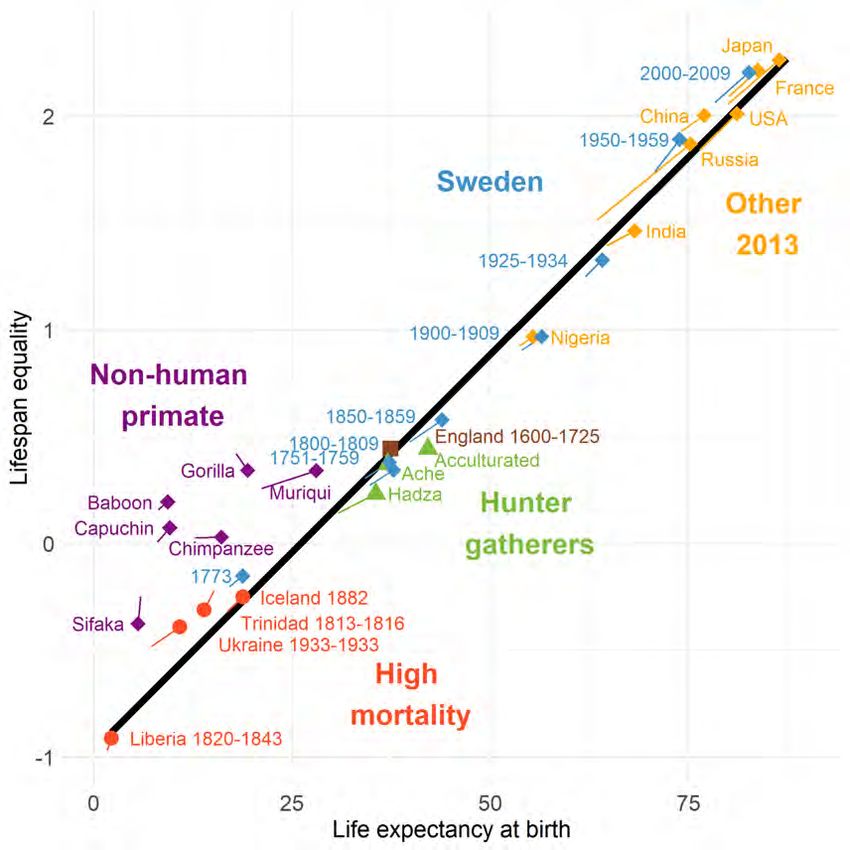
8

Figure 2
BEST-PRACTICE LIFE EXPECTANCY AT BIRTH, 1840-2016

Note: Adapted from (30) using the most recent data from (17). In all cases, the values pertain to female life expectancy.

Studies of hunter-gatherers, people today who live more or less the way our ancestors lived thousands of years ago,
provide evidence about the long-term history of human longevity. Various studies indicate a life expectancy at birth
of less than 40 years for these populations (34). Studies of parish data from England over the period 1600 to 1725
show similarly short life expectancies (34) as do the data from Sweden from 1751 to the 1830s (17). Hence, it can be
concluded that human life expectancy before 1840 generally fell below 40, and in situations of famine, epidemic or
war the value could be much lower. The long-term history of human life expectancy is a history of low, fluctuating life
expectancies, until the life-expectancy revolution started around 1840, leading to life expectancies today of more than
80 in many countries (17, 30).

As life expectancy rose, lifespan equality—how similar lifespans are—increased in lockstep (34). Studying lifespan
equality together with life expectancy is important, since lifespan equality is an indicator of population health
inequality and of individual lifespan uncertainty (35). As lifespans became longer on average, they also became
increasingly equal, something that has been found to hold in a lifespan continuum over millions of years of primate
evolution, in many countries and between subgroups in a population (34). Figure 3 depicts this relationship from
historical to modern populations (e.g. Sweden over time in blue); from high (in red) to low mortality regime (in yellow);

 Copyright © 2020 Society of Actuaries
9

from hunter-gatherers (in green) to modern societies (in yellow); and even among non-human primates (in purple).
The relation between high life expectancy and lifespan equality has been attributed to reductions in premature
mortality. “The countries that have the highest life expectancy today are those which have been most successful at
postponing the premature deaths that contribute to early-life disparity.” (36, p.4) The measure of lifespan equality
used in Fig. 3 is based on the concept of lifetable entropy, first developed by Leser (37) and further explored by Keyfitz
(38) and Demetrius (39). Measures based on the coefficient of variation or the Gini coefficient yield the same lockstep
pattern, and the change in life expectancy from one year to the next closely tracks the annual change in lifespan
equality (40).

Figure 3
THE CONTINUUM OF LIFE EXPECTANCY AT BIRTH AND LIFESPAN EQUALITY IN HUMAN POPULATIONS

Note: Adapted from the original figure by Fernando Colchero in (34). Lifespan equality is measured by the logarithm of the inverse of
lifetable entropy and defined as ℎ = ln − ln † , where is life expectancy at birth, and † is an indicator of lifespan disparity (34, 40).
The length of the tadpoles represents the difference between females and males in the population, with the head being the females and
the tale the males.

The increase in life expectancy in the countries doing best has been accompanied by an increase in maximum
lifespan—the oldest age attained as verified by reliable data. Figure 4 shows a roughly linear rise of maximum lifespan

 Copyright © 2020 Society of Actuaries
10

of about 1.5 months (0.12 years) per year, lower than the 3-month per year increase in maximum life expectancy, but
still remarkable. The unbroken record of Jeanne Calment who died in 1997 is interpreted by some as the limit to
human lifespan. However, such an interpretation is misleading. Between 1899 and 2014, the mean inter-record time
was around 11.9 years, with three records lasting for more than 20 years (including Calment’s) and the longest lasting
record being a little over 52 years (41). A study by Lenart and colleagues (42) shows that there was only a 20.4%
chance that Calment’s record would have been broken between 1997 and 2017. Medford and Vaupel rather suggest
that “there was a 75% chance of observing a new record in the time since the last one so it is somewhat surprising
that the record still holds. However, 20.7 years is still quite low when compared to the most durable record, which
lasted 52 years” (41 p.6). The data in Fig. 4 (43) and ancillary data on exceptional lifespans (44) do not support the
claim that the maximum attainable lifespan has been reached (7). This claim is also inconsistent with observed
plateaus at a level of about 50%/year of the annual probability of death after age 105 in Italy (45) and after age 110
in a group of countries (44).

As Jonathan Swift observed, everyone wants to live long, but no one wants to be old. As life expectancy rises, what is
happening to health at older ages? To understand this, it is helpful to distinguish three states of health: healthy,
unhealthy and dead. It was feared that rescuing people from death would increase the number of unhealthy people.
Studies have shown mixed results, depending on the measure of health, the population and the age-range studied,
and the data used, with no definite answer to whether the extra years of life are being lived in good health (46). If
“healthy” and “unhealthy” are determined by a person’s ability to live independently and to manage the activities of
daily living (ADL), mixed results are found across studies and populations (47, 48). If health is measured in terms of
chronic diseases indicators, many chronic conditions and cognitive impairment tend to rise in the US and other
countries (48). However, as we live longer, the onset of cognitive impairment and dementia is being postponed to
older ages (49). Health can also be self-reported. Self-reported healthy life expectancy has generally been rising (47,
50, 51). So more people are healthy—and because of saving lives, more people are unhealthy. The balance may have
remained roughly about the same. More people are taking medicine to reduce blood pressure, more people have
pacemakers, and so on—these people are better off, alive rather than dead, but they are clinically ill.

 Copyright © 2020 Society of Actuaries
11

Figure 4
LINEARLY INCREASING AGE OF THE WORLD’S OLDEST PERSON

Note: Adapted from a figure by Jonas Schöley—inspired by a graph by Robert D. Young (http://www.grg.org/sc/graphs/wop2.png)—
using data from (43). Additional studies on supercentenarians and the world´s oldest persons are found in (44).

 Copyright © 2020 Society of Actuaries
12

Section 2: The Future of Longevity
By projecting the historical pace of progress into the future, it is possible to estimate the age that at least 50% of
babies born in some country in some year will attain. Table 2 shows some illustrative results, assuming a pace of
progress in life expectancy of 2 years per decade, representing the average of improvements for France, Japan,
Sweden and US since the mid-20th century. This approach yield similar results to that of some earlier forecasts (47).
As the table indicates, most children alive today in countries with high life expectancy will, if past progress continues,
celebrate their 100th birthdays. Very long lives are the likely destiny of children alive today, provided life expectancy
continues to increase at the historical pace of about two years per decade.

Table 2
OLDEST AGE AT WHICH AT LEAST 50% OF A BIRTH COHORT WILL STILL BE ALIVE

 Year of birth 2000 2005 2010 2015
 France 101 102 103 105
 Japan 103 105 106 108
 Sweden 100 101 102 103
 USA 97 98 99 100

Note: Calculations by method similar to (47) using data from (17).

Among researchers who are willing to speculate about the future of life expectancy there are, broadly speaking, three
views (52):

 1. Some argue that life expectancy will rise more slowly than in the past, perhaps approaching a limit that is not
 much greater than the current best-practice level, with some chance that life expectancy will fall (10).
 2. Others think that life expectancy will continue to rise and mortality to decline at historical pace for the next
 several decades and perhaps longer (53, 54).
 3. Finally, some futurologists predict that life expectancy will rise substantially faster than this, because of major
 biomedical breakthroughs (55).

Most demographers, actuaries and gerontologists appear to think that the future will be somewhere between the
first and second scenarios. Although some think that the second view is more plausible, some strongly support the
first and a few are open to the third. Why is there such a wide range of forecasts among experts on life expectancy?

It can be expected that the future of longevity will be different from the past—but it is not known how different. Since
1840, the country with the highest life expectancy has shifted from Sweden to Japan, and a different country—
perhaps Singapore or Spain (56)—might become the leader in the future. The causes of death against which progress
has been made have shifted from infectious diseases to chronic diseases (57). Before 1950, the rise in life expectancy
was largely fueled by reductions in infant, childhood and younger adult mortality. Today, the rise is largely attributable
to declines in death rates after age 65 and especially after age 80, when most deaths now occur in the most developed
countries (47, 58).

What kinds of mortality improvements might occur in the future? Experts know a great deal about the past but have
difficulty foreseeing events in the future, especially the surprising kinds of events that have occurred so often in the
past but were unforeseen and even unforeseeable.

 • In the next decade or two, substantial progress might be made in reducing the incidence of cancer and in
 treating cancer. Various diseases, including cancer, multiple sclerosis and HIV, might be treated by enhanced
 immune therapies (59).

 • There is evidence that over recent decades dementia has been postponed by roughly two to four years per
 decade (49) and this trend might continue.

 Copyright © 2020 Society of Actuaries
13

 • The new initiative of “precision medicine” aims to develop alternative treatments that are optimal for people
 with various genetic makeups (60). Such therapies might substantially reduce mortality. Furthermore, recent
 breakthroughs in CRISPR technology might lead to strategies for replacing deleterious genes a person might
 have with variants that decrease disease risks.

 • Extensive research on reconstructing or regenerating tissues and organs, such as reconstructing skin or
 regenerating heart tissue damaged by a heart attack, might lead to better treatment and perhaps, in several
 decades, even to find strategies for rejuvenating tissues and organs.

 • Research on nanotechnology might eventually lead to the development of new tools for the manipulation of
 submicroscopic particles to repair damage or to destroy pathogens or cancerous cells (61, 62).

 • Most significantly, research on the basic biology of aging might lead to interventions that slow down the rate
 of aging (63). For example, breakthroughs might be achieved such that it would take two years for a person
 to suffer the deterioration that older people currently experience in one year: That is, roughly speaking, it
 would take two years to grow one year older.

On the other hand, it is not difficult to imagine developments that would slow or even reverse the rise of life
expectancy. Economic growth in the future might be slower than in the past. There might be less money available for
the prevention and treatment of disease. Because of slower economic growth and because of competing needs—
such as the cost of pensions—the resources available for biomedical research might decline. New diseases worse than
AIDS might emerge. Wars might break out. An increasing epidemic of obesity, or other behavioral risk factors (e.g.
overdose), might severely damage health (31, 64). The biomedical breakthroughs adumbrated above might not occur.
It might not be possible to reduce mortality after age 100.

This last risk is perhaps the most significant. As noted earlier, progress in increasing life expectancy since 1950 has
resulted from a postponement of mortality, such that 70 and 80-year-olds have the mortality risk of people a decade
younger half a century ago. There is evidence that the pace of progress in reducing death rates for nonagenarians is
accelerating (Fig. 1). There appears, however, to be little change in death rates after age 100. Perhaps improvements
among centenarians will become more apparent as people reach age 100 in better states of health because of
progress at younger ages. It is also possible, however, that it will not be feasible to substantially reduce centenarian
mortality. If so, life expectancy will not rise to 100.

 Copyright © 2020 Society of Actuaries
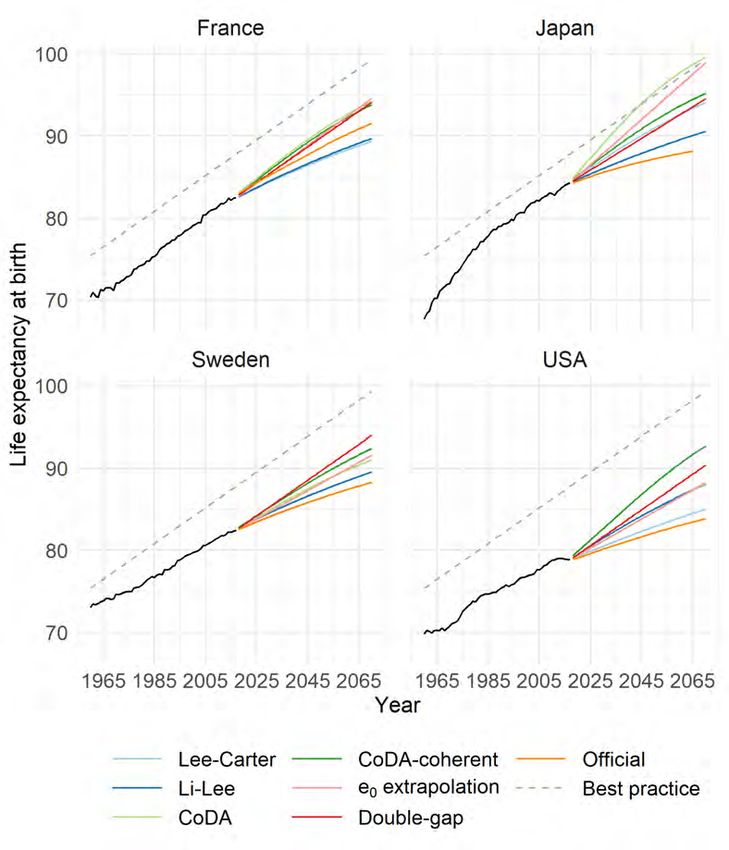
14

Section 3: The Present and Future of Forecasting Longevity
Until recently, most forecasts of life expectancy were based on a judgment about the ultimate limit of life expectancy,
which was assumed to be not much higher than current best-practice life expectancy (30, 33). Values of life
expectancy from the present into the future were interpolated between present life expectancy and the assumed
limit, with faster increases in the near future and slowing increases as the asymptote was approached. This strategy
has consistently produced forecasts that are too low (30, 54, 65). Despite repeated failure, many mortality experts
continue to use their judgments to make forecasts.

A cogent argument can be made that the first step in making a longevity forecast should be to extrapolate historical
data. “Although imperfect, the appeal of extrapolation lies in the long-term stability of the historical mortality decline,
which can be attributed the complex character of the underlying process. This combination of stability and complexity
should discourage us from believing that singular interventions or barriers will substantially alter the course of
mortality decline in the future” (66). Reasons why the future might be better or worse than the past or more uncertain
can then be considered, but adjustments should be made with caution.

Many factors influence mortality, including economic, social and political conditions, educational levels, diet, smoking
and other aspects of personal behavior, epidemics, public health interventions, the quality of health care, the
development of more effective pharmaceutical products, improvements in medical treatments and surgical
procedures, and revolutionary biomedical breakthroughs. Using changes in risk factors and economic and
epidemiological trends to help make forecasts is appealing, but difficult as their future values and their relationships
with mortality and with each other are often imperfectly understood, making their use in forecasting problematic
(54). Simple extrapolative approaches of past trends have generally been more compelling, given the historical
regularities (54, 66). The future may be turbulent but so was the past—consider the 20th century, marked by two
world wars, the Spanish flu, the ascent and retreat of fascism and communism, the great depression, the AIDS
epidemic, etc. Health improvements in the future may be slowed by deleterious trends (obesity), but health
improvements in the past also were slowed by deleterious trends (the rise of cigarette smoking). The future may bring
biomedical breakthroughs in preventing and treating cancer, dementia and perhaps senescence; the past was also
marked by remarkable advances in reducing mortality from infectious and cardiovascular diseases.

Extrapolative methods are often being used to forecast life expectancy based on historical data on age-specific
mortality. Lee, Alho and colleagues (65, 67) have pioneered such methods, which have three major advantages: 1)
They extrapolate empirical data that often show long-term regularities; 2) they are more objective; and 3) they
produce probability distributions of future life expectancy rather than simple point estimates. An array of somewhat
similar methods has been developed (54, 68-70), with the most commonly known being the method developed by
Lee and Carter in 1992 (67). These methods generally assume that age-specific pace of decline in death rates will
persist into the future, sometimes with some modest acceleration. Because death rates at advanced ages have
declined at a slower pace than death rates at younger ages, the methods generally yield what most experts believe,
namely that life expectancy will rise more slowly in the future.

Alternative models have been suggested to forecast mortality. Methods based on a similar approach of that of Lee
and Carter, but using the age-distributions of deaths rather than death rates have been shown to reduce forecast bias
by allowing the pace of mortality decline to accelerate over time (71). A direct approach is to forecast life expectancy
by extrapolating historical data on life expectancy (30). Some pioneering research has been done on this approach
that takes advantage of the remarkable regularity of time trends in best-practice life expectancy (53, 72). If best-
practice life expectancy is forecast linearly, then the gap between it and life expectancy for a given population can be
forecast using data on gaps in the past. Age-specific death rates can be forecast by exploiting the strong relationship
between life expectancy and the pattern of age-specific mortality (73).
This use of the best-practice life expectancy in forecasting is part of a broader approach that recognizes that mortality
trajectories are not independent between populations. Methods have been developed to integrate this coherence
between populations in the forecasts (68, 71, 72), generally assuming that population-specific life expectancies are
converging toward an average or toward best-practice.

 Copyright © 2020 Society of Actuaries
15

Figure 5 shows forecasts of life expectancy for total populations (females and males combined) in France, Japan,
Sweden and the United States up until 2070, using six methods: 1) the Lee-Carter approach (67) and 2) its coherent
version based on the work of Li and Lee assuming that population-specific trends are converging towards an average
(68); 3) forecasts based on the extrapolation of death distributions, a method known as Compositional Data Analysis
(CoDA), and 4) its coherent version assuming that population-specific trends are converging toward an average (71);
5) direct extrapolation of life expectancy at birth and 6) its coherent version forecasting the gap between the best-
practice and the population-specific trends (72).

In addition, Fig. 5 shows the official national forecasts for each selected country (74-77). The methods and
assumptions between country vary (78). For example, Japan official forecast is based on a Lee-Carter model, using a
fitting period from 1970 (rather than from 1960 as in our forecasts), to reflect the changes in mortality that gradually
slowed down in recent years (76). Sweden also uses a variant of the Lee-Carter model for their forecasts (75). The
official forecasts for France are based on a mixture of expert opinions and extrapolation (77). For the United States,
ultimate average annual percentage reduction in mortality rates are assumed by age groups and causes of death.
Starting from annual reductions in central death rates observed in recent years, these annual reductions transition
rapidly towards the ultimate annual percentage reductions assumed by 2043 (74). The official forecasts are generally
lower (except for France) than the extrapolative approaches presented in Fig. 5, either because of their assumptions
or judgements, or the use of a fitting period yielding slower mortality improvements.

The life expectancy value and 95% prediction intervals (or high-low variants for official forecasts) in 2050 and 2070
are shown in Table 3 for both sexes. The 95% prediction intervals widen over time and overlap. The methods produce
different forecasts and prediction intervals. The range of forecast values reflects the uncertainty about future life
expectancy trends. Assessing which models produce the most accurate forecast is of importance, but the best
performing model varies across populations and time periods. Knowing if progress in mortality at older ages, where
most deaths occur, will stay constant or will be accelerating is of crucial importance in selecting the appropriate
forecast model. Note that the linear best-practice life expectancy trend from 1840 to 2017 rises close to 100 by 2070.

 Copyright © 2020 Society of Actuaries
16

Figure 5
LIFE EXPECTANCY AT BIRTH, HISTORICAL LEVELS AND FORECASTS 2018-2070

Note: The linear trend in best-practice life expectancy is shown as a dashed line. The best-practice estimates for 2018-2070 are
extrapolations of the 1840-2016 linear trend. Forecasts for the period 2018-2070 with time-series data for 1960-2017 from (17).
Forecasts and prediction intervals (see Table 3) are computed using six models (67, 68, 71, 72) or extracted from official national forecast
(74-77).

 Copyright © 2020 Society of Actuaries
17

Table 3
FORECASTS OF LIFE EXPECTANCY AT BIRTH WITH PREDICTION INTERVALS, 2050 AND 2070
 CoDA- Official
 Lee-Carter Li-Lee CoDA extrapol. Double-gap
 coherent forecast

 Females
 France
 89.6 89.8 92.6 92.2 92.5 92.8 90.3
 2050
 (88.2, 91.0) (88.1, 91.1) (91.4, 93.8) (91.1, 93.4) (88.3, 96.6) (90.1, 95.6) (88.3, 93.0)
 91.7 92.0 95.7 95.2 96.9 97.2 93.0
 2070
 (89.9, 93.2) (90.2, 93.3) (94.4, 96.8) (94.0, 96.5) (91.5, 102.3) (93.7, 100.3) (90.0, 96.0)
 Japan
 93.8 91.1 97.3 94.0 96.9 92.9 90.4
 2050
 (90.7, 95.9) (88.2, 93.2) (94.8, 99.4) (91.2, 97.7) (87.3, 106.8) (90.2, 95.8) (89.4, 91.4)
 96.6 92.9 100.6 96.7 102.8 96.3 91.4*
 2070
 (93.8, 98.6) (90.0, 95.3) (98.5, 102.3) (93.2, 100.4) (90.5, 115.4) (92.8, 99.5) (90.2, 92.5)
 Sweden
 87.9 89.3 89.3 90.6 89.4 91.4 87.5
 2050
 (85.7, 89.7) (88.0, 90.6) (87.9, 90.8) (89.8, 91.7) (86.2, 92.4) (89.7, 93.3) NA
 89.7 91.5 92.0 93.7 92.6 95.9 89.4
 2070
 (87.3, 91.6) (90.2, 92.9) (90.4, 93.4) (92.4, 95.3) (88.7, 96.4) (93.6, 98.1) NA
 USA
 84.9 87.4 86.4 90.0 86.2 88.7 84.2
 2050
 (83.6, 86.0) (85.2, 89.2) (84.5, 88.6) (87.6, 92.5) (79.8, 92.2) (86.7, 90.5) (82.7, 85.9)
 86.8 90.3 89.4 94.2 89.2 93.1 85.7
 2070
 (85.2, 88.1) (87.9, 92.1) (86.9, 92.3) (91.6, 96.5) (80.9, 97.0) (90.7, 95.4) (83.6, 88.0)
 Males
 France
 84.4 84.6 87.8 87.2 87.2 88.1 86.8
 2050
 (82.5, 86.1) (82.8,86.1) (86.6, 89.2) (85.9, 89.0) (82.6, 92.3) (83.4, 93.7) (84.5, 89.5)
 86.9 87.1 91.8 91.0 92.0 92.6 90.1
 2070
 (84.8, 88.8) (85.2, 88.8) (90.5, 93.1) (89.2,92.8) (86.2, 98.7) (86.4, 99.2) (87.1, 93.1)
 Japan
 87.3 85.6 91.2 88.3 89.6 87.8 84.0
 2050
 (85.0, 89.4) (83.7,87.3) (88.5, 94.2) (85.9, 92.9) (80.4, 99.3) (82.8, 92.9) (83.0, 85.0)
 90.2 87.9 95.4 91.7 94.7 91.2 85.0*
 2070
 (87.9, 92.2) (85.7, 89.6) (92.4, 97.8) (88.0, 96.8) (83.2, 107.2) (84.1, 97.7) (83.8, 86.1)
 Sweden
 84.8 85.3 85.6 87.1 86.7 88.7 85.2
 2050
 (81.5, 87.5) (83.9,86.0) (84.8, 86.4) (86.7, 87.6) (80.5, 93.7) (83.5, 94.2) NA
 86.8 87.6 88.3 90.3 90.3 93.1 87.2
 2070
 (82.9, 89.5) (86.0, 89.1) (87.6, 89.1) (89.6, 91.4) (82.7, 98.9) (86.3, 100.3) NA
 USA
 80.9 82.8 82.8 85.7 83.0 84.5 80.1
 2050
 (79.0, 82.6) (80.2, 83.4) (80.9, 84.5) (84.1, 87.5) (78.1, 87.8) (79.2, 89.4) (78.2, 82.2)
 83.4 86.0 86.7 90.5 87.1 89.2 82.0
 2070
 (81.0, 85.2) (83.4, 88.1) (84.1, 89.0) (88.7, 92.5) (80.6, 93.2) (82.0, 95.2) (79.3, 84.7)
* The official population forecast for Japan ends in 2065.

Note: Forecasts for the period in 2050 and 2070 with time-series data for 1960-2017 from (17). Forecasts and prediction intervals are
computed using six models (67, 68, 71, 72) or extracted from official national forecast (74-77).

 Other strategies than those presented in Fig. 5 and Table 3 exist or could be developed. Directions for research include
 the following options for better exploiting empirical data about trends in the past.

 Copyright © 2020 Society of Actuaries
18

 • The causes of the linear rise in best-practice life expectancy since 1840 are not well understood.

 • How can cohort effects be incorporated in longevity forecasts? (79, 80).

 • Extensive data over age, time, population and sex are available on proximate, underlying and contributing
 causes of death. A wealth of information is also available on various aspects of individuals’ health over age
 and time. How can this information be used to improve mortality forecasts?

 • Extreme value theory could be used to study patterns and trends of survival among the pioneers on the
 advancing frontier of survival—those older than 100 or 110 (81).

 • Populations are heterogeneous. The frail tend to die first. This is related to tempo effects on mortality (82).
 Some innovative research suggests that it might be feasible to model heterogeneity in forecasting models
 (83).

 • More research is necessary to improve methods for estimating the uncertainty around population forecasts.
 The 95% prediction interval should capture the true value of life expectancy 95% of the time. This can be
 checked by using data over some interval in the past to forecast life expectancy at some subsequent time in
 the past. If this is done repeatedly, with different intervals and perhaps different populations, then x% of the
 forecasts should fall into the estimated x% prediction interval—and 100-x% should fall outside.

 • Other possible methods for mortality forecasting also could be developed, including microsimulation (84)
 and Bayesian population projections (85).

In addition to the development of more powerful strategies for exploiting empirical data on past health and mortality
trends, research is also needed on how to take better advantage of the knowledge of experts. As noted above, experts
have been abysmally poor at assessing limits to human life expectancy. It might, however, be possible to make
structured use of expert judgments to develop forecasts based on alternative scenarios about future economic,
political and social conditions. Furthermore, experts might provide useful information about the probability and timing
of research advances that result, say, in interventions that slow the rate of aging (86).

The on-going and unprecedented rise of longevity over the past two centuries is so remarkable that the future of
longevity may be rich in similarly outstanding developments (9). The future will almost certainly be surprising, but it
might be possible to anticipate some trends. The social, economic, health, cultural and political consequences of
further increases in longevity are of such significance that the development of more powerful methods of forecasting
is a priority.

 Copyright © 2020 Society of Actuaries
19

Section 4: Acknowledgments
We are grateful to Erwin Tan, Jesus-Adrian Alvarez, Annette Baudisch, Kaare Christensen, Fernando Colchero, Ilya
Kashnitsky, Marius Pascariu, and Jonas Schöley for their input.

References
1. Couzin J. How much can human life span be extended? Science. 2005;309(5731):83.

2. George AR. The epic of Gilgamesh: the Babylonian epic poem and other texts in Akkadian and Sumerian.
 London: Penguin; 2002.

3. Barnes J. On length and shortness of life & On youth, old age, life and death, and respiration. In: Barnes J,
 editor. Complete works of Aristotle: the revised Oxford translation. 1. Princeton: Princeton University Press;
 1984. p. 740-63.

4. Fries JF. Aging, natural death, and the compression of morbidity. New England Journal of Medicine.
 1980;303:130-5.

5. Olshansky SJ, Carnes BA, Cassel C. In search of Methuselah: estimating the upper limits to human longevity.
 Science. 1990;250(4981):634-40.

6. Rotman D. Why you shouldn't fear the gray tsunami. MIT Technology Review. 2019 August 21.

7. Dong X, Milholland B, Vijg J. Evidence for a limit to human lifespan. Nature. 2016;538(7624):257-9.

8. Hawkes K. Grandmothers and the evolution of human longevity. American Journal of Human Biology.
 2003;15(3):380-400.

9. Vaupel JW. Biodemography of human ageing. Nature. 2010;464(7288):536-42.

10. Olshansky SJ, Carnes BA, Désesquelles A. Prospects for human longevity. Science. 2001;291(5508):1491-2.

11. Carnes BA, Olshansky SJ. A realist view of aging, mortality, and future longevity. Population and Development
 Review. 2007;33(2):367-81.

12. Hamilton WD. Live now, pay later: the moulding of senescence by natural selection. In: Hamilton WD, editor.
 Narrow roads of gene land. 1. New York: Freeman; 1996. p. 85-128.

13. Medawar PB. An unsolved problem of biology. London: Lewis; 1952.

14. Williams GC. Pleiotropy, natural selection, and the evolution of senescence. Evolution. 1957;11(4):398-411.

15. Kirkwood TB. Evolution of ageing. Nature. 1977;270(5635):301-4.

16. Vaupel JW, Lundstrom H. Longer life expectancy? Evidence from Sweden of reductions in mortality rates at
 advanced ages. In: Wise DA, editor. Studies in the Economics of Aging. Chicago: University of Chicago Press;
 1994. p. 79-102.

17. Human Mortality Database. University of California, Berkeley, and Max Planck Institute for Demographic
 Research, Rostock. Available at http://www.mortality.org.

 Copyright © 2020 Society of Actuaries
20

18. Statistics Sweden. Available at https://www.scb.se/en/.

19. Kannisto V, Lauritsen J, Thatcher AR, Vaupel JW. Reductions in mortality at advanced ages: several decades of
 evidence from 27 countries. Population and Development Review. 1994;20(4):793-810.

20. Rau R, Soroko E, Jasilionis D, Vaupel JW. Continued reductions in mortality at advanced ages. Population and
 Development Review. 2008;34(4):747-68.

21. Vaupel JW, Baudisch A, Dölling M, Roach DA, Gampe J. The case for negative senescence. Theoretical
 Population Biology. 2004;65(4):339-51.

22. Jones OR, Scheuerlein A, Salguero-Gómez R, Camarda CG, Schaible R, Casper BB, Dahlgren JP, Ehrlén J, García
 MB, Menges E, Quintana-Ascencio P, Caswell H, Baudisch A, Vaupel JW. Diversity of ageing across the tree of
 life. Nature. 2014;505(7482):169-73.

23. Baudisch A. Inevitable aging? Contributions to evolutionary-demographic theory. Berlin: Springer; 2008.

24. Baudisch A, Vaupel JW. Getting to the root of aging. Science. 2012;338(6107):618-9.

25. Medford A, Christensen K, Skytthe A, Vaupel JW. A Cohort Comparison of Lifespan After Age 100 in Denmark
 and Sweden: Are Only the Oldest Getting Older? Demography. 2019;56(2):665-77.

26. Modig K, Andersson T, Vaupel J, Rau R, Ahlbom A. How long do centenarians survive? Life expectancy and
 maximum lifespan. Journal of internal medicine. 2017;282(2):156-63.

27. Vaupel JW, Carey JR, Christensen K. It's never too late. Science. 2003;301(5640):1679-81.

28. Vogt TC, Kluge FA. Can public spending reduce mortality disparities? Findings from East Germany after
 reunification. Journal of the Economics of Ageing. 2015;5:7-13.

29. Zuo W, Jiang S, Guo Z, Feldman MW, Tuljapurkar S. Advancing front of old-age human survival. PNAS.
 2018;115(44):11209-14.

30. Oeppen J, Vaupel JW. Broken limits to life expectancy. Science. 2002;296(5570):1029-31

31. Ho JY, Hendi AS. Recent trends in life expectancy across high income countries: retrospective observational
 study. BMJ. 2018;362:k2562.

32. Stein EM, Gennuso KP, Ugboaja DC, Remington PL. The Epidemic of Despair Among White Americans: Trends in
 the Leading Causes of Premature Death, 1999–2015. American Journal of Public Health. 2017;107(10):1541-7.

33. Shkolnikov VM, Jdanov DA, Andreev EM, Vaupel JW. Steep increase in best‐practice cohort Life expectancy.
 Population and Development Review. 2011;37(3):419-34.

34. Colchero F, Rau R, Jones OR, Barthold JA, Conde DA, Lenart A, Nemeth L, Scheuerlein A, Schoeley J, Torres C,
 Zarulli V, Altmann J, Brockman DK, Bronikowski AM, Fedigan LM, Pusey AE, Stoinski TS, Strier KB, Baudisch A,
 Alberts SC, Vaupel JW. The emergence of longevous populations. PNAS. 2016;113(48):E7681-E90.

35. van Raalte AA, Sasson I, Martikainen P. The case for monitoring life-span inequality. Science.
 2018;362(6418):1002-4.

36. Vaupel JW, Zhang Z, van Raalte AA. Life expectancy and disparity: an international comparison of life table data.
 BMJ open. 2011;1(1):e000128.

 Copyright © 2020 Society of Actuaries
21

37. Lesser CEV. Variations in mortality and life expectation. Population Studies. 1955;9(1):67-71.

38. Keyfitz N. Introduction to the mathematics of populations. London: Addison-Wesley; 1968.

39. Demetrius L. Demographic parameters and natural selection. PNAS. 1974;71(12):4645-7.

40. Aburto JM, Villavicencio F, Baselini U, Kjærgaard S, Vaupel JW. Dynamics of life expectancy and lifespan
 equality..PNAS. 2020; 117(10):5250-5259

41. Medford A, Vaupel JW. Human lifespan records are not remarkable but their durations are. PLoS One.
 2019;14(3):e0212345.

42. Lenart A, Aburto JM, Stockmarr A, Vaupel JW. The human longevity record may hold for decades. arXiv preprint
 arXiv:180903732. 2018.

43. Gerontology Research Group. Available at http://www.grg.org/.

44. Maier H, Jeune B, Vaupel JW, editors. Exceptional lifespans. Berlin: Springer; 2020.

45. Barbi E, Lagona F, Marsili M, Vaupel JW, Wachter KW. The plateau of human mortality: demography of
 longevity pioneers. Science. 2018;360(6396):1459-61.

46. Bowling A. Commentary: Trends in activity limitation. International journal of epidemiology. 2011;40(4):1068-
 70.

47. Christensen K, Doblhammer G, Rau R, Vaupel JW. Ageing populations: the challenges ahead. The Lancet.
 2009;374(9696):1196-208.

48. Beltrán-Sánchez H, Soneji S, Crimmins EM. Past, present, and future of healthy life expectancy. Cold Spring
 Harbor perspectives in medicine. 2015;5(11):a025957.

49. Stallard E. Update on the LTC morbidity improvement study. Long Term Care News. 2014;36:23-7.

50. Doblhammer G, Kytir J. Compression or expansion of morbidity? Trends in healthy-life expectancy in the elderly
 Austrian population between 1978 and 1998. Social science & medicine. 2001;52(3):385-91.

51. Public Health England. Health profile for England: 2017.2017 September 2, 2019. Available from:
 https://www.gov.uk/government/publications/health-profile-for-england.

52. Manton KG, Stallard E, Tolley HD. Limits to human life expectancy: evidence, prospects, and implications.
 Population and Development Review. 1991:603-37.

53. Torri T, Vaupel JW. Forecasting life expectancy in an international context. International Journal of Forecasting.
 2012;28(2):519-31.

54. Booth H, Tickle L. Mortality modelling and forecasting: A review of methods. Annals of actuarial science.
 2008;3(1-2):3-43.

55. De Grey A, Rae M. Ending aging: the rejuvenation breakthroughs that could reverse human aging in our lifetime.
 London: St. Martin's Press; 2007.

56. Foreman KJ, Marquez N, Dolgert A, Fukutaki K, Fullman N, McGaughey M, Pletcher MA, Smith AE, Tang K, Yuan
 C-W. Forecasting life expectancy, years of life lost, and all-cause and cause-specific mortality for 250 causes of

 Copyright © 2020 Society of Actuaries
22

 death: reference and alternative scenarios for 2016-40 for 195 countries and territories. The Lancet.
 2018;392(10159):2052-90.

57. Omran AR. The epidemiologic transition: a theory of the epidemiology of population change. The Milbank
 Quarterly. 2005;83(4):731-57.

58. Meslé F, Vallin J. Transition sanitaire: tendances et perspectives. Medecine\Science. 2000;16:1161-71.

59. Naran K, Nundalall T, Chetty S, Barth S. Principles of immunotherapy: implications for treatment strategies in
 cancer and infectious diseases. Frontiers in microbiology. 2018;9.

60. Gameiro GR, Sinkunas V, Liguori GR, Auler-Júnior JOC. Precision Medicine: Changing the way we think about
 healthcare. Clinics. 2018;73:e723.

61. Ventola CL. The nanomedicine revolution: part 1: emerging concepts. Pharmacy and Therapeutics.
 2012;37(9):512-25.

62. Ventola CL. The nanomedicine revolution: part 2: current and future clinical applications. Pharmacy and
 Therapeutics. 2012;37(10):582-91.

63. Kennedy BK, Berger SL, Brunet A, Campisi J, Cuervo AM, Epel ES, Franceschi C, Lithgow GJ, Morimoto RI, Pessin
 JE. Geroscience: linking aging to chronic disease. Cell. 2014;159(4):709-13.

64. Olshansky SJ, Passaro DJ, Hershow RC, Layden J, Carnes BA, Brody J, Hayflick L, Butler RN, Allison DB, Ludwig DS.
 A potential decline in life expectancy in the United States in the 21st century. New England Journal of Medicine.
 2005;352(11):1138-45.

65. Alho JM. Stochastic methods in population forecasting. International Journal of forecasting. 1990;6(4):521-30.

66. Wilmoth JR. The future of human longevity: a demographer's perspective. Science. 1998;280(5362):395-7.

67. Lee RD, Carter LR. Modeling and forecasting US mortality. Journal of the American Statistical Association.
 1992;87(419):659-71.

68. Li N, Lee R. Coherent mortality forecasts for a group of populations: an extension of the Lee-Carter method.
 Demography. 2005;42(3):575-94.

69. Booth H, Hyndman RJ, Tickle L, De Jong P. Lee-Carter mortality forecasting: a multi-country comparison of
 variants and extensions. Demographic Research. 2006;15:289-310.

70. Lee R, Miller T. Evaluating the performance of the Lee-Carter method for forecasting mortality. Demography.
 2001;38(4):537-49.

71. Bergeron-Boucher M-P, Canudas-Romo V, Oeppen J, Vaupel JW. Coherent forecasts of mortality with
 compositional data analysis. Demographic Research. 2017;37:527-66.

72. Pascariu MD, Canudas-Romo V, Vaupel JW. The double-gap life expectancy forecasting model. Insurance:
 Mathematics and Economics. 2018;78:339-50.

73. Ševčíková H, Li N, Kantorová V, Gerland P, Raftery AE. Age-specific mortality and fertility rates for probabilistic
 population projections. In: Schoen R, editor. Dynamic demographic analysis: Springer; 2016. p. 285-310.

 Copyright © 2020 Society of Actuaries
23

74. The Board of Trustees. The 2019 annual report of the Board of Trustees of the Federald Old-Age and Survivors
 Insurance and Federal Disability Insurance Trust Funds. Washington, DC: U.S. Social Security Administration;
 2019 April 22.

75. Sweden S. The future population of Sweden 2019-2070. Sweden: Statistics Sweden; 2019.

76. NIPSSR. Population Projections for Japan (2017): 2016 to 2065. Tokyo, Japan: National Institute of Population
 and Social Security Research; 2017.

77. Blanpain N, Buisson G. Projections de population 2013-2070 pour la France: méthode et principaux résultats.
 Paris, France: Institut National de la Statistique et des Études Économiques, Direction des statistiques
 démographiques et sociales, Unité des Études Démographiques et Sociales.; 2018.

78. Stoeldraijer L, van Duin C, van Wissen L, Janssen F. Impact of different mortality forecasting methods and
 explicit assumptions on projected future life expectancy: The case of the Netherlands. Demographic Research.
 2013;29:323-54.

79. Lindahl-Jacobsen R, Rau R, Jeune B, Canudas-Romo V, Lenart A, Christensen K, Vaupel JW. Rise, stagnation, and
 rise of Danish women's life expectancy. PNAS. 2016;113(15):4015-20.

80. Renshaw AE, Haberman S. A cohort-based extension to the Lee–Carter model for mortality reduction factors.
 Insurance: Mathematics and economics. 2006;38(3):556-70.

81. Medford A. Best-practice life expectancy: An extreme value approach. Demographic Research. 2017;36:989-
 1014.

82. Barbi E, Bongaarts JR, Vaupel JW. How long do we live? Demographic models and reflections on tempo effects.
 Berlin: Springer; 2008.

83. Jarner SF, Kryger EM. Modelling adult mortality in small populations: the SAINT model. ASTIN Bulletin.
 2011;41(2):377-418.

84. Wolfson MC. POHEM: a framework for understanding and modelling the health of human populations. World
 health statistics quarterly. 1994;47(3/4):157-76.

85. Raftery AE, Alkema L, Gerland P. Bayesian population projections for the United Nations. Statistical Science.
 2014;29(1):58-68.

86. Canudas-Romo V, DuGoff E, Wu AW, Ahmed S, Anderson G. Life expectancy in 2040: what do clinical experts
 expect? North American Actuarial Journal. 2016;20(3):276-85.

 Copyright © 2020 Society of Actuaries
24

About The Society of Actuaries
With roots dating back to 1889, the Society of Actuaries (SOA) is the world’s largest actuarial professional
organizations with more than 31,000 members. Through research and education, the SOA’s mission is to advance
actuarial knowledge and to enhance the ability of actuaries to provide expert advice and relevant solutions for
financial, business and societal challenges. The SOA’s vision is for actuaries to be the leading professionals in the
measurement and management of risk.

The SOA supports actuaries and advances knowledge through research and education. As part of its work, the SOA
seeks to inform public policy development and public understanding through research. The SOA aspires to be a
trusted source of objective, data-driven research and analysis with an actuarial perspective for its members,
industry, policymakers and the public. This distinct perspective comes from the SOA as an association of actuaries,
who have a rigorous formal education and direct experience as practitioners as they perform applied research. The
SOA also welcomes the opportunity to partner with other organizations in our work where appropriate.

The SOA has a history of working with public policymakers and regulators in developing historical experience studies
and projection techniques as well as individual reports on health care, retirement and other topics. The SOA’s
research is intended to aid the work of policymakers and regulators and follow certain core principles:

Objectivity: The SOA’s research informs and provides analysis that can be relied upon by other individuals or
organizations involved in public policy discussions. The SOA does not take advocacy positions or lobby specific policy
proposals.

Quality: The SOA aspires to the highest ethical and quality standards in all of its research and analysis. Our research
process is overseen by experienced actuaries and nonactuaries from a range of industry sectors and organizations. A
rigorous peer-review process ensures the quality and integrity of our work.

Relevance: The SOA provides timely research on public policy issues. Our research advances actuarial knowledge
while providing critical insights on key policy issues, and thereby provides value to stakeholders and decision
makers.

Quantification: The SOA leverages the diverse skill sets of actuaries to provide research and findings that are driven
by the best available data and methods. Actuaries use detailed modeling to analyze financial risk and provide
distinct insight and quantification. Further, actuarial standards require transparency and the disclosure of the
assumptions and analytic approach underlying the work.

 Society of Actuaries
 475 N. Martingale Road, Suite 600
 Schaumburg, Illinois 60173
 www.SOA.org

 Copyright © 2020 Society of Actuaries
You can also read