Demonstrations of Cooperative Perception: Safety and Robustness in Connected and Automated Vehicle Operations - arXiv.org
←
→
Page content transcription
If your browser does not render page correctly, please read the page content below
Demonstrations of Cooperative Perception: Safety and Robustness in
                                                      Connected and Automated Vehicle Operations

                                         Mao Shan, Karan Narula, Yung Fei Wong, Stewart Worrall, Malik Khan, Paul Alexander and Eduardo Nebot

                                            Abstract— Cooperative perception, or collective perception                 malfunction and failure. Unfortunately, failing to maintain
                                         (CP) is an emerging and promising technology for intelligent                  sufficient awareness of other road users, vulnerable road
                                         transportation systems (ITS). It enables an ITS station (ITS-                 users (VRU) in particular, can cause catastrophic safety
arXiv:2011.08581v2 [cs.RO] 14 Jan 2021

                                         S) to share its local perception information with others by
                                         means of vehicle-to-X (V2X) communication, thereby achieving                  consequences for AVs.
                                         improved efficiency and safety in road transportation. In this                   In recent years, V2X communication has garnered increas-
                                         paper, we present our recent progress on the development                      ing popularity among researchers in the field of intelligent
                                         of a connected and automated vehicle (CAV) and intelligent                    transportation system (ITS) and with automobile manufac-
                                         roadside unit (IRSU). We present three different experiments                  turers, as it enables a vehicle to share essential information
                                         to demonstrate the use of CP service within intelligent in-
                                         frastructure to improve awareness of vulnerable road users                    with other road users in a V2X network. This can be a game
                                         (VRU) and thus safety for CAVs in various traffic scenarios.                  changer for both human operated and autonomous vehicles,
                                         We demonstrate in the experiments that a connected vehicle                    which would be referred to as connected vehicles (CVs)
                                         (CV) can “see” a pedestrian around the corners. More im-                      and connected and automated vehicles (CAVs), respectively.
                                         portantly, we demonstrate how CAVs can autonomously and                       It will also open many doors to new possibilities with
                                         safely interact with walking and running pedestrians, relying
                                         only on the CP information from the IRSU through vehicle-                     peer-to-peer connectivity. The connected agents within the
                                         to-infrastructure (V2I) communication. This is one of the                     cooperative ITS (C-ITS) network will be able to exploit
                                         first demonstrations of urban vehicle automation using only                   the significant benefits that come from sharing information
                                         CP information. We also address in the paper the handling                     amongst the network. For instance, the standardised cooper-
                                         of collective perception messages (CPMs) received from the                    ative awareness messages (CAMs) enable mutual awareness
                                         IRSU, and passing them through a pipeline of CP information
                                         coordinate transformation with uncertainty, multiple road user                between connected agents. Nevertheless, there are other types
                                         tracking, and eventually path planning/decision making within                 of road users such as non-connected vehicles, pedestrians,
                                         the CAV. The experimental results were obtained with manually                 and cyclists that have not been included in the C-ITS services
                                         driven CV, fully autonomous CAV, and an IRSU retrofitted with                 yet. The detection of these non-connected road users in this
                                         vision and laser sensors and a road user tracking system.                     case becomes an important task for road safety.
                                                                  I. I NTRODUCTION                                        The major standardisation organisations such as Euro-
                                                                                                                       pean Telecommunications Standard Institute (ETSI), SAE
                                            Autonomous vehicles (AVs) have received extensive at-
                                                                                                                       and IEEE have made a significant effort to standardise
                                         tention in recent years as a rapidly emerging and disruptive
                                                                                                                       specifications regarding C-ITS services, V2X communication
                                         technology to improve safety and efficiency of current road
                                                                                                                       protocols, and security. This is essential to facilitate the
                                         transportation systems. Most of the existing and under devel-
                                                                                                                       deployment of C-ITS in road transportation network globally.
                                         opment AVs rely on local sensors, such as cameras and lidars,
                                                                                                                       The collective perception (CP) service is among those C-
                                         to perceive the environment and interact with other road
                                                                                                                       ITS services that are currently being standardised by ETSI.
                                         users. Despite significant advances in sensor technology in
                                                                                                                       The CP service enables an ITS station (ITS-S), for instance,
                                         recent years, the perception capability of these local sensors
                                                                                                                       a CAV or an intelligent roadside unit (IRSU) to share its
                                         is ultimately bounded in range and field of view (FOV) due
                                                                                                                       perception information with adjacent ITS-Ss by exchanging
                                         to their physical constraints. Besides, occluding objects in
                                                                                                                       Collective Perception Messages (CPMs) via V2X communi-
                                         urban traffic environments such as buildings, trees, and other
                                                                                                                       cation. The ETSI CPMs convey abstract representations of
                                         road users impose challenges in perception. There are also
                                                                                                                       perceived objects instead of raw sensory data, facilitating
                                         robustness related concerns, for instance, sensor degradation
                                                                                                                       the interoperability between ITS-Ss of different types and
                                         in adverse weather conditions, sensor interference, hardware
                                                                                                                       from different manufactures. A CAV can benefit from the CP
                                            M. Shan, K. Narula, S. Worrall and E. Nebot are with the Australian Cen-   service in terms of improved awareness of surrounding road
                                         tre for Field Robotics, The University of Sydney, NSW 2006, Australia. E-     users, which is essential for ensuring road safety. Specifically,
                                         mails: {mao.shan, karan.narula, stewart.worrall,
                                         eduardo.nebot}@sydney.edu.au                                                  it facilitates a CAV to extend its sensing range and improve
                                           Y.F. Wong, M. Khan and P. Alexander are with Cohda Wireless, 27             sensing quality, redundancy, and robustness through cross-
                                         Greenhill Road, Wayville, SA 5034, Australia. E-mails: {ricky.wong,           platform sensor fusion, i.e., fusing its local sensory data with
                                         malik.khan, paul.alexander}@cohdawireless.com
                                            This research is funded by iMOVE CRC and supported by the Cooper-          other CAVs and IRSUs information. Besides, the improved
                                         ative Research Centres program, an Australian Government initiative.          perception quality as a result of the sensor fusion potentially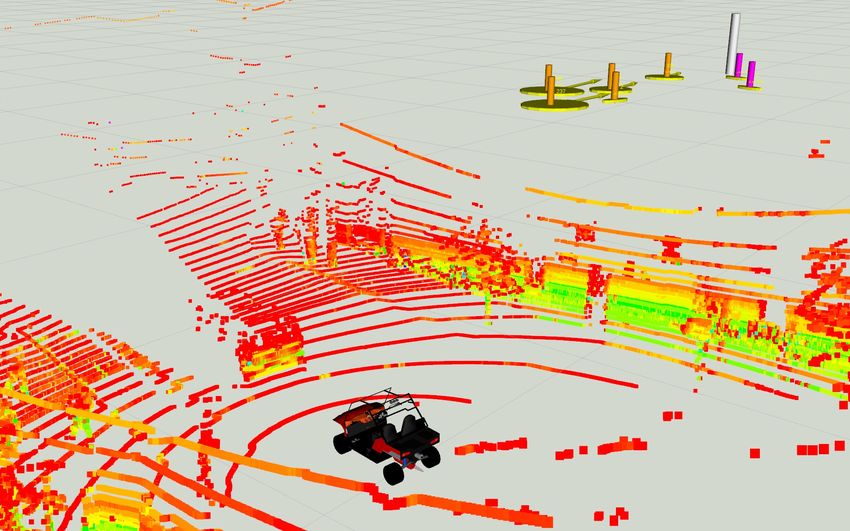
relaxes the accuracy and reliability requirements of onboard        data is often vendor dependent and proprietary, causing
sensors. This could lower per vehicle cost to facilitate the        interoperability issues among communicating ITS-Ss.
massive deployment of CAV technology. As for traditional               More theoretical and experimental work on CP was con-
vehicles, CP also brings an attractive advantage of enabling        ducted as part of the Ko-FAS [8] research initiative. These
perception capability without retrofitting the vehicle with         include [9]–[11] based on the Ko-PER specified Cooperative
perception sensors and the associated processing unit.              Perception Message (CPM). It is a supplementary message
   Over the last two years, we have been working with Cohda         to the standard ETSI ITS G5 CAMs, to support the abstract
Wireless on CP and CAV. We are particularly interested in           description of perceived dynamic and static objects. Exper-
the safety implications the CP service is bringing into the         imental studies are conducted in [9] on the Ko-PER CPM
current and future transportation network, and how the CP           transmission latency and range. In [10], a high level object
service will potentially shape the development of intelligent       fusion framework in CP is proposed, which combines the
vehicles. To this end, we have developed an IRSU and tested         local sensor information with the perception data received
it with the Australian Centre for Field Robotics (ACFR)             from other V2X enabled vehicles or roadside units (RSUs).
CAV platforms in different traffic scenarios. This paper            Reference [11] investigates the inter-vehicle data association
includes three representative experiments to showcase how           and fusion for CP. More recent work in [12] proposes a
a CV and a CAV achieves improved safety and robustness              variant of Ko-PER CPM and analyses the trade-off between
when perceiving and interacting with VRU using the CP               message size as a result of enabling optional data fields in
information from an intelligent infrastructure in different         the CPM and global fusion accuracy.
traffic environments and with different setups.                        Based on the work in [9], reference [13] proposes En-
   The vehicles used are equipped with a suite of local             vironmental Perception Message (EPM) for CP with differ-
perception sensors to implement full autonomy. Nevertheless,        ent information containers specifying sensor characteristics,
the current experiments do not use the internal perception          originating station state, and parameters of perceived objects.
capabilities so as to highlight the benefits of using intelligent   It is also addressed in [13] high level object fusion using the
infrastructure and CP service in the traffic environments. The      perceived information in received EPMs. Both EPM and the
received perception data from IRSU is used as the only or           earlier Ko-PER CPM are a separate message that contains
main source of information for multiple road user tracking          all CP related data elements (DEs) and data frames (DFs),
and path planning within the smart vehicle we tested with.          and has to be transmitted in parallel with an ETSI CAM.
The first experiment was conducted on a public road in an           There is also work towards extended CAM. For instance,
urban traffic environment and the CV was able to “see” a            Cooperative Sensing Message (CSM) from AutoNet2030
visually obstructed pedestrian before making a turn to an           [14]–[16] extends CAM specifications to include description
alleyway. It is demonstrated in the next two experiments a          of objects perceived by local or remote sensors. Following a
CAV navigated autonomously and safely when interacting              similar concept of CP, Proxy CAM is presented in [17]–[19],
with walking and running pedestrians in proximity in a              where intelligent infrastructure generates standard CAMs for
simulated and real lab traffic environments, respectively.          those perceived road users, while the work in [20] proposes
Lastly, the paper also addresses the coordinate transformation      a CPM comprised of a collection of CAMs, each describing
of perception information considering the respective uncer-         a perceived object. The work in [21] and [22] evaluates
tainties, and analyses the influence of ITS-S self-localisation     different EPM dissemination variants under low and high
accuracy through numerical simulations.                             traffic densities and proposes to attach the CP relevant DFs
   The remainder of the paper is organised as follows.              in EPM to CAM to minimise communication overhead. The
Section II will focus on the related work on CP and its             CPM currently being specified at ETSI, as in [23], is derived
use cases for CAV. Section III presents the IRSU and CAV            from optimising the EPM and combining it with CAM. It is
platforms developed and used in the experiments, and the            therefore more self-contained, no longer dependent on the
cross-platform perception information transformation with           reception of CAMs.
uncertainty is addressed in Section IV. The results from the           Similarly, there are early stage standardisation activities in
three experiments are presented in Section V, followed by           SAE advanced application technical committee to standard-
conclusions drawn in Section VI.                                    ise messages and protocols for sensor data sharing in SAE
                                                                    J3224 [24]. These messages and protocols are not yet defined
                     II. R ELATED W ORK                             and are thus not considered in this work.
                                                                       Considering the limited communication bandwidth and
   The concept of CP has been extensively studied in the            avoiding congestion in the wireless channel, more recent
ITS research community over the last two decades. Initial CP        studies in the CP area tend to focus on the communication
related work proposes to share raw sensory data between two         aspect of the technology, weighing up provided CP service
mobile agents, such as images [1], lidar point clouds [2], both     quality and the V2X network resources. The work in [25]
combined [3]–[5], location and relative range measurements          investigates ETSI CPM generation rules that balance pro-
[6], [7]. Those approaches however tend to require pro-             vided service quality and the V2X channel load. Reference
hibitively high bandwidth for existing V2X communication            [26] provides an in-depth study on the impact of different
technologies in a dense environment. Besides, raw sensor            CPM generation rules from the perspectives of V2X com-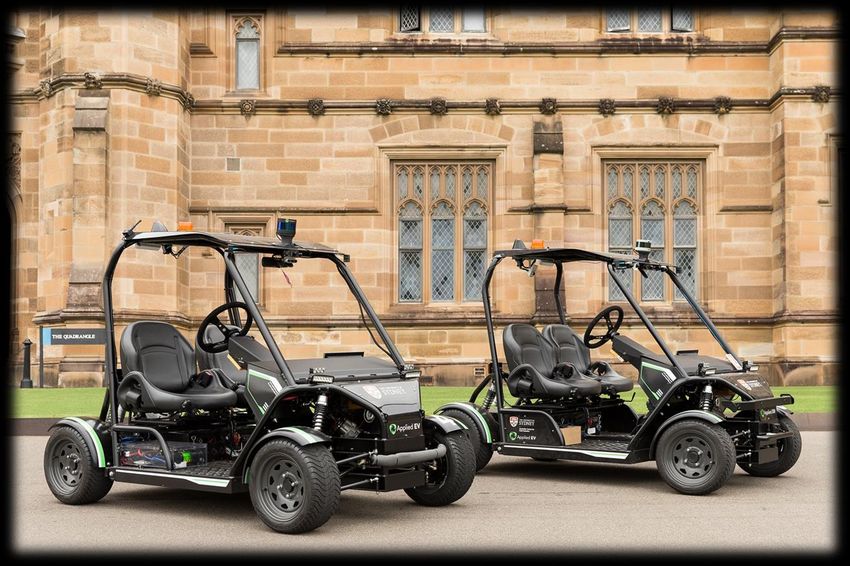
munication performance and perception capabilities in low        environments. For instance, the work in [27], [28] is carried
and high density traffic scenarios. The authors of [27] raise    out in an open source microscopic road traffic simulation
the concern of redundant data sharing in V2V based CP            package SUMO (Simulation of Urban Mobility) [48]. An-
with the increase of CAV penetration rate. To tackle the         other commonly used network and mobility simulator is
redundant transmission issue, a probabilistic data selection     Veins (Vehicles in Network Simulation) [49], [50], which
approach is presented in [28]. Reference [29] proposes           integrates SUMO and a discrete-event simulator OMNeT++
an adaptive CPM generation rule considering change in            (Open Modular Network Testbed in C++) [51] for modelling
perceived object’s state, and the authors of [30] propose        realistic communication patterns. The authors of [21], [22],
to employ object filtering schemes in CPM, to improve            [25], [30], [32], [52] conduct work in Artery [53], [54]
communication performance while minimising the detriment         framework, which wraps SUMO and OMNet++, and enables
to perception quality. Similarly, the work in [31] presents      V2X simulations based on ETSI ITS G5 protocol stack.
a deep reinforcement learning based approach that a vehicle      There are also simulators for advanced driving assistance
can employ when selecting data to transmit in CP to alleviate    systems (ADASs) and autonomous driving systems, which
communication congestion.                                        provide more realistic sensory level perception information.
   There is also work conducted to explore the use cases,        In recent years, they start to show their potential in testing
benefits, and challenges of CP. Reference [32] provides early    and validating CP with CAVs. For instance, Pro-SiVIC is
study of CP illustrating its potential in terms of improved      employed in [43] for CP related simulations, and CARLA
vehicle awareness and extended perception range and field        [55], [56] is combined with SUMO in a simulation platform
of view. The work presented in [13] evaluates EPM for            developed for CP in [31].
obstacle avoidance of two manually driven CAVs, showing
                                                                                       III. P LATFORMS
that the CP helps gain extra reaction time for the vehicles
to avoid obstacles. Reference [27] analyses the performance      A. Intelligent Roadside Unit
gain in extending horizon of CAVs by leveraging V2V based           The IRSU developed comprises of a sensor head, a pro-
CP. The work in [33] and [34] analytically evaluates the         cessing workstation, and a Cohda Wireless MK5 RSU. The
enhancement of environmental perception for CVs at dif-          sensor head is mounted on a tripod for easy deployment
ferent CP service penetration rates and with different traffic   in different testing environments, as shown in Figure 1.
densities. The authors of [35] discuss the security threats in   Specifically, the two Pointgrey Blackfly BFLY-PGE-23S6C-
CP and propose possible countermeasures in V2X network           C cameras are mounted with an angle separation of 45◦ . The
protocols, while the work in [36] focuses on using CP for        camera with its lens Fujinon CF12.5HA-1 has a horizontal
detecting vehicle misbehaviour due to adversarial attacks in     field-of-view (FOV) of about 54◦ , and a vertical FOV of
V2X communication. Most of CP related use cases studied          42◦ . The setup of dual cameras achieves a combined FOV of
in the literature are safety related, including cooperative      approximately 100◦ , and the FOV can be further augmented
driving [5], [16], cooperative advisory warnings [37], [38],     by adding more cameras to the sensor head. A 16-beam
cooperative collision avoidance [4], [13], [39], intersection    lidar is also installed to the sensor head. The workstation
assistance [17], [40], and vehicle misbehaviour detection        has AMD Ryzen Threadripper 2950X CPU, 32GB memory,
[41], to name a few. It is presented in [42] quantitative        RTX2080Ti GPU, running Robot Operation System (ROS)
comparison of V2V and V2I connectivity on improving              Melodic on Ubuntu 18.04.2 long-term support (LTS).
sensing redundancy and collaborative sensing coverage for           In terms of information processing, the workstation first
CAV applications. The work concludes that infrastructure         processes the sensory data of images and lidar point clouds
support is crucial for safety related services such as CP,       for pedestrian and vehicle detection. Specifically, the raw
especially when the penetration rate of sensing vehicles is      images from cameras are first rectified using camera intrin-
low. The authors of [17] demonstrate improved awareness          sic calibration parameters. As illustrated in Figure 2, the
of approaching vehicles at an intersection using the CP          road users within the images are classified/detected using
information from an IRSU. The CP in the work is achieved         YOLOv3 that runs on GPU. At the same time the lidar
through Proxy CAM. Reference [43] compares CAM and               point clouds are projected to the image coordinate system
CPM and demonstrates IRSU assisted augmented perception          with proper extrinsic sensor calibration parameters. The lidar
through simulations. Recent work in [44] demonstrates the        points are then segmented, clustered and labelled by fusing
IRSU assisted CP for extending perception of CAVs on open        the visual classifier results (in the form of bounding boxes
roads. Infrastructure-assisted CP is also part of the scope of   in the image) and the projected lidar points.
Managing Automated Vehicles Enhances Network (MAVEN)                The detection results are then encoded into ETSI CPMs
[45], an EU funded project targeting traffic management          and broadcast by Cohda MK5 at 10 Hz. Details are avail-
solutions where CAVs are guided at signalised cooperative        able in Section III-C. We tested the working range of the
intersections in urban traffic environments [40]. Other CP       developed IRSU for detecting common road users, such
related joint research projects include TransAID [46] and        as pedestrians and vehicles. The maximum detection range
IMAGinE [47].                                                    is approximately 20 m for pedestrians and 40 m for cars.
   A significant proportion of the existing work conducts        Also in the IRSU, a variant of Gaussian mixture probability
the analyses of V2X communication and CP in simulated            hypothesis density (GMPHD) filter [57] is employed to track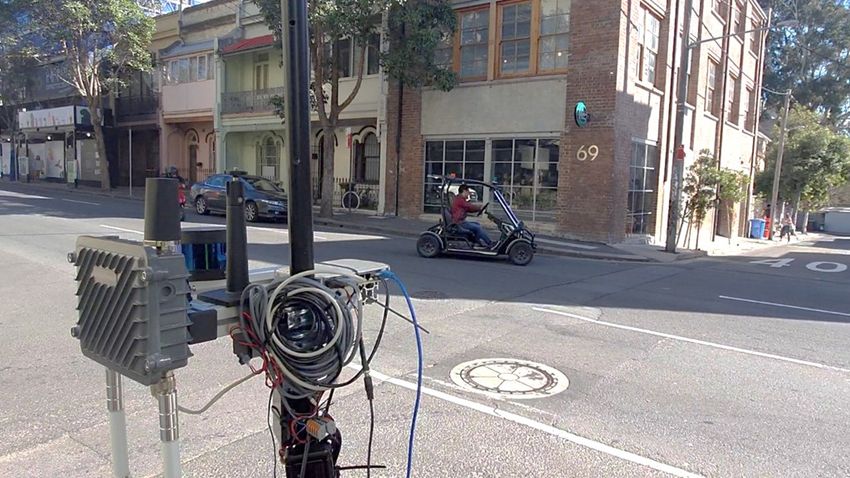
Fig. 1: The developed IRSU is equipped with multiple sensors including dual cameras and a 16-beam lidar. The sensors sit
on a tripod for easy deployment in the field.

                   Raw Point Cloud          Lidar-to-Camera                                    Clustering
                                                                      Extraction
                                               Projection

                                                                                             Point Clusters

                                             YOLO Object                                       Instance
                    Image Frame              Classification                                   Association

                                                                                         Labelled Point Clusters

                                  Fig. 2: The sensory data processing pipeline within the IRSU.

multiple road users and has its tracking results visualised       truth points. The root mean squared error (RMSE) in position
           The University of Sydney                                                                            Page 2
in real time within the workstation. The same tracking            is calculated by comparing the ground truth positions and
algorithm is also employed on the CAV side. Details would         the corresponding estimates from the tracker. As the two
be given in Section III-B.                                        sources of positions were obtained at different rates (10 Hz
   To assess the position tracking accuracy of the IRSU, an       from the tracker versus 1 Hz from RTK), each RTK reading
outdoor test was conducted at the Shepherd Street car park at     is compared with the position estimate that has the nearest
the University of Sydney. Figure 3 illustrates the setup of the   timestamp. It can be seen from Figure 4c that the distance
test at the car park, where a pedestrian was walking in front     of the target pedestrian to the IRSU varies from 5 to 22
of the IRSU for approximately one minute. The ground truth        metres, and the position RMSE values remain less than 0.4
positions of the target pedestrian were obtained at 1 Hz by       m throughout the test.
an u-blox C94-M8P RTK receiver, which reports a standard
deviation of 1.4 cm of positioning when in the RTK fixed          B. Connected and Automated Vehicle
mode.                                                                Figure 5 presents an overview of hardware configuration
   As presented in Figure 4, the trajectory of the target         of the CAV platform built by the ACFR ITS group. Images
reported by the local tracker is found close to the ground        are captured onboard at 30 FPS by an NVIDIA Drive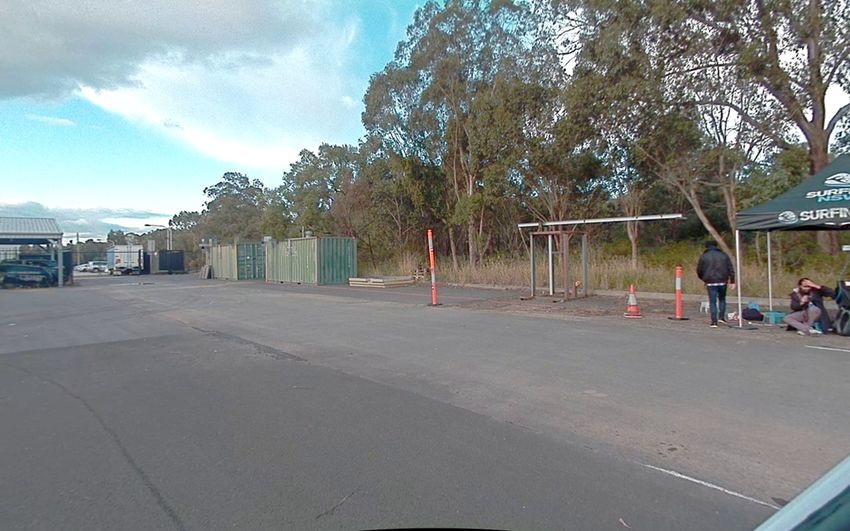
(a)                                                            (b)

                                                                              (c)

Fig. 3: Pedestrian tracking setup for the IRSU. (a) shows the detection of the target pedestrian within a camera image using
YOLOv3. The lidar points are projected to the image frame with extrinsic calibration parameters. The projected points in (b)
are colour coded based on their range to the sensor in 3D space. Those bold points indicate those hitting the ground plane.
(c) demonstrates the tracking of the pedestrian in 3D space. The RTK antenna was hidden within the cap of the pedestrian
to log GNSS positions as the ground truth.

                                                                                                         25
                                 0
                                                                                                         20
                                            Roadside unit position
                                                                                             Range (m)

                                            Tracking position                                            15
                                            RTK position
                                                                                                         10
                                 -5
                                                                                                          5
                 Northing (m)

                                                                                                          0
                                                                                                              0    10         20         30   40   50   60
                                                                                                                                   Time (s)
                                -10
                                                                                                                                   (b)

                                                                                                         0.4
                                -15
                                                                                             RMSE (m)

                                                                                                         0.3

                                                                                                         0.2
                                -20
                                      -15          -10               -5   0    5                         0.1
                                                                                                               0   10         20         30   40   50   60
                                                           Easting (m)                                                             Time (s)

                                                               (a)                                                                 (c)

Fig. 4: Pedestrian tracking results for the IRSU. It can be seen in (a) that when the target pedestrian was walking in a figure
eight pattern in front of the IRSU the tracked positions are found to be well aligned with the ground truth path obtained
from a RTK receiver.

PX2 automotive computer with six gigabit multimedia serial                          local coordinate system of the platform, using the automatic
link (GMSL) cameras with 1080p resolution and a 100◦                                extrinsic calibration toolkit presented in [58]. Besides, the
horizontal FOV each. They are arranged to cover a 360◦                              vehicle has a GNSS receiver, a 6 degrees of freedom IMU,
horizontal FOV around the vehicle. The vehicle also has a                           and four wheel encoders for odometry and localisation. The
32-beam scanning lidar with 30◦ vertical FOV and 360◦                               onboard Intel next unit of computing (NUC) has 32 GB of
horizontal FOV for scanning the surrounding at 10 Hz.                               memory and a quad-core Intel i7-6670HQ processor, serving
Both the cameras and the lidar have been calibrated to the                          as the main processing computer within the CAV. The NUC
32-Beam Laser                        Cohda Wireless     V2X DSRC             GPS
                     Rangefinder                          MK5 OBU            Antenna            Antenna

                                                                                                          Intel RealSense
                                                                                                          RGB-D Camera

                   GMSL Cameras

                                                                                                           Ultrasonic
                                                                                                            Sensors

                         IMU +
                         Wheel
                        Encoders

                                                        Intel NUC                    PLC          Nvidia Drive PX 2
                      The University of Sydney                                                                   Page 1
                                                 Fig. 5: The CAV platform and onboard sensors.

is running ROS Melodic on Ubuntu 18.04.2 LTS. Last but                    the joint distribution of the group of tracked targets. The
not least, the CAV platform has been retrofitted with Cohda               GMPHD approach is considered attractive due to its inherent
Wireless MK5 OBU to enable the V2X communication                          convenience in handling track initiation, track termination,
capability. Please refer to [59] for more details on the CAV              probabilistic data association, and clutter. Compared with the
platform and the USyd Campus data set collected using the                 naive GMPHD algorithm, the road user tracker running in
platform.                                                                 both the IRSU and CAV is improved with measurement-
   The vehicle did not use any of the retrofitted perception              driven initiation of new tracks, and track identity manage-
sensors for road user detection in the simulation or in                   ment. Also note that an instance of the tracker is required
experiments presented in the paper. The multiple cameras                  for each type of road users, which effectively reduces the
were used for video recording purpose, and the multibeam                  overall computational cost.
lidar was enabled only for aiding self-localisation within                   The navigation subsystem in the CAV is responsible for
the map. Lidar feature maps of the experiment sites were                  path planning, monitoring and controlling the motion of the
built using a simultaneous localisation and mapping (SLAM)                vehicle from the current position to the goal. A hybrid A*
algorithm. The maps are based on pole and building corner                 path planner presented in our recent work [61] is running
features extracted from lidar point clouds, which are essential           within the CAV to plan a path navigating around obstacles
for localisation since GNSS cannot provide the desired level              and the tracked pedestrians. It maintains a moving grid-
of accuracy in the experiment environments. Interested reader             based local cost map that considers 1) structural constraints,
can refer to [60] for more information. In the meantime,                  such as road and lane boundaries, present in the Lanelet2
a Lanelet2 map is built for every experiment site, which                  map, 2) obstacles picked up by local perception sensors, and
includes road network, lane layout and traffic rules such as              3) current and future estimates of road users detected and
speed limits, traffic lights and right-of-way rules.                      broadcast by IRSU through V2I communication, such that it
                                                                          can plan a smooth, safe, and kinematically feasible path to
   When the CAV receives an ETSI CPM through the on-
                                                                          avoid collision with any other road users the CAV becomes
board Cohda Wireless MK5 OBU, the received perceived
                                                                          aware of. In the experiments presented in the paper, the use of
objects information is first decoded from binary ASN.1
                                                                          local perception information in the navigation was minimised
encoding, and transformed with its uncertainty to the local
                                                                          or disabled.
frame of reference of the CAV, as presented in Section IV,
which also takes into account the estimated egocentric pose               C. Handling of ETSI CPMs on IRSU and CAV platforms
of the CAV in self-localisation.                                            The overall system diagram of the IRSU and the CAV
   Following the coordinate transformation with uncertainty,              in a C-ITS configuration is illustrated in Figure 6. The
the perceived objects information from the IRSU are fused                 detected road user descriptions are encoded to ETSI CPMs
into a multiple road user tracking algorithm that is a variant            and transmitted from the IRSU to the CAV through the
of GMPHD filter running within the local frame of the                     Cohda MK5s at 10 Hz. Each ETSI CPM consists of an
receiving CAV. The tracked states of road users include their             ITS PDU header and five types of information containers
position, heading, and speed. The general formulation of the              accommodating mandatory and optional DEs and DFs. These
GMPHD tracker is to use Gaussian mixture to represent                     containers are:
Intelligent Roadside Unit                                                                               Connected Autonom ous Vehicle

                                                                                           GNSS + Lidar +
                                                 Sur veyed
                    Lidar + Cam er as                                                       IM U + W heel                Self-Localisation
                                                  Position
                                                                                              Encoder s

                                                                                               CPM           Tr ansfor m ation       Hybr id A* Path           Lanelet2
                  Road User s Detection        CPM Publisher            ETSI CPM s
                                                                                            Subscr iber      to Local Fr am e           Planner                  M ap

                                                                                                               Road User s              Kinem atic
                  Road User s Tr acking
                                                                                                                Tr acking               Contr oller

                         Fig. 6: System diagram of the IRSU and the CAV platforms in the experiments.

                                                               Intelligent Roadside Unit                                         Connected Autonom ous Vehicle

                                                                                             ETSI
                                                                                             CPM s

                                                                                                                                                  Autonom ous
                 Sensor Head              Wor kstation                Cohda M K5 RSU                        Cohda M K5 OBU                          Vehicle

Fig. 7: Perception information flow from the IRSU to the CAV. The IRSU broadcasts perceived objects information in
the form of ETSI CPMs through Cohda Wireless MK5 RSU. As the receiving agent, the CAV has V2X communication
capability through Cohda Wireless MK5 OBU.

   1) A CPM Management Container, which indicates sta-                                 of the perception information within the system is mostly
       tion type, such as a vehicle or an IRSU, and reference                          carried out in ROS realm. The ROS Kinetic is installed in
       position of the transmitting ITS-S.                                             both Cohda MK5s, with the workstation/NUC set as the
   2) An optional Station Data Container, which provides                               ROS master to the transmitting/receiving MK5, respectively.
       additional information about the originating station.                           The perceived road users on the workstation side are first
       This includes the heading, speed, and dimensions when                           described in the form of a ROS CPM, which is used
       the originating station is a vehicle.                                           internally within the ROS system and brings convenience of
   3) Optional Sensor Information Containers, which de-                                message handling and diagnostics in ROS. Each ROS CPM
       scribe the type and specifications of the equipped                              is a self-contained message that contains all information
       sensors of the transmitting ITS-S, including sensor IDs,                        required for an ETSI CPM. It is the ETSI CPM that is
       types, and detection areas.                                                     eventually transmitted in the V2X communication.
   4) Optional Perceived Object Containers, each of which                                 A ROS msg_bridge node running within each MK5 serves
       describes the dynamics and properties of a perceived                            as a bridge between ROS CPMs and ETSI CPMs. It pop-
       object, such as type, position, speed, heading, and                             ulates an ETSI CPM given information from a ROS CPM
       dimensions. These perceived object descriptions are                             and based on the ASN.1 definition of the ETSI CPM. In
       registered in the coordinate system of the originating                          the meantime, it decodes an ETSI CPM received from other
       station.                                                                        ITS-Ss back into the ROS CPM format. The transmission and
   5) Optional Free Space Addendum Containers, which                                   reception of ETSI CPM payload is handled by Cohda’s V2X
       describe different confidence levels for certain areas                          stack in MK5. We keep upgrading the ROS msg_bridge node
       within the sensor detection areas.                                              to support the features required in the CP demonstrations in
   The CPM generation rules support different abstraction                              accordance with the status quo of ETSI CPM standardisation.
levels for perceived object descriptions for the implementa-
tion flexibility, which can derive from low-level detections                               IV. C OORDINATE T RANSFORMATION OF P ERCEIVED
made by individual sensors, or the results of the high-level                                         O BJECTS WITH U NCERTAINTY
data fusion. In the developed IRSU, the road user detections                              The perceived objects information broadcast through CP
as a result of camera-lidar fusion are considered in the                               service is produced from the perspective of the sensing ITS-
encoding of CPMs, as depicted in Figure 6.                                             S. When a piece of perceived object information is received,
   The overall perception information flow from the IRSU                               it is not usable to the receiving agent until it is transformed
to CAV is illustrated in Figure 7. Specifically, the handling                          into its local coordinate system. In [13], the coordinate trans-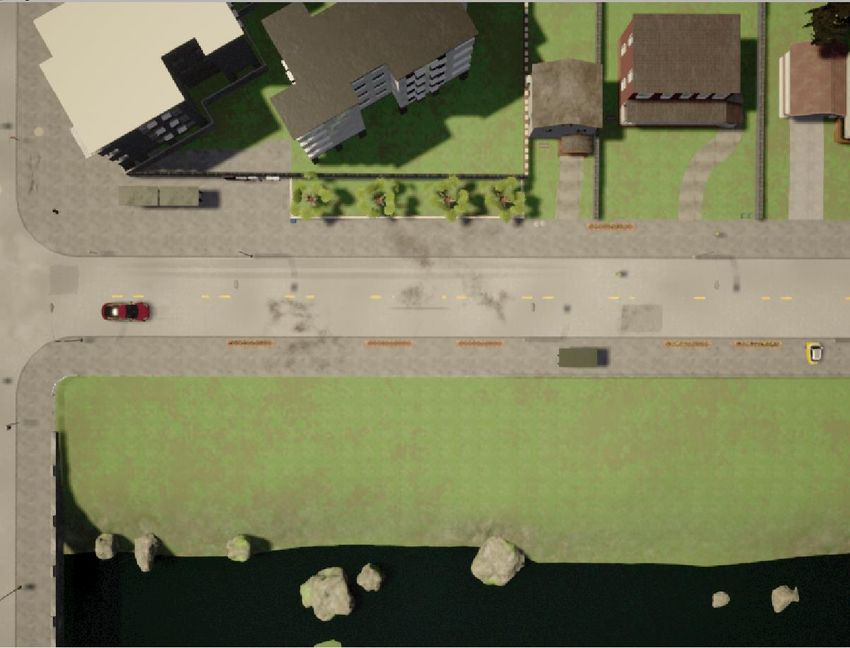
G                                     R

Fig. 8: Coordinate transformation of perception information with uncertainty considered from the sensing ITS-S S to the
receiving ITS-S R.
                                                                              S

formation of perceived objects does not explicitly incorporate         approach, the uncertainty magnitude in the localisation
the accuracy fields accompanied with DEs in the EPMs. We               can vary significantly depending on certain external
stress that uncertainty bounds associated with the perception          conditions, such as GNSS satellite visibility in the
information are indispensable in successive data fusion and            sky, and the quantity of observable features and their
thus have to be considered. Besides, it is essential for the           qualities in the surroundings. The location of an IRSU,
coordinate transformation to also incorporate the uncertainty          although deployed static in a traffic environment, is
contained in the pose estimation of both ITS-Ss. These are             not immune from localisation error either when set
discussed in detail as follows.                                        either by GNSS or through a surveying process. The
                                                                       localisation uncertainties of both sensing and receiv-
  1) Perception uncertainty in the sensing ITS-S. Every                ing ITS-Ss therefore have to be considered in the
     commonly used perception sensor in ITS area has                   perceived objects coordinate transformation since it
     its own strengths and limitation. For instance, RGB               cannot be completely eliminated regardless of the self-
     images are useful in detecting object instances and               localisation means employed. The originating ITS-S
     classification of road users with an estimated confi-             information including its pose with associated uncer-
     dence level using a visual classifier algorithm. Doppler          tainty has been contained within the CPM Management
     RADARs produce both position and velocity measure-                Container and Station Data Container in the CPM
     ments but are prone to noise and interference from the            definition.
     environment. Lidars have a high range resolution to
     observe physical extent and shape of objects. Never-
     theless, the point density decreases dramatically along        Consequently, the transformed object state estimates con-
     with range. These sensors all produce measurements          tain uncertainty that is mainly a combined result of uncer-
     corrupted by noise, and thus should be modelled with        tainty in the localisation of both ITS-Ss and that in the
     uncertainty. Combining multi-modal sensory informa-         sensory perception. As illustrated in Figure 8, both sensing
     tion not only improves robustness of the perception         and receiving ITS-Ss contain uncertainties in their estimated
     system, but also increases accuracy, which means a          egocentric states within the global frame G. The sensing
     lower level of uncertainty. The produced estimates          ITS-S S observes multiple road users within its local frame
     of perceived objects with uncertainty have been rep-        with some level of sensory measurement uncertainty labelled
     resented in Perceived Object Container of the CPM           with purple dashed lines. The road users measurement un-
     specification.                                              certainties grow when transformed to a global frame G due
  2) Self-localisation uncertainty of sensing and receiving      to self-localisation uncertainty of ITS-S S, as labelled with
     ITS-Ss. A vehicle ITS-S has to constantly localise itself   gray dotted lines. The road users measurement uncertainties
     within a global frame of reference such as map or UTM       further grow, as labelled by orange solid lines, when trans-
     frame for navigation and safety reasons. However,           formed to the local frame of the receiving ITS-S R as its
     accurate self-localisation for a moving platform is         self-localisation uncertainty is also incorporated.
     known to be one of the existing challenges in ITS
     applications such as urban navigation. Using GNSS as           Both the work in [10] and [62] performs the coordinate
     the only source for localisation often cannot achieve       transformation of perceived object states with their uncer-
     satisfactory accuracy, in particular in GNSS-degraded       tainty through temporal and spatial alignment. The temporal
     or even GNSS-denied environments. There are various         alignment is introduced in the work mainly due to the time
     existing solutions that can provide higher localisation     difference between the reception of a CAM and a Ko-PER
     accuracy such as RTK, GNSS and inertial/encoder data        CPM. It is however less of a concern for an ETSI CPM,
     fusion, feature based localisation based on existing        which now can contain the originating station information
     map, etc. Nevertheless, even with the same localisation     required from a CAM.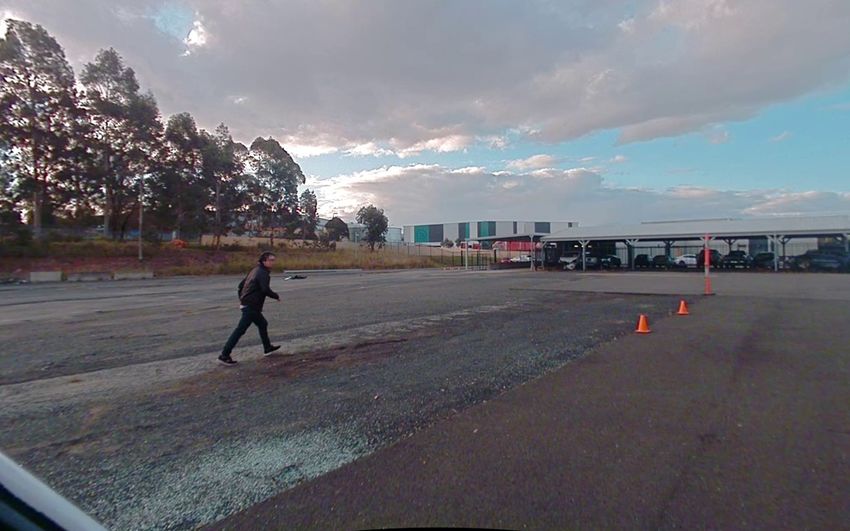
A. Problem Formulation still applicable to an IRSU due to the presence of uncertainty
This section presents mathematical formulation of the in the surveying process.
coordinate transformation of perceived objects information a The state vector of a perceived object p at time t is
recipient ITS-S receives from a sensing ITS-S. We propose represented from the sensing ITS-S’s perspective as
to use unscented transform (UT) in the coordinate transfor- T
xt = Sxpt Sytp Sθtp ∼ N Sx̄pt , SΣpt ,
S p
(4)
mation with uncertainty, which here is recognised as a non-
linear and non-deterministic process. The formulation pre- where Sxpt and Sytp are object coordinates and Sθtp is heading
sented is intended for 2D transformation, as it is reasonable within the sensing ITS-S’s local frame at time t.
to assume a planar road surface for the road user detection We obtain the transformed state of perceived object p with
and tracking problem discussed in the paper. Nevertheless, respect to {R} by
the formulation can be easily extended to transformation in R p G S S p
xt = trans GxR
3D space. It is important to note that although the paper t , xt , xt . (5)
is mainly focused on CP service provided by intelligent Specifically, in trans (·), we have
infrastructure, the formulation presented here is intended R p S p
to provide a generic form for two arbitrary ITS-Ss in a xt xt
p −1
Ryt = T GxR T GxSt Sytp
V2X network, which includes both V2V and V2I scenarios. t
Before proceeding further, some definitions about coordinate 1 1 , (6)
R p S p
systems are first given to facilitate discussions. θt = + GθtS − GθtR
θt
The global frame, which is the fixed coordinate system
cos θ − sin θ x
attached on the ground, is represented as {G} = {→ −
x G, →
−y G }. T
where T x y θ = sin θ cos θ y is the ho-
Local frame of the sensing ITS-S S is attached on the
0 0 1
platform body and is represented as {S} = {→ −x S, →
−
y S }, mogeneous transformation matrix.
→
−
with x S pointing to the east direction if it is an IRSU Given a Gaussian representation of perceived object state
and pointing towards its moving direction for a vehicle. pdf in the form of mean vector x̄ and covariance matrix Σ
Local frame of the recipient ITS-S R is attached on the with respect to {S}, the nonlinear transformation to receiving
platform body and moving with the platform. It is denoted ITS-S’s frame {R} with uncertainty is achieved through the
as {R} = {→ −x R, →
−y R } with →
−
x R pointing towards its moving UT process.
direction. An augmented state vector is constructed by concatenating
The pre-superscript is employed to describe the coordinate the state vector of the receiving and sensing ITS-Ss and that
frame in which the corresponding variable is expressed. of the perceived object p before transformation. Its Gaussian
For instance, V xpt denotes the position of an object p in x estimate is written as
direction with respect to {V } at time t. A variable without
pre-superscript is defined in a generic way to not specify a
xat ∼ N (x̄at , Σat ) , (7)
particular coordinate frame.
The state of the receiving ITS-S R at time t and its
h
G R T G S T S p T
T
i
where x̄at = , and Σat =
x̄t x̄t x̄t
estimate are denoted as G S S p
blkdiag GΣR t , Σt , Σt .
G R
T 2d
xt = GxR G R
yt GθtR , A collection of sigma points {X i , wim , wic }i=0 are ob-
t (1)
tained based on the augmented state estimate prior to the
where GxR G R G R
t , yt , and θt denote 2D coordinates and the transformation:
heading, respectively, in {G} at time t. The state estimate is
represented by a multivariate Gaussian as
X 0 = x̄at
G R
xt ∼ N Gx̄R G R
p
t , Σt , (2) X i = x̄at + (d + λ) Σat for i = 1, · · · , d
i
where Gx̄R G R
t and Σt denote the mean vector and covariance
p
X i = x̄at − (d + λ) Σat for i = d + 1, · · · , 2d
matrix, respectively. i
Likewise, the estimated pose of the perceiving ITS-S S at λ , (8)
w0m =
time t is too represented as a Gaussian variable: d+λ
λ
w0c = + 1 − α2 + β
T
G S
xt = GxSt GytS GθtS ∼ N Gx̄St , GΣSt ,
(3) d+λ
1
where GxSt and GytS are the location of S, GθtI is its heading wim = wic = for i = 1, · · · , 2d
2 (d + λ)
with respect to {G} at time t, Gx̄St and GΣSt denote the mean
vector and covariance matrix, respectively. In the special case where λ = α2 (d + κ) − d, d = dim (x) is the dimension of
of an IRSU serving as the perceiving ITS-S, the subscription state x, scaling parameters κ ≥ 0, αp
∈ (0, 1], and β = 2 is
t in (3) can be dropped as GxSt and GytS are time invariant and optimal for Gaussian distributions, Σat p
i
is to obtain the
G S
θt is towards due east for an IRSU. Nevertheless, GΣSt is th
i column of the matrix square root R = Σat , which can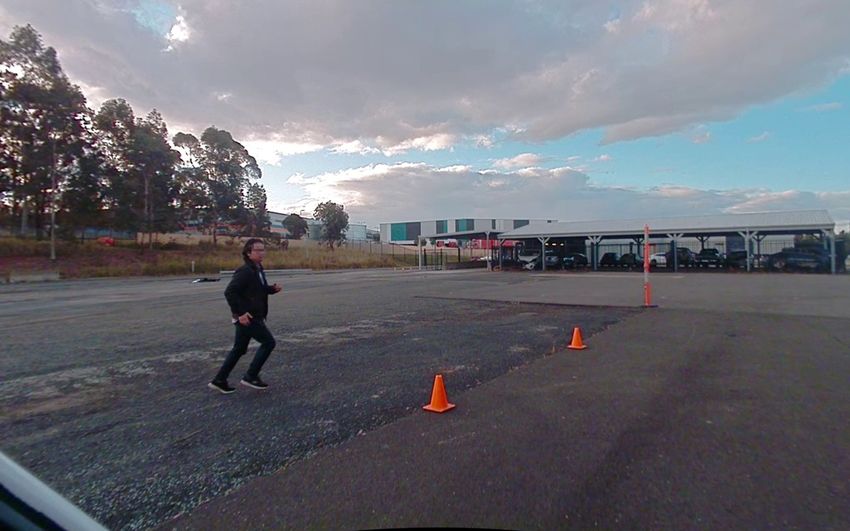
Sensing
                                                                                    ITS-S

                                                                                                                    Per ceived
                                                                                                                     objects

                                                 Receiving
                                                 ITS-S
                                                                            M oving dir ection

                             m ap

                                     Fig. 9: Setup of the sensing and receiving ITS-Ss in the simulation.

Fig. 10: Perceived objects within the local frame of the sensing ITS-S. The objects are a mixture of static pedestrians and
vehicles that are placed in a line along with the x direction of the sensing ITS-S. They are perceived with the same location
and heading uncertainties in the simulation. The 95% confidence ellipse for the 2D position estimate of each perceived
object is shown in yellow. Each grid in every figure represents an area of 10 × 10m.

                                                             TABLE I: Simulation Parameters.
                                                                           Standard Deviation in State Estimate
                                                                           Position                         Heading
                              Perceived Objects                             0.5m                                  6◦
                                             IRSU                          0.005m
                           Sensing ITS-S
                                             CAV                                Same to Receiving CAV
                                            Test 1                        0.25m                  0.05◦ , 0.5◦ , 1.0◦ , 1.5◦ , 2.0◦
                           Receiving CAV
                                            Test 2           0.005m, 0.25m, 0.5m, 0.75m, 1.0m                  0.5◦

be computed by Cholesky decomposition such that we have                               illustrated in Figure 9, the simulation is setup with two ITS-
Σat = RRT . Note that each sigma point can be decomposed                              Ss acting as a publishing/sensing ITS-S and a receiving ITS-
in accordance
      h         with the concatenation
                                   i   sequence in (7), i.e.,                         S of CPMs. The sensing ITS-S is static at a position of
Xi = XiR T
                       T        T
                           (Xip ) .                                                   (100m, 100m) on the map, facing the east direction. It is

                   XiS
   This is followed by passing each sigma point through the                           perceiving road users within its local frame with some level
frame transformation function trans (·) in (5), which yields                          of uncertainty in its sensory measurements. The receiving
a set of transformed sigma points. For i = 0, 1, · · · , 2d,                          ITS-S in the simulation is a CAV moving at 2m/s from its
                                                                                      initial position at (0m, 75m) with the same heading of the
                 Y i = trans XiR , XiS , Xip .                                        sensing ITS-S, which can be either an IRSU (V2I case) or

                                                                            (9)
                                                                                      another CAV (V2V case). Both V2V and V2I scenarios are
   Lastly, the transformed state of perceived object p in {R}                         considered in the simulation for a comparison. Both ITS-Ss
is recovered by                                                                       are assumed to contain uncertainty in their self-localisation.
                     2d
                     X                                                                   Within the sensing ITS-S, the perceived objects informa-
          R p
           x̄t   =         wim Y i                                                    tion and egocentric pose estimate are encoded into CPMs
                     i=0                                                              in the form of binary payloads and published at 10 Hz.
                     2d
                                                                  .       (10)
                     X
                                                         R p T
                                                                                      The receiving CAV, as it moves on the map, decodes the
         R
           Σpt             wic          R p

                 =               Yi −    x̄t     Yi −     x̄t                         CPMs received and transforms the perceived objects into its
                     i=0
                                                                                      local coordinate system. Through coordinate transformation,
B. Numerical Simulation                                                               the uncertainty in the transformed perceived information is
  The coordinate transformation of perceived objects in                               a combined result of the sensing uncertainty and the self-
ETSI CPMs is validated through numerical simulation. As                               positioning uncertainties of both ITS-Ss.
40 40
30 30
y (m)
y (m)
20 20
10 10
40 60 80 100 120 140 160 40 60 80 100 120 140 160
x (m) x (m)
(a) (b)
40 40
30 30
y (m)
y (m)
20 20
10 10
-60 -40 -20 0 20 40 60 -60 -40 -20 0 20 40 60
x (m) x (m)
(c) (d)
40 40
30 30
y (m)
y (m)
20 20
10 10
-160 -140 -120 -100 -80 -60 -40 -160 -140 -120 -100 -80 -60 -40
x (m) x (m)
(e) (f)
Sensing ITS-S Perceived objects = 0.05° = 0.5° = 1.0° = 1.5° = 2.0°
(g)
40
Fig. 11: Confidence ellipses of perceived objects transformed to the local frame of the receiving CAV in Test 1, where
y (m)
different heading estimate standard deviations
20 are tested for CAV(s). As the receiving CAV moves, (a), (c), and (e) show
the results at different relative positions between IRSU and the receiving CAV, while (b), (d), and (f) present the results
for the V2V case. Each ellipse represents 95% 0of position estimate
50 confidence.
100 The first
150 ellipse on200
the left represents the
x (m)
uncertainty in the position estimate of the sensing ITS after transformed into receiving CAV’s frame.
In the simulation, the covariance matrix in the self- they are roughly the minimum values supported in CPMs
localisation estimate
n of the receiving CAV o is denoted as for representing the uncertainty of heading and position
G R 2 2 2 estimates, respectively, for the originating ITS-S. This is
Σt = blkdiag (σpos ) , (σpos ) , (σθ ) , where σpos and
σθ denote the standard deviation of position and heading mainly due to discretisation of confidence levels of the
estimate, respectively. The simulation consists of two tests corresponding DEs defined in CPMs. Likewise, 0.005m is
for evaluating the effect of different σθ and σpos values in adopted as the standard deviation for the position estimate
coordinate transformation. Specifically, σθ is varied in Test of the IRSU, and the heading estimate standard deviation is
1 with σpos kept constant, while a range of σpos are tested set to a close-to-zero value for preventing numerical errors
for the CAV in Test 2. Each of the tests further includes both in the transformation.
V2V and V2I cases. In the V2V case, the sensing CAV is
setup with the same covariance matrix as for the receiving Figure 11 reveals the result of Test 1, i.e., the effect
CAV, i.e., GΣSt = GΣR of different uncertainty levels in heading estimates of the
t . In the V2I case, where the sensing
ITS-S is an IRSU, the localisation noise is assumed small CAV(s), along with the movement of the receiving CAV.
yet non-zero. For simplicity, a group of 20 static road users Figure 12 depicts the result of Test 2, which is with different
are positioned in front of the sensing ITS-S in a line with uncertainty in position estimates of the CAV(s). It can be
identical perception uncertainty parameters, as demonstrated seen from both figures that the confidence ellipses of those
in Figure 10. Detailed parameters adopted in the simulation perceived objects, after transformed into the local coordinate
can be found in Table I. Please note that standard deviations system of the receiving CAV, are bloated and distorted to
as low as 0.05◦ and 0.005m are tested in the simulation as different extents, depending on their relative poses with
respect to both ITS-Ss. Please note that in both figures, the40 40
30 30
y (m)
y (m)
20 20
10 10
40 60 80 100 120 140 160 40 60 80 100 120 140 160
x (m) x (m)
(a) (b)
40 40
30 30
y (m)
y (m)
20 20
10 10
-60 -40 -20 0 20 40 60 -60 -40 -20 0 20 40 60
x (m) x (m)
(c) (d)
40 40
30 30
y (m)
y (m)
20 20
10 10
-160 -140 -120 -100 -80 -60 -40 -160 -140 -120 -100 -80 -60 -40
x (m) x (m)
(e) (f)
Sensing ITS-S Perceived objects pos
= 0.005 m pos
= 0.25 m pos
= 0.5 m pos
= 0.75 m pos
= 1.0 m
(g)
40
y (m)
Fig. 12: Confidence ellipses of perceived objects transformed to the local frame of the receiving CAV in Test 2, with different
20
standard deviations in position estimate of CAV(s). (a), (c), and (e) demonstrate the results for the V2I case, while (b), (d),
and (f) illustrate the results for the V2V case at different relative positions. Each ellipse represents 95% of position estimate
0 50 100 150 200
confidence. The first ellipse on the left denotes the uncertainty in the transformedx (m) position estimate of the sensing ITS.
first yellow ellipse on the left represents the uncertainty in effective than that of position, in suppressing the bloating of
the transformed position estimate of the sensing ITS. uncertainty during the coordinate transformation of perceived
In Figure 11, the bloating effect is found sensitive to the objects information.
uncertainty contained in the heading estimate of both ITS- Also, the two scenarios of an IRSU and a CAV acting as
Ss. Also, the bloated ellipses are slanted along the tangential the sensing ITS-S are compared in each of Figure 11 and
directions of both ITS-Ss, and the bloating is found more Figure 12. When the sensing ITS-S is an IRSU, it can be
serious for ellipses that are further from both ITS-Ss. In seen that the transformed confidence ellipses are still slanted
theory, these thin and long confidence ellipses caused by but in general less bloated due to very low uncertainty in
the heading uncertainty are expected to be banana shaped IRSU’s position.
due to the non-linear nature of the coordinate transformation.
V. D EMONSTRATIONS
The result therefore indicates that with a larger uncertainty
level in heading estimate and for further perceived objects, A. Experiment in An Urban Traffic Environment
the Gaussian assumption starts to show its limitation for The experiment was conducted in a real urban traffic
representing the perceived object estimates. One can choose environment next to the ACFR building located at Chippen-
to use Gaussian mixture or non-Gaussian representations in dale, Sydney. In the experiment, the IRSU was deployed
the transformation to alleviate the issue. As a comparison, near the intersection of Abercrombie St and Little Queen
the bloating effect as a result of the uncertainty in position St, monitoring the traffic activity at the intersection and
estimates of the ITS-Ss is found less correlated to the relative broadcasting the perception information in the form of ETSI
distance, and the bloating happens in both x and y directions, CPMs in real time, as depicted in Figure 13. The intersection
as shown in Figure 12. This shows that reducing the estimate was chosen for the experiment mainly because turning from
uncertainty of heading in ITS-S self-localisation is more Abercrombie St to Little Queen St, which is a side road,IRSU
(a) (b)
Fig. 13: Experiment setup at the intersection of Abercrombie St and Little Queen St. In (a), the IRSU was setup facing
The University of Sydney Page 6
south of Abercrombie St. The car traffic flow was going north on this one-way street. The trajectory of the CV is denoted
by a dashed red line, which indicates that the CV turned from Meagher St to Abercrombie St, followed by Little Queen St.
In (b), CPMs were transmitted from the IRSU to the moving CV through Cohda MK5s.
(a) (b)
(c) (d)
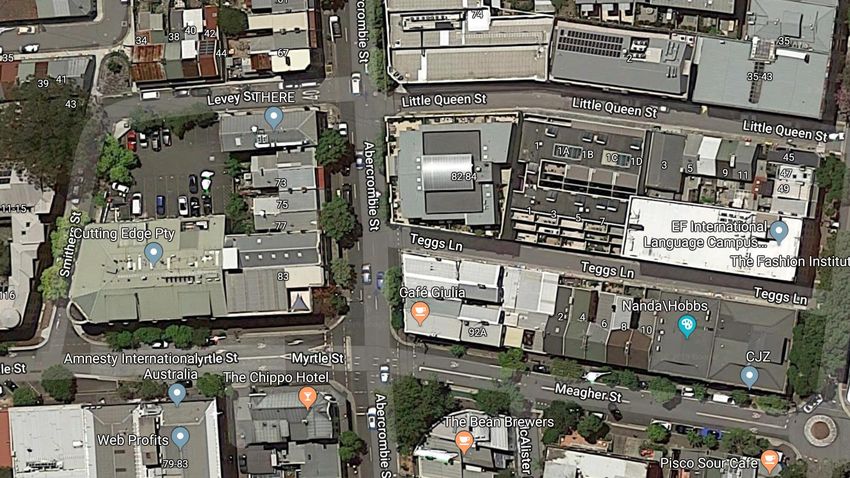
Fig. 14: The road user detection and tracking in the IRSU and CV in the Abercrombie St experiment. (a) and (b) show the
image frames from Cam #1 and #2, respectively, overlaid with pedestrians and vehicles bounding boxes and projected lidar
point cloud in the IRSU. The detection results from the dual cameras and the lidar were then fused within the IRSU for
tracking in 3D space, as visualised in (c). The detection results were also transmitted to the CV, where they were transformed
and used from the CV’s local frame. (d) illustrates the tracking results of the same group of road users within the CV at
the same time. Due to change of visualisation colours in IRSU and CV, the vehicles in orange pillars in (d) correspond to
red ones in (c), while the pedestrians in magenta pillars correspond to green ones in (c).
requires extra attention from vehicle drivers due to the lack activity in blind spots through the CP information provided
of traffic control and poor visibility of road users behind by IRSU.
the corner building. The main purpose of the experiment is Instead of autonomous driving, the CAV in the experiment
to demonstrate the improved VRU awareness and thus road was driven manually for ensuring public road safety in the
safety for a vehicle ITS-S when it is able to learn pedestrian real traffic scenario. The CAV platform therefore practically(a) (b)
(c) (d)
(e) (f)
Fig. 15: The CV became aware of a hidden pedestrian before turning from the main street to Little Queen St. The left
column shows the images captured by the front-right camera on the CV at different times, the right column illustrates the
corresponding road user tracking results within the CV. Also in the right column, the tracked pedestrians are represented
as magenta pillars with their 2-sigma estimation confidence areas denoted as yellow ellipses, the IRSU is visualised in the
CV as a tall white pillar. In (a) and (b), the CV could “see” through the building a visually occluded pedestrian (labelled
with purple circles) around the corner with the help of CPMs received from the IRSU. This is seconds before the CV drove
closer and could observe by itself the previously occluded pedestrian on Little Queen St, as depicted in (c) and (d). The
localisation covariance is presented as purple disks along the vehicle trajectory in every right column figure. It can be seen
in (f) that the uncertainty in road user tracking reduced after the CV received a correction in self-localisation.
functioned as a CV in the experiment and is referred as As illustrated in Figure 14, the CV learnt the ongoing
the CV in the remainder of the section. While the CV was traffic activity at the intersection with the IRSU deployed
performing self-localisation within the experiment area, it far beyond the reach of its onboard perception sensors. This
was able to transform the perceived objects contained in illustrates the extended sensing range for smart vehicles
CPMs into its local coordinate system with uncertainty and through the CP service. At a later time shown in Figure
have the road users tracked in real time. The CV identifies 15a and Figure 15b, when the CV was about to make a right
itself and its driver based on the position of the transformed turn to Little Queen St, the vehicle could “see” a visually
perceived objects in its local frame to avoid self-tracking. occluded pedestrian behind a building with the information
coming through the IRSU. Please note that it is achieved
In the experiment, as labelled in Figure 13, the CV first seconds before the pedestrian could actually be visually
made a right turn from Meagher St to Abercrombie St, picked up from the CV perspective in Figure 15c and Figure
drove for about 60 m before turning to Little Queen St.Walker #1
Walker #2
CAV Moving Direction
Fig. 16: Experiment setup
The University of Sydney in the CARLA simulator. The CAV, a red car, moved to the east direction
Pagetowards
3 two walking
pedestrians and an IRSU deployed on the roadside. The IRSU was spawn in CARLA as a mini car parked on the roadside.
(a) (b)
Fig. 17: Pedestrian detection and tracking in the IRSU in the CARLA simulator. Despite dual cameras enabled for detecting
road users in the IRSU, the Cam #1 captured all the road users at the particular moment in the experiment. Therefore only
the image frame from that camera is shown in (a). In (b), where the road users are tracked in 3D space, the CAV itself
is labelled as an orange pillar with confidence ellipse and arrow indicating its moving direction. The two pedestrians are
denoted by magenta pillars.
15d, which is crucial for safety in both manual driving and B. Experiment in CARLA Simulator
autonomous driving scenarios. This is considered another
benefit of the CP service demonstrated in the experiment. The experiment demonstrates the autonomous operation
of a CAV using the perception information received from an
IRSU in CARLA simulator as the only source for pedestrian
estimation. CARLA [56] is an open source game engine
Besides, the CV localisation quality varied depending on based simulator, which supports flexible configurations of
the lidar feature quality at different locations of the experi- sensors, road users, and urban traffic environments. One
ment environment. It is illustrated by comparing Figure 15d of the highlights of CARLA simulator is the various and
and Figure 15f that the refinement in egocentric pose estimate realistic sensory data it provides, including RGB images,
as a result of a correction in the self-localisation shown in the lidar point clouds, IMU and GNSS measurements. Another
latter contributes to the improvement of tracking accuracy, highlight is its ROS integration with the ros-bridge package.
which is consistent with the finding from the Section IV- It is considered a safe, realistic, and repeatable environ-
B that the level of ITS-S localisation estimate uncertainty ment for experimenting with autonomous driving systems,
correlates to the perceived objects detection uncertainty after in particular, for conducting CAV operations that have safety
coordinate transformation and thus tracking uncertainty. concerns to test in the real world.(a) (b)
(c)
Fig. 18: The pedestrian tracking in the CAV relying only on CPMs from the IRSU in the CARLA simulator. In (c), the
grid-based cost map maintained by the path planner in the CAV is presented with white as free space and black as occupied
areas, and the odometry trajectory is shown as a red line, and the planned path is presented as a dotted green line.
The experiment is setup with the IRSU detecting multiple possible to the real IRSU developed, which is equipped with
walking pedestrians within its sensor range. The information two cameras and a 16-beam lidar, as revealed in Figure
of perceived pedestrians is then broadcast in the form of 16. It is visualised as a mini car parked on the roadside
ETSI CPMs and is received by the CAV. The information is in the simulator. The same suite of sensory data processing
then transformed into its local frame of reference, and taken algorithms for the real IRSU is adopted in the simulated
into account as the only perception data in the autonomous IRSU. The road user perception information is encoded to
navigation of the CAV. The experiment is to demonstrate how ETSI CPMs in the form of binary payloads and broadcast
a CAV interacts with VRU at non-designated crossing areas by the IRSU. The CAV employed in the experiment is
with the perception information from an IRSU. It is strongly as also shown in Figure 16, which is able to position
recommended to conduct these experiments with higher risk itself within the map using a combination of measurements
CAV maneuvers in a simulator before performing them in from GNSS, IMU, and wheel encoder. The self-localization,
real world. however, is not assumed perfect but with noise added to
the GNSS, IMU, and encoder measurements. A unscented
The experiment was setup in the Town01 map of CARLA
Kalman filter (UKF) is used to achieve sub-meter accuracy.
0.9.8 simulator with participants labelled in Figure 16. These
In the experiment, the CAV is also setup to receive ETSI
include an IRSU deployed static next to a straight road, a
CPMs from the IRSU. It should be noted that the CAV
CAV navigating autonomously on the same road towards
does not have any onboard sensors for detecting road users,
east, and two walking pedestrians. One of the pedestrians
instead, it becomes aware of the road users and infer their
was crossing the road, while the other is walking along
states purely relying on information received from the IRSU.
the road in the west direction. A Lanelet2 map was built
The CAV navigates at a speed up to 18 km/h in the simulator.
for the experiment environment in the simulator, which is
essential for the CAV to stay on the road and plan drivable
In the experiment, one of the pedestrians was crossing the
paths for autonomous navigation. The map includes the lane
road at a non-designated crossing area while the other is
markings and the network of drivable regions as per right
walking along the road in the opposite direction to the CAV.
hand traffic rules. Accordingly, the CAV respects right hand
Figure 17 demonstrates the road user detection and tracking
traffic rules in the demonstration. On the road where the CAV
in the IRSU at the beginning of the experiment. Specifically,
is navigating, the CAV has right of way over pedestrians and
Figure 17a shows the detection of the two pedestrians and
is allowed to cross the broken dividing line to overtake other
the CAV by fusing the lidar point cloud and image frame
road users when it is safe to do so.
from Cam #1 of the IRSU. The tracking of the same three
The IRSU in the simulator is configured as close as road users in 3D space is shown in Figure 17b. The trackingYou can also read