Demystifying Air Pollution in London full report - London Councils
←
→
Page content transcription
If your browser does not render page correctly, please read the page content below
Demystifying Air Pollution in London full report
Demystifying Air Pollution in London

Contents
1 Demystifying the Available Information           4

Air pollution                                      4

Important pollutants and their impacts             4

Particulate Matter 2.5 & 10 (PM)                   4

NO2                                                4

Sulphur Dioxide                                    5

Ozone (O3)                                         5

Carbon Monoxide                                    5

Weather conditions affecting pollutants            5

2 Sources of Air Pollution                         6

3 Health Impacts                                   8

The health effects of the various pollutants       8

Particulate Matter                                 8

Nitrogen Dioxide                                   8

Sulphur dioxide                                    9

Ozone                                              9

Carbon Monoxide                                    9

Air pollution levels in London                     9

Cost of air pollution                              10

4 Transport                                        11

Petrol, diesel, hybrid, EV & hydrogen              11

European Emission Standards                        12

Emissions scandal                                  12

                                               1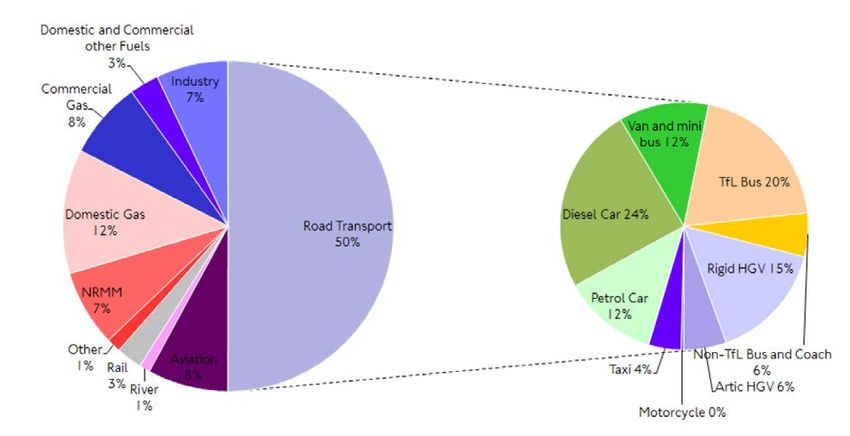
5 Key stakeholders and their roles                   14

The United Nations                                   14

World Health Organisation                            14

EU                                                   14

UK Government                                        14

The Environment Agency                               15

The Committee on Medical Effects of Air Pollutants   15

The London Mayor                                     16

London Local Authorities                             16

6 Current Plans and Initiatives in London            17

London Boroughs                                      17

Air Quality Monitoring                               17

Reducing emissions from transport                    17

Reducing emissions from buildings                    21

Raising awareness                                    22

Working with businesses                              22

Green Infrastructure                                 22

Mayor of London (includes TfL & GLA)                 23

Congestion Charge Zone                               23

Low Emission Zone (LEZ)                              23

Low Emission Neighbourhoods                          23

Air quality alerts                                   23

Emissions Surcharge (T-Charge)                       24

Ultra Low Emission Zone (ULEZ)                       24

Emission standards for taxis and PHVs                24

emission standards for buses                         25

Construction                                         26

domestic buildings                                   26

                                             2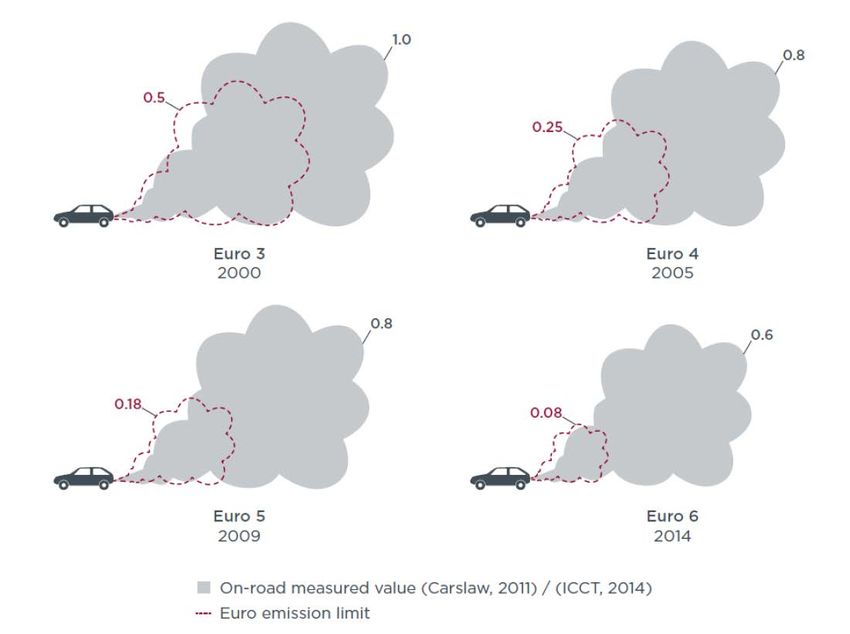
Non-Domestic public buildings               26

The Mayor’s Air Quality Business Fund       26

Private Sector                              26

Business Improvement Districts (BIDs)       26

International examples:                     27

         Oxford                             27

         Paris                              27

         Delhi                              27

         Freiburg                           27

         Copenhagen                         28

         Oslo                               28

         Helsinki                           28

         Zurich                             28

         Madrid                             28

         Chengdu                            28

7 Future Challenges                         29

Population growth                           29

Funding pressures                           29

Working together                            29

Brexit                                      29

Climate change                              29

8 Solutions                                 31

Innovation and Technology                   33

9 Conclusion                                34

Glossary                                    35

                                        3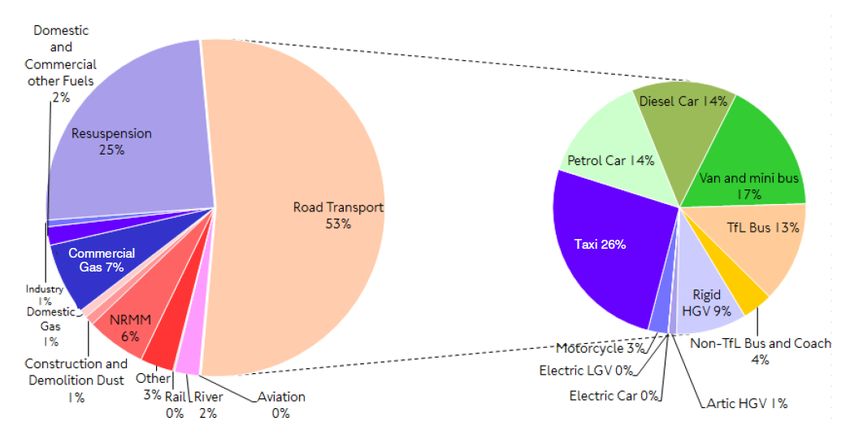
1 Demystifying the Available Information

Air pollution

Air pollution is the presence of materials or substances in the air, which have harmful effects
on people’s health. Air pollution also contributes to other environmental issues, such as global
warming, acid rain, eutrophication and ozone depletion; and other environmental issues
contribute to poor air quality. This is an important clarification as the term emissions is also
used to refer to Carbon Dioxide (CO2) which is more closely linked to climate change.

Important pollutants and their impacts

The pollutants most widely referred to in the literature are:
   ● Particulate matter (these are usually split into 2 sizes: PM2.5 & PM10)
   ● Nitrogen dioxide (NO2)
   ● Sulphur dioxide (SO2)
   ● Ozone
   ● And occasionally, Carbon Monoxide (CO)

PM and NO2 are commonly seen as the most dangerous forms of air pollution due to their high
concentrations and the negative health impacts they create. The sections below look to
provide more detail on PM and NO2 but also some of the other air pollutants. Overall this
report focuses on PM and NO2.

Particulate Matter 2.5 & 10 (PM)

PM is made up of a wide range of materials and arises from a variety of sources.
Concentrations of PM comprise primary particles emitted directly into the atmosphere from
combustion sources and secondary particles formed by chemical reactions in the air. It
consists of a complex mixture of solid and liquid particles of human-made (such as diesel
soot) and natural substances suspended in the air (such as sea spray and Saharan dust). In
the UK the biggest human-made sources are stationary fuel combustion (power generators)
and transport.

NO2

Nitrogen dioxide is human made, with the major sources of emissions of NO2 being
combustion processes (heating, power generation, and engines in vehicles and ships) 1.
Nitrogen is released during the combustion of fuel and then combines with oxygen atoms to
create nitric oxide (NO). This further combines with oxygen to create nitrogen dioxide (NO2).
Nitric oxide is not considered to be hazardous to health at typical ambient concentrations, but
nitrogen dioxide is. Nitrogen dioxide and nitric oxide are referred to together as oxides of
nitrogen (NOx). NOx gases can also react to form smog and contribute to acid rain. NOx is
also central to the formation of fine particles or particulate matter (PM) and ground level ozone
(O3), both of which are associated with adverse health effects.

Sulphur Dioxide

Sulphur dioxide (SO2) is an invisible gas. It is created mainly from industrial processes, such
as the generation of electricity from coal, oil or gas that contains sulphur. It reacts easily with

1 Beevers, S. et al (2015) Understanding the Health Impacts of air pollution in London. King’s College London, London.

                                                                   4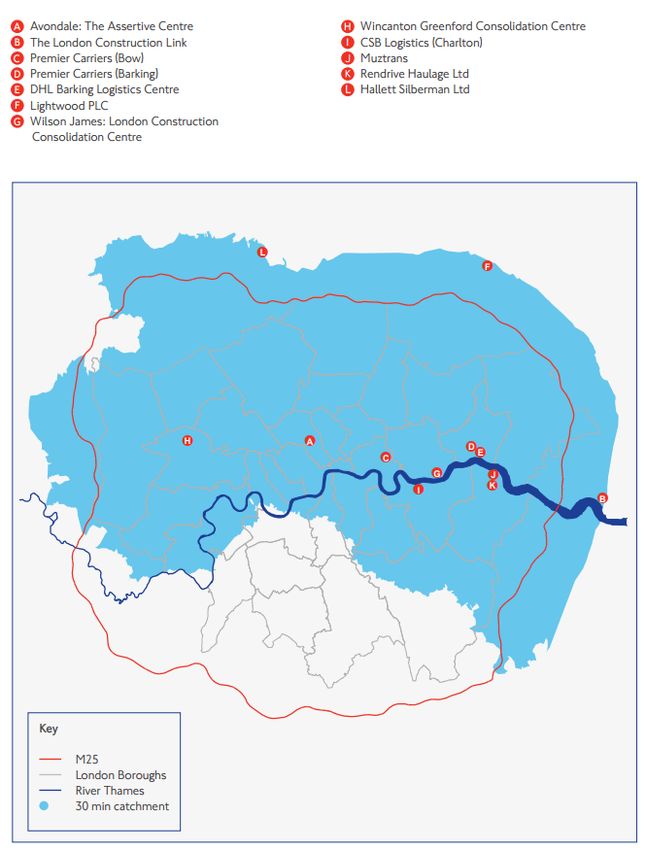
other substances to form harmful compounds, such as sulfuric acid, sulphurous acid and
sulphate particles. It is also present in vehicle emissions, as the result of fuel combustion,
although this has reduced considerably in recent years.

Ozone (O3)

Ground level ozone is created through chemical reactions between pollutants, such as NOx
and CO in the presence of sunlight, hence of main concern during the summer months.
Ground level ozone is affecting human health and can be transported great distances by
weather systems and therefore also affect people in more rural locations where air pollution
levels are otherwise low.

High level ozone in the stratosphere protects the life on earth from the sun’s harmful ultraviolet
(UV) rays and is in danger of being depleted due to human-made chemicals released into the
atmosphere.

Carbon Monoxide

Carbon monoxide (CO) is a colourless, odourless gas. It is formed both naturally and by
human activity when fuels containing carbon are burnt in low-oxygen conditions. The main
source of carbon monoxide is from petrol vehicles which are not fitted with a catalytic
convertor 2. CO levels in urban areas closely reflect traffic density (in combination with weather
conditions). Other man-made sources are power stations and waste incinerators. At a
domestic level, faulty gas appliances and cigarette smoking are significant sources of carbon
monoxide. Natural processes produce relatively small amounts.

Weather conditions affecting pollutants

In winter, when the ground is cold and there is little wind, emissions are trapped near to the
ground. Winter episodes took place in 1991 in London and in 2001 in several locations
(including Belfast, Glasgow and Manchester), with hourly average NO2 concentrations
reaching 700 µg/m-3 (EU hourly average limit is 200 µg/m3.

Summer episodes take place when the weather is hot and sunny and wind speeds are low.
High concentrations of ozone can be created by chemical reactions in the atmosphere and in
turn convert more NO into NO2 in areas where high NO emissions are produced, for example,
at roadsides 3.

2 http://naei.defra.gov.uk/overview/pollutants?pollutant_id=4
3 https://uk-air.defra.gov.uk/assets/documents/reports/aqeg/nd-summary.pdf

                                                                5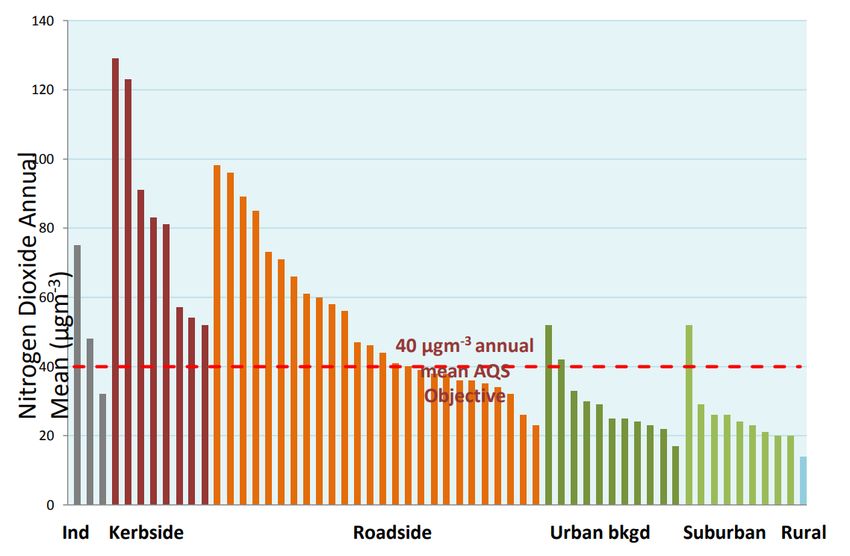
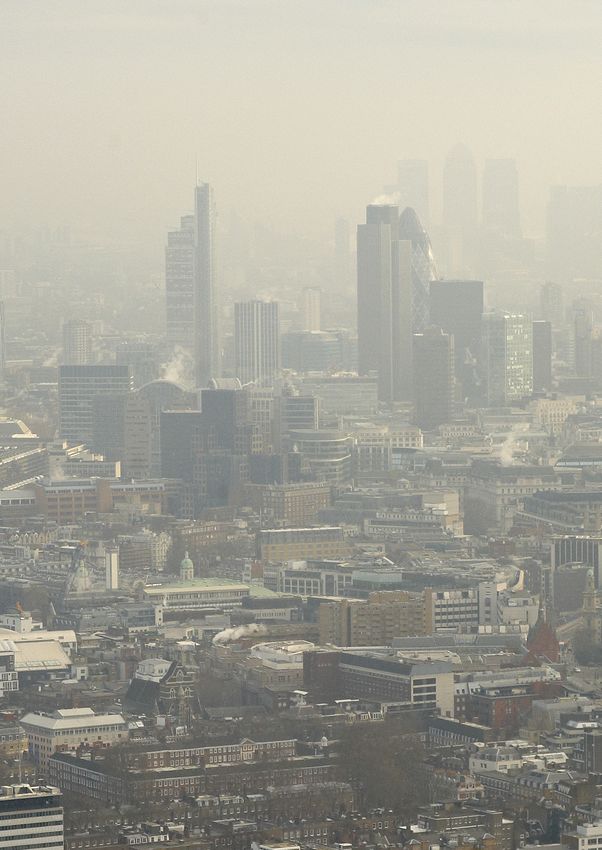
2 Sources of Air Pollution
Air pollution does not respect administrative boundaries. Air pollution in London is a mixture of
emissions created locally, and those from background concentrations. In particular, particles
measuring between 0.1 µm and 1 µm in diameter can remain suspended for weeks and so
can be transported long distances. It is difficult to breakdown air pollution to its main sources
and locations, but a number of methods have been devised to do this. The below diagram
shows how King’s College London separate and identify different sources and locations of air
pollution by layering the measurements taken from different types of area – such as roadside,
urban background and rural, which can then be used to provide an overall picture of the
makeup of air pollution within London.
Figure 1 - NO2 levels in London
Research has shown that around 75 per cent of particulate matter pollution in Greater London
is estimated to come from outside the city. While only 18 per cent of London’s ambient NO2
comes from outside the city 4. Therefore it is crucial that local, national and international action
is taken to ensure that dangerous levels of air pollution are tackled.
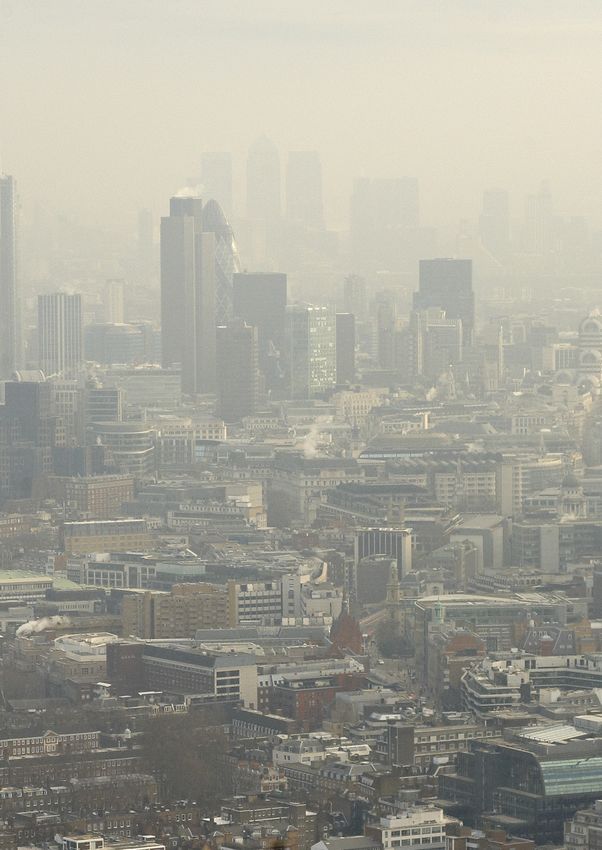
The following two graphs show the main sources of NOx and PM10 in London. Road transport
is the main contributor for both pollutants and therefore depicted further with regards to types
of vehicles. It is right therefore to have an emphasis on transport as a source of pollution in
London; however the others should not be forgotten.
4
Howard R (2015) Up in the Air: How to Solve London’s Air Quality Crisis: Part 1, Policy Exchange.
https://policyexchange.org.uk/publication/up-in-the-air-how-to-solve-londons-air-quality-crisis-part-1/
6Figure 2 - NOx sources in Greater London in 2013 (LAEI 2013) – insert reference
Figure 3 - PM10 sources in central London in 2013 (LAEI 2013)
73 Health Impacts
This section will provide an overview of the research on the health impacts of air pollution in
London.
One of the key pieces of research often referred to is the King’s College London report,
‘Understanding the Health Impacts of Air Pollution in London’. This is an important bit of
research as it is one of the first to quantify the mortality burden of certain pollutants (namely
Particulate Matter [PM2.5] and Nitrogen Dioxide [NO2]) specifically in London. The report shows
that air quality is a major health challenge in London and the research estimates that 9,416
deaths in London are caused by long term exposure to NO2 and, in this instance, PM2.5.
The report shows that while PM2.5 is dangerous (causing the equivalent of 3,537 deaths), it
found that NO2 was more lethal and responsible for more deaths (5,879).
There is growing evidence that air pollution does not only affect the respiratory system, but
also impacts negatively on the cardiovascular system as well. This is because diesel and
petrol fumes pollute the air with ultra-fine particles. These stop blood vessels relaxing and
contracting, which increases the risk of clots and heart attacks 5.
There is also a growing amount of academic research indicating that ambient air pollution also
negatively impacts on a person’s cognitive performance (various) 67.
The health effects of the various pollutants
Particulate Matter
The most health-damaging particles are those with a diameter of 10 microns or less, (≤ PM10)
with PM10 & PM2.5 being the most widely measured. These can penetrate and lodge deep
inside the lungs. Chronic exposure to particles contributes to the risk of developing
cardiovascular and respiratory diseases, as well as of lung cancer. The biggest impact of
particulate air pollution on public health is understood to be from long-term exposure to PM2.5,
which increases the age-specific mortality risk, particularly from cardiovascular causes.
Exposure to high concentrations of PM (e.g. during short-term pollution episodes) can also
exacerbate lung and heart conditions, significantly affecting quality of life, and increase deaths
and hospital admissions 8. Children, the elderly and those with predisposed respiratory and
cardiovascular disease, are known to be more susceptible to the health impacts from air
pollution 9. The King’s College report, Understanding the health impacts of air pollution in
London, states that in 2010 PM2.5 and NO2 were linked with approximately 1990 and 420
respiratory hospital admissions respectively with an additional 740 cardiovascular hospital
admissions associated with PM2.5.
Nitrogen Dioxide
NO2 is an irritant gas, which, at high concentrations, causes inflammation of the airways.
Studies have shown significant links between long term exposure to NO2 in outdoor air with
adverse effects on health, including:
5 https://www.bhf.org.uk/research/where-we-fund-research/centres-of-research-excellence/university-of-edinburgh/exhaust-
fumes-and-heart-attacks
6 https://www.ncbi.nlm.nih.gov/pmc/articles/PMC5017593/
7 http://bmjopen.bmj.com/content/6/6/e010004.full
8 http://www.rightcare.nhs.uk/index.php/atlas/respiratorydisease/
9 http://www.who.int/phe/air_quality_q&a.pdf
8● decreased lung function;
● stunted lung growth in children;
● increased respiratory symptoms which can include coughing, difficulty breathing, and
shallow breathing;
● increased asthma prevalence and incidence;
● increased cancer incidences;
● adverse birth outcomes;
● reduced life expectancy
● Increased mortality (US EPA, 2013; WHO, 2013) 10.
The impact on children is especially bad, with epidemiological studies showing that symptoms
of bronchitis in asthmatic children increase in association with long-term exposure to NO2, as
well as stunting lung growth 11.
Sulphur dioxide
Sulphur dioxide (SO2) affects human health when it is breathed in. It irritates the nose, throat,
and airways to cause coughing, wheezing, shortness of breath, or a tight feeling around the
chest.
Ozone
The health impacts of short term exposure to ozone (O3) include coughing, throat irritation,
chest tightness and reduced lung function. Long-term exposure is linked to aggravation of
asthma and the development of a number of respiratory diseases, and stunted lung growth in
children.
Carbon Monoxide
Inhalation of carbon monoxide (CO) at high concentrations can be fatal, because it prevents
the transport of oxygen (in blood) around the body. Releases from poorly maintained
appliances in poorly ventilated spaces could result in concentrations high enough to cause
death. Long-term exposure to lower concentrations (such as through smoking) could harm
unborn babies or cause neurological damage 12.
Air pollution levels in London
The UK legal limits for air pollutants have been set by the European Union (EU). But they
differ from the safe levels set by the World Health Organisation (WHO). The EU set their limit
value for PM2.5 250 per cent higher than the WHO guideline values and 100 per cent higher for
PM10 to minimise the time and cost implications of potential legal proceedings from citizens
against the relevant agencies or administrations for not meeting their targets 13.
Table 1- EU limit levels for pollutants
Pollutant Concentration Averaging period Permitted
exceedances each
year
PM2.5 25 µg/m3 1 year n/a
10 https://www.gov.uk/government/publications/nitrogen-dioxide-health-effects-of-exposure
11 https://uk-air.defra.gov.uk/assets/documents/What_are_the_causes_of_Air_Pollution.pdf
12 http://www.nhs.uk/conditions/Carbon-monoxide-poisoning/Pages/Introduction.aspx#symptoms
13 http://www.europarl.europa.eu/RegData/etudes/STUD/2014/536285/IPOL_STU(2014)536285_EN.pdf
9PM10 50 µg/m3 24 hours 35
40 µg/m3 1 year n/a
Sulphur Dioxide 350 µg/m3 1 hour 24
(SO2) 125 µg/m3 24 hours 3
Nitrogen dioxide 200 µg/m3 1 hour 18
(NO2) 40 µg/m3 1 year n/a
Carbon monoxide 10 mg/m3 Maximum daily n/a
(CO) 8 hour mean
Table 2- WHO limit levels for pollutants
Pollutant Concentration Averaging period
PM2.5 25 µg/m3 24 hour
10 µg/m3 1 year
PM10 50 µg/m3 24 hour
20 µg/m3 1 year
NO2 200 µg/m3 1 hour
40 µg/m3 1 year
Sulphur Dioxide (SO2) 500 µg/m3 10 minute
20 µg/m3 24 hour
The law states that hourly levels of NO2 must not breach 200 micrograms per cubic metre
(µg/m3) more than 18 times in a whole year. This limit is regularly broken in London within
days. For example, in 2017 it was broken in 5 days into the year (5th January 2017) in one
area (Brixton Road, Lambeth), with many more following before the end of January (Oxford
Street, Putney High Street, the Strand, and Kings Road in Chelsea). In 2016 the annual mean
limit for NO2 pollution was broken at 59 of 97 air monitoring London sites.
The WHO has started in 2016 the revision process of the Air Quality Guidelines for outdoor air
pollution, which will provide up-to-date recommendations on ambient pollutant concentrations
in order to support policy makers and other decision-makers setting efficient standards and
goals across the world for air quality management to protect public health 14.
A report by the Royal College of Physicians and the Lancet Countdown shows that most of
London has dangerous limits of PM2.5. The report shows that London has PM2.5 level of 15
μg/m3. This is within the EU limit values but exceeds the WHO limits which are safer, despite
there being no agreed safe limit to PM2.5 15.
Cost of air pollution
The estimated economic costs on the health system in London of air pollution have been
calculated at between £1.4 billion - £3.7 billion per year – and this only reflects PM and NO216.
Other less understood impacts of air pollution could also push this figure upwards.
A recent United Nations Economic Commission for Europe’s report on air pollution found that
air pollution control measures generally costs significantly less than the costs of damage to
health and the environment 17.
14
http://www.euro.who.int/en/health-topics/environment-and-health/air-quality/policy/who-outdoor-air-quality-guidelines
15Braithwaite, I. Isherwood, J. Hillman, T. Goddard, A. Watts, N. Wheeler, N (2017) Lancet Countdown 2017 Report: Briefing for
UK Policymakers. London, Lancet Countdown & Royal College of Physicians.
16
Walton H, Dajnak D, Beevers S, Williams M, Watkiss P and Hunt A (2015) Understanding the Health Impacts of Air Pollution in
London, King’s College London. https://www.london.gov.uk/sites/default/files/hiainlondon_kingsreport_14072015_final.pdf
17
Greenfelt, R. Towards Cleaner Air Scientific Assessment Report 2016. UNECE. 2016
104 Transport
Transport is the main contributor to the air pollution problem in London. This chapter explains
the contribution of different technologies as well as a number of technological solutions to
address this.
Difference between petrol, diesel, hybrid, EV & hydrogen
There are two key things that need to be kept in mind when comparing the environmental
performance of different types of vehicles:
1) The air pollution performance, and;
2) The Carbon dioxide (CO2) emissions performance.
In recent years, concern about exhaust emissions from motor vehicles has been increasing
and there is a lack of clarity on benefits and draw-backs of the different types of vehicles. For
example, in 2001 the UK Government and others actively encouraged motorists to swap their
petrol cars for diesel cars as it was seen to be cleaner, due to the fact they emit less CO2.
However, diesel cars have very different emission characteristics, such as they actually tend
to emit more NOx and particulate matter, contributing to air pollution and therefore health
effects (see chapter 2 in this report). Recently there has been much debate about which fuel,
diesel or petrol, is the cleanest in terms of exhaust emissions. But there is a growing
acceptance that it is more effective to look at the overall emissions of a vehicle encapsulating
the production, energy generation and provision processes, as well as the emissions at
‘tailpipe’ (or the emissions the vehicle creates as a by-product of movement).
Lifecycle emissions are important to consider as a move towards electric vehicle (EV) will see
greater demand on the national grid. But with the UK slowly moving towards increasing the
proportion of its energy from renewable and low carbon sources, 24% at the time of writing,
this will only improve electric vehicles’ performance in this regard.
There are a number of reports looking into this, providing analysis of the different emissions
from electric vehicles and petrol and diesel18192021.
It is already known that EVs perform much better than any other vehicle type when it comes to
air pollution. When it comes to tailpipe emissions, they produce no NOx and much less PM,
with most of the PM coming from wear and tear of the tyres and resuspension 22. EVs do not
have the same issues with engine soot as petrol and diesel vehicles.
Regarding CO2 emissions, this is dependent on the power generation mix. With the UK’s
broad mix of natural gas, coal, nuclear and renewables, this means that the carbon intensity of
EVs will drop as renewable energy production rises, and should also make savings in the
production process as an increase in the number of EVs produced should, in theory, provide
greater efficiencies.
18 http://shrinkthatfootprint.com/wp-content/uploads/2013/02/Shades-of-Green-Full-Report.pdf
19file://docserver/UsersFlderRedirect/OwainMortimer/Downloads/CONFERENCE+2013+Final+Report_Lifecycle+CO2+Assessme
nt+of+Low+Carbon+Cars+2020-2030_PEJuly2013.pdf
*This report does not account for the emissions from bio-fuels
20https://d1v9sz08rbysvx.cloudfront.net/ricardo/media/media/news%20assets/lowcvp%20study%20demonstrates%20importance
%20of%20whole%20life%20co2%20emissions.pdf
21 https://www.theccc.org.uk/wp-content/uploads/2013/04/Ricardo-AEA-lifecycle-emissions-low-carbon-technologies-April-
2013.pdf
22 https://www.witpress.com/Secure/elibrary/papers/UT12/UT12008FU1.pdf
11European Emission Standards
European emission standards define the acceptable limits for exhaust emissions of new
vehicles sold in European Union and European Economic Area member states. Standards are
set for different categories of vehicles. Over the past 20 years, regulators in Europe, the USA,
and Japan have implemented increasingly more stringent emission standards for vehicle
exhaust emissions. Many countries outside of Europe follow the European model for engine
emission certification, including Brazil, China, India, Russia, South
Korea and Thailand. Mexico has historically followed the U.S. model, but has recently
changed to allow either the USA or European-certified engines. ‘Developing countries’ are
expected to follow the same path to compliance with the Euro IV and Euro V standards/or
equivalent as those seen in Europe.
The first European exhaust emissions standard for passenger cars was introduced in 1970.
22 years passed before the next big change when, in 1992 the 'Euro 1' standard heralded the
fitting of catalytic converters to petrol cars to reduce carbon monoxide (CO) emissions, and
since then all petrol cars built must have them included. The latest standard, 'Euro 6', applies
to new type approvals from September 2014 and all new cars from September 2015 and
reduces some pollutants (namely PM) by 96 per cent compared to the 1992 limits.
The standards apply to the following emission pollutants:
- Carbon Monoxide (CO)
- Nitrogen Oxides (NOx)
- Hydrocarbons
- Particulate Matter (PM).
The levels of carbon dioxide that vehicles are allowed to emit are set in a different EU
regulation (EC 443/2009). The current regulation sets an average CO2 emissions target for
new passenger cars of 130 g/km, and was phased in between 2012 – 2015. A target of 95
g/km will apply from 2021.
Emissions scandal
Something that has caused confusion regarding vehicle emissions is what has been dubbed
the ‘VW emissions scandal’ or ‘dieselgate’. This was the discovery in September 2015 by the
US Environmental Protection Agency that for some of its vehicles, Volkswagen had developed
methods of cheating the emissions testing regime to appear as if the cars emitted less NOx
than they actually did when driven in real world conditions. This raised awareness of the issue,
and other countries began investigating whether their vehicles had also been subject to these
testing cheats. The investigations have since shown that this practice was widespread
amongst vehicle manufacturers across the globe.
The term ‘real-world’ in this context refers to the performance of the vehicles when being
driven outdoors in normal situations, as opposed to in the testing labs, which involves testing
the vehicles outputs on a treadmill-style machine. It was calculated that, on average,
passenger cars emit seven times more NOx than the Euro standard limit. To put that into
context, if this figure was applied to an individual vehicle, this would correspond to a real-world
level of approximately 560g/km of NOx (compared to the regulatory limit under Euro 6 of 80
mg/km) 23. A revised Euro standard, Euro 6c will be introduced in 2017, which essentially
includes a more stringent testing regime, aimed to better reflect the performance of vehicles in
the real-world.
23 http://www.theicct.org/real-world-exhaust-emissions-modern-diesel-cars
12Figure 4 –Diesel Euro 6 Performance
135 Key stakeholders and their roles
The United Nations
The United Nations (UN) introduced the United Nations Convention on Long-Range
Transboundary Air Pollution in 1979. The UK is committed to reducing the emissions in
accordance with the Convention (specifically, the Gothenburg protocol, agreed in November
1999) which set maximum national emission (emission ceilings) for various pollutants
including NOx from 2010 onwards. The protocol was amended in 2012 to set more stringent
ceilings that will apply from 2020; an amendment to the EU National Emissions Ceilings
Directive to implement these and set ceilings for 2030 is expected to be agreed shortly.
World Health Organisation
The World Health Organization (WHO) is a specialized agency of the UN that is concerned
with international public health. As part of their work the WHO conducts research into the
health impacts of poor air quality and lobbies for improved international policy in this area and
publishes numerous academic works on the subject of indoor and ambient air pollution. The
WHO has set a number of limit values on different pollutants that they believe nations should
meet, including for particulate matter (2.5 & 10) and NO2 (see Table 2 in the report).
The WHO published (September 2016) country estimates on air pollution exposure and health
impact. The interactive maps highlight areas within countries that exceed air quality limits and
confirms that 92 per cent of the world’s population lives in places where this is the case.
EU
Action to manage and improve air quality is largely driven by European legislation. The
2008 ambient air quality directive 24 sets legally binding limits for concentrations in outdoor air
of major air pollutants that impact public health such as particulate matter (PM10 and PM2.5)
and nitrogen dioxide (NO2).
The 2008 directive replaced nearly all the previous European Union air quality legislation and
was made law in England through the Air Quality Standards Regulations 2010. Equivalent
regulations exist in Scotland, Wales and Northern Ireland.
In 2017 the EU passed stricter rules for the emissions of pollutants such as nitrogen oxide,
sulphur dioxide, mercury and particulate matter from large combustion plants in Europe. This
is an update to the Industrial Emissions Directive (which succeeded the Large Combustion
Plant Directive in 2016). The stricter limits will apply to all 2,900 large combustion plants in the
European Union – including coal-fired power stations and peat, oil and gas power plants – and
will have to be met by 2021. This will continue to be the case for the UK until it formally
completes the process of leaving the European Union, when its own legal positions will be
adopted.
UK Government
In the UK, responsibility for meeting air quality limit values is devolved to the national
administrations in Scotland, Wales and Northern Ireland. The Secretary of State for
Environment, Food and Rural Affairs has responsibility for meeting the limit values in England
24 http://eur-lex.europa.eu/LexUriServ/LexUriServ.do?uri=OJ:L:2008:152:0001:0044:EN:PDF
14and the Department for Environment, Food and Rural Affairs (Defra) co-ordinates assessment
and air quality plans for the UK as a whole.
The UK Government and the devolved administrations are required under the Environment
Act 1995 to produce a national air quality strategy. This was last reviewed and published in
2007. The strategy sets out the UK’s air quality objectives and recognises that action at
national, regional and local level may be needed, depending on the scale and nature of the air
quality problem.
The UK Government has been in breach of the limits set in the EU air quality directive since its
implementation in 2010. The UK Government was ordered to revise its ‘Air quality plan for
nitrogen dioxide’ in 2016 by the Supreme Court. The final draft was finally published in July
2017. Some of the key measures in the National Air Quality Plan include:
● Requiring local authorities to implement Clean Air Zones. These will include a package
of interventions that should cut air pollution to legal levels in the “shortest possible
time”. The plan states that all measures should be investigated before implementing a
charge on diesel and petrol vehicles.
● Introducing lorry emission roadside testing
● Funding to accelerate the transition of bus and taxi fleets to low emission.
The Government also committed to developing further measures and will set these out in:
a) the Clean Growth Plan which the Department for Business, Energy and Industrial
Strategy will bring forward in the autumn.
b) a further strategy on the pathway to zero emission transport for all road vehicles to be
published by March 2018.
c) a wider Clean Air Strategy in 2018 setting out how we will meet our international
commitments to significantly reduce emissions of five damaging air pollutants by 2020,
and 2030.
d) Commitment to exploring the appropriate tax treatment of diesel vehicles
e) Consider changes to the Heavy Goods Vehicles (HGV) Road User Levy.
The Office for Low Emissions Vehicles (OLEV) is part of the Department for Transport (DfT)
and the Department for Business, Energy and Industrial Strategy (BEIS). OLEV funds a
number of projects including plans to encourage the uptake of electric Light Goods Vehicles
(LGV) through their Plug-In Van grant scheme. Alongside this are other pots of funding aimed
at cleaning taxis, scooters & motorbikes and increasing charging infrastructure.
The government have announced plans to ban the sale of new diesel and petrol powered
vehicles by 2040, although this only covers light vehicles and doesn’t include hybrids.
The Environment Agency
The Environment Agency (EA) is a non-departmental public body with responsibility for the
protection and enhancement of the environment in England. It is also the principle flood risk
management operating authority in England. In relation to air quality the agency is a regulator
for the release of pollutants into the atmosphere from large industrial plants, which it does
through environmental permitting. Smaller industrial processes are regulated by local
authorities. The Agency will also soon have power to regulate some agricultural processes,
but many will remain unregulated.
15The Committee on Medical Effects of Air Pollutants
The Committee on Medical Effects of Air Pollutants (COMEAP) is a committee of independent
experts that provides advice to the Government on all matters relating to the impact of air
pollution on public health.
The London Mayor
The London Mayor has powers to ensure London boroughs meet their statutory Local Air
Quality Management requirements.
The Environment Act 1995 places a statutory responsibility for air quality on local authorities.
Whilst this is still the case, it was agreed with Defra that the relevant local air quality
management policy and technical guidance for London should be different from that in the rest
of the country in recognition of the particular challenges London faces. Defra has agreed that
this should be issued by the Mayor in the context of the new London Local Air Quality
Management (LLAQM) system and in recognition of his London-wide supervisory role. As a
result London boroughs need only refer to the guidance issued by the Mayor, rather than
national statutory guidance.
London Local Authorities
London local authorities have a responsibility under the LLAQM legislation to monitor air
quality. Where concentrations exceed national targets, boroughs have to designate an Air
Quality Management Area (AQMA). They are then required to develop an Air Quality Action
Plan (AQAP) with measures to reduce pollution. Currently all 32 London boroughs and the
City of London have designated AQMA and the associated AQAP must have regard to the
Mayor’s London Environment Strategy. This strategy includes measures that build on
initiatives being taken by boroughs through their AQAP. Following the Localism Act (2011) the
Mayor is required to produce one, integrated Environment Strategy, which includes the
provision for air quality.
166 Current Plans and Initiatives in London
There are a number of active plans to improve London’s air quality currently underway at
borough and Mayoral level. It can become difficult to keep track of the various initiatives and
how they interact with each other. This section aims to layout the various schemes and
initiatives currently underway in London, whilst detailing their main objectives and at what level
they operate.
London Boroughs
Air Quality Monitoring
One of the borough’s main statutory functions is to monitor air quality in various locations in
their area. The data gained from this allows the boroughs to plan future policy interventions,
and assess the effectiveness of their actions to reduce air pollution. As part of the London
Local Air Quality Management (LLAQM) framework, boroughs produce Annual Status Reports
(ASRs) that provide a detailed overview of air quality in their area, and the actions that have
been undertaken to reduce air pollution during the last year. You can view the Greater London
Authority (GLA) report on the ASRs for 2016/2017 here.
Reducing emissions from transport
As outlined earlier in the report, transport is one of the main contributors to poor air quality in
London and boroughs are able to contribute to reducing this problem and some of the
activities are outlined below. It is however important to note that local authorities’ ability to
control emissions from road transport is limited. Local authorities are unable to directly make
changes to the Transport for London Road Network (TLRN), which consists of many of the
busiest and more polluting roads in London. Local authorities are also not responsible or able
to control the movement of black cab taxis or buses through the borough, which again falls
under the remit of TfL.
Walking & cycling projects
Increasing modal shift from private vehicles to more sustainable and active travel options is an
important aspect of reducing air pollution. There are a multitude of walking and cycling
projects taking place across London. Boroughs are instrumental in implementing some of the
schemes funded by the Mayor, such as Cycle Super Highways and Quietways. However,
boroughs have long been committing their own funds to walking and cycling work, for instance
in the form of engagement and promotion initiatives, such as active school and work travel
projects, raising awareness of the many benefits of walking and cycling more, as well as
providing cycle training, parking and local routes. Pedestrianisation and the re-designing of the
urban realm to prioritise walking and cycling are other ways that the boroughs are currently
actively trying to tackle air pollution. Examples of this include pedestrianisation and new
Sustainable Drainage System (SuDS) on Australia Road in Hammersmith and Fulham, Van
Gogh Walk in Lambeth, and the creation of a new small park at Alfred Place Camden as part
of the Council’s West End Project.
Parking initiatives
A number of London boroughs have implemented or are planning to implement emission
based parking surcharges in a bid to discourage the most polluting vehicles. These range from
Carbon Dioxide (CO2) based charges, to charges based on engine type and size.
17Idling
Engine idling policies have been introduced across a number of boroughs, which aim to
reduce localised air pollution caused by motorists who leave their engines running when
parked. “Idling Action” is a London-wide behaviour change programme focused on this issue,
which sees volunteers ask cars to turn their engines off when stationary to reduce pollution.
Consolidation centres
An important aspect of reducing air pollution is to reduce the number of vehicles on the road.
When it comes to freight, this is a hard thing to achieve, given that these journeys are
necessary to the ‘growth’ of London, driving construction and economic activity and current
expectations of consumers are such that on the spot delivery is expected in many
circumstances. One option is for London to use freight consolidation centres, which reduce the
number of journeys needed to deliver the same amount of goods, as seen in figure 5 & 6
below.
18Figure 5 - Delivery model without an urban consolidation centre
Figure 6 - Delivery model with an urban consolidation centre
There are currently only two retail consolidation centres in London. The London Boroughs
Consolidation Centre (used jointly by Waltham Forest, Camden, Islington and Enfield) and the
Heathrow retail consolidation centre.
There are an additional twelve construction consolidation centres that currently serve
London 25. See figure 6 below for this.
25 http://westminsterresearch.wmin.ac.uk/15247/1/SCFIJvol15-4-2014-Allen-etal.pdf
19Figure 7 - Location of Construction consolidation centres across London 26
London has seen an increase in the number of Heavy Goods Vehicles (HGVs) and Light
Goods Vehicles (LGVs) due to, among other factors, the increase in construction work in
London, and the increase in e-commerce, and the corresponding level of journeys by both
HGVs and LGVs these two factors create. It is likely that, as London continues to grow, with
26
http://content.tfl.gov.uk/directory-london-construction-consolidation-centres.pdf
20its population expected to reach 10 million by 2029, the city will need to think even more
carefully about freight and delivery planning. Consolidation centres will certainly be a part of
this action.
Go Ultra Low City Scheme
London was awarded capital funding from the Office for Low Emission Vehicles (OLEV) to
drive the uptake of ultra-low emission vehicles in the period 2015/16-2019/20.
There are four main streams of work that London is focusing on with the Go Ultra Low City
Scheme (GULCS) funding and all three partners are working collaboratively to implement
them;
a) Residential: Increase Ultra Low Emission Vehicle (ULEV) charging infrastructure in
residential areas.
b) Car Clubs: Increase the provision of charging infrastructure in car club bays.
c) Rapid charging: Support the increase of rapid EV chargers across London.
d) Neighbourhoods of the Future (NoF): Six local innovative schemes to prioritise and
encourage the uptake of ULEVs.
Greening council fleets
London’s local authorities have also been leading in terms of ‘greening’ their own council
fleets, with the use of their procurement frameworks to begin replacing their older, dirtier
vehicles with ultra low and zero emission vehicles.
Reducing emissions from Buildings and new developments
Energy efficiency and fuel poverty action
Domestic and commercial boilers account for a significant portion of London’s Nitrogen
Dioxide (NO2) and particulate matter (PM). Local authorities have been addressing this issue
through engagement with business and industry to raise awareness of energy efficiency
practices and technologies, as well as providing home visits and energy efficiency measures
to residents. London’s boroughs also prioritise the improvement in performance of their own
building stock through the installation of energy efficiency measures like insulation and
modern, clean heating systems.
The Environmental Permitting (England and Wales) Regulations 2010 provides a mechanism
to control emissions from plant above 20MW by the local authority and by the Environment
Agency (EA) if over 50MW. But most generators installed in London are below this capacity.
There has been a rapid growth in the use of low-cost, small scale, flexible power generators in
the UK generally in the past few years. Whilst there is a legitimate role for some of these, they
tend to be mainly diesel generators, which emit high levels of NOx relative to other Medium
Combustion Plants. This growth poses a concern for local air quality as well as for meeting
future national emission reduction targets.
The EU has since developed the “Medium Combustion Plant Directive” (MCPD), to remove
the loophole. The Directive introduces mandatory registration or permitting of Medium
Combustion Plants between one and 50 Megawatt Thermal (MWt) and must be transposed
21into UK law by 19 December 2017. The UK Government consulted on the proposed approach
to implementation and looked at the possibility of local authorities being given the
responsibility for permitting and monitoring. This consultation closed in February 2017, and
there is no formal report published at the time of writing.
The Directive states that the controls will apply to new plants from December 2018. Existing
plants must comply with requirements from 2024 or 2029, depending largely on size, with full
implementation achieved in 2030. It is estimated that the MCPD will affect over 30,000 plants
in England and Wales. However, it remains to be seen how generators will be dealt with under
this regime as they only operate intermittently so may fall outside this legislation.
Boroughs are also responsible for the setting and enforcement of planning requirements for
new developments, and this can ensure that construction sites take action to mitigate their air
quality impacts, and ensure that the buildings themselves will not worsen air quality once built
through best practice guidance and supplementary planning guidance. However, given cuts to
local authority funding, it is becoming harder for boroughs to carry out effective enforcement of
these policies.
Raising awareness
One of the key activities of London’s local authorities is engaging with their residents and
raising awareness of certain issues. Local authorities are best placed to do this in many
examples, given their deep understanding of local issues and challenges. Air quality as an
issue is one subject that many boroughs have long been campaigning locally on – for instance
to raise awareness of the benefits of walking and cycling, supporting national clean air day
and publishing travel planning strategies.
Working with businesses
Local authorities are also well placed to engage with businesses, and work with them to
improve their impact on the local air quality, for instance, by setting up business air quality
funds, and providing best practice guidance.
Green Infrastructure
Green infrastructure is the network of green spaces (as well as features such as street trees
and green roofs) that is planned, designed and managed to deliver a range of benefits,
including:
- healthy living;
- mitigating flooding;
- improving air and water quality;
- cooling the urban environment;
- encouraging walking and cycling; and
- enhancing biodiversity and ecological resilience.
It is increasingly being used at the city level, to break up the ‘grey’ infrastructure, and can
bring a number of benefits.
Research shows that the installation of ‘green infrastructure’ can contribute to the reduction of
air pollution in London 27. The strategic and planned planting of certain types of trees and other
plants could reduce air pollution at street level, as well as provide a number of other benefits,
27 http://pubs.acs.org/doi/abs/10.1021/es300826w
22such as protection against flooding, increased biodiversity not to mention the aesthetic
benefits they can bring to urban areas.
Local Authorities in London have long been maintaining the city’s green infrastructure, such as
the management of parks, but also installing new green infrastructure, like green walls, green
roofs, new pocket parks (or parklets) and planting new trees and plants.
Mayor of London (includes TfL & GLA)
Congestion Charge Zone
The Congestion Charge Zone (CCZ) was first introduced in 2003, by the first Mayor of London
Ken Livingstone, as a way of reducing congestion in Central London. Although this policy’s
main focus was on reducing traffic in a certain area of London, it originally had a positive
knock on effect on air pollution, with a number of sources stating that this has been the case 28.
London was able to do this due to powers devolved to it by the Greater London Authority Act
1999. But the benefits have slowly been eroded due to the increase in traffic in London since
this time.
Low Emission Zone (LEZ)
The Low Emission Zone (LEZ) is an existing scheme that was introduced in 2008, which aims
to reduce PM from large commercial vehicles. Its boundary covers most of Greater London
and operates 24 hours a day, every day of the year including weekends and public and Bank
holidays. Vehicles need to meet emissions standards or pay a daily charge between £100 -
£200.
Table 4 – LEZ standards
Vehicle Weight Emissions Charg Implementation
standard e
Lorries, horseboxes, >3.5T Euro IV for PM £200 February 2008 – Euro III
motor caravans and other for HGV > 12T
specialist vehicles July 2008 – Euro III for
other vehicles
January 212 – Euro IV
Buses and coaches with >5T Euro IV for PM £200 July 2008 – Euro III
9+ seats January 2012 – Euro IV
Large vans, and other 1.2 – Euro 3 for PM £100 January 2012
specialist vehicles 3.5T
Motor caravans and 2.5 – Euro 3 for PM £100 January 2012
ambulances 3.5T
Minibuses with 9+ seatsAir quality alerts
The current Mayor, Sadiq Khan, has introduced a system of air pollution alerts that are shown
at a number of locations, including Tube stations, bus stops, river piers, on digital signs along
major roads as well as the GLA and TfL websites. This information is gathered and shared by
the London Air Quality Network managed by King’s College London, which is made up of a
number of air quality monitoring sites in and around London.
Emissions Surcharge (T-Charge)
From 23 October 2017, cars, vans, minibuses, buses, coaches and heavy goods vehicles
(HGVs) in central London will need to meet minimum exhaust emission standards, or pay a
daily £10 Emissions Surcharge. This will be in addition to the Congestion Charge. The
minimum emissions standards are Euro 4/IV for both petrol and diesel vehicles and Euro 3 for
motorised tricycles and quadricycles.
Ultra Low Emission Zone (ULEZ)
The T-Charge policy will be replaced by the introduction of the Ultra Low Emission Zone
(ULEZ) which will be implemented in April 2019. From then onwards, all vehicles entering the
Congestion Charge Zone will need to meet minimum exhaust emission standards or pay a
daily charge. The vehicles include all cars (except taxis but including Private Hire Vehicles
(PHV) as they are subject to environmental requirements through the taxi licensing system),
motorcycles, vans, minibuses, buses, coaches and all HGVs. See the details below.
Table 5 – ULEZ standards
Vehicle type (includes ULEZ minimum Date from which newly Daily charge if
hybrid vehicles) emission registered vehicles must vehicle is not
standards meet the new emission compliant with
standards ULEZ standards
Motorcycle, moped etc – Euro 3 From 1 July 2007 £12.50
category L
Car and small van – Euro 4 (petrol) From 1 January 2006 £12.50
categories M1 & N1(I) Euro 6 (diesel) From 1 September 2015
Large van and minibus – Euro 4 (petrol) From 1 January 2007 £12.50
categories N1 (II & III) Euro 6 (diesel) From 1 September 2016
and M2
HGV - categories N2 & Euro VI From 1 January 2014 £100
N3
Bus/coach – category Euro VI From 1 January 2014 £100
M3
Emission standards for taxis and private hire vehicles
The Mayor has announced a number of policies in order to ‘clean up’ the London taxi fleet.
This will be done by:
● Not licensing any more new diesel taxis and only licensing new ‘zero emission
capable’ taxis from 2018;
● Providing a £3,000 grant towards the first 9,000 Zero Emission Capable (ZEC) taxis, in
addition to the Government’s plug-in car grant;
● Delivering a rapid charging network from 2017;
● Introducing a scrappage scheme for the oldest taxis from 2017;
● Exploring options to convert to a cleaner fuel;
24● Rewarding drivers who pioneer green technology, such as zero emission ranks.
There are also plans to clean private hire vehicles (PHVs). These include:
● From 2018 all PHVs presented for licensing for the first time must meet either:
- Euro 6 (diesel/petrol) standards.
- At least Euro 4 (petrol-hybrids) emissions standards.
● From 2020:
- All newly manufactured PHVs (less than 18 months old) presented for licensing for
the first time must be ZEC.
● From 2023:
- All PHVs presented for licensing for the first time must be ZEC.
Emission standards for buses
New policies on London bus procurement introduced by the current Mayor means that no new
pure diesel double-decker busses will be added to the capital’s fleet from 2018 and that all
new single-deckers for central London will be zero-emission. The Mayor has also committed
to expanding the ULEZ retrofit programme to up to 3,000 buses outside the central zone.
12 Clean Bus Zones across the capital have been announced. Buses that run on these routes
will be a combination of cleaner diesel buses that meet the new Euro VI standard, and also
hybrid engines. This is expected to reduce NOx on these routes by around 84 per cent
according to the Mayor 29. See the full list of the 12 Low Emission Bus Zones below:
List of clean bus zones
Putney High Street – from Putney Station to Putney Bridge Road
Brixton to Streatham – from Brixton Hill via Stockwell Road and Streatham High Road to
Streatham Place
A12 Eastern Avenue – from Blake Hall Road via High Road Leyton and Homerton High
Street to Marsh Hill
Lewisham to Catford – from Bromley Road via Rushey Green to Lewisham High Street
Stratford – from Abbey Lane via Mile End Road to Woodgrange Road
Haringey – from High Road to Green Lanes
Camberwell to New Cross – from Blackheath Road via Camberwell Green and Peckham
High Street to Wood’s Green
Wandsworth to St John’s Hill – from Lavender Hill to Wandsworth Road
Edgware Road (Kilburn to Maida Vale) – from Cricklewood Broadway via Kilburn High Road
to Shoot-Up Hill
Edmonton to Seven Sisters – from Amhurst Park via Green Lanes and Seven Sisters Road
to The Broadway
29 https://www.london.gov.uk/press-releases/mayoral/mayor-announces-10-new-low-emission-bus-zones
25Uxbridge Road to Shepherds Bush – from Ealing Broadway via Hanger Lane to Uxbridge
Road, The Broadway
Chiswick High Road to Kensington – via Hammersmith Broadway and Kensington High
Street to Studland Street.
Construction
Construction is a source of air pollution in London. The GLA introduced Supplementary
Planning Guidance (SPG) for the Control of Dust and Emissions during Construction and
Demolition. The aim of this SPG is to reduce emissions of dust, PM10 and PM2.5 from
construction and demolition activities in London and it includes guidance on:
● preparing an Air Quality Statement for construction and demolition activities, including
air quality (dust) risk assessments
● the stages of development the Air Quality Statement is to cover: demolition, earthwork,
construction and ‘trackout’ (vehicles leaving the site)
● identifying the potential scale (large, medium, small) of dust emissions for each stage
of work
● identifying the level of risk due to the scale of dust emissions on health, ‘soiling’ (dirt)
and the natural environment
● best practice methods for controlling dust on-site and to prevent ‘trackout’
● recommendations for monitoring
● early notification of new 2015 and 2020 standards for non-road mobile machinery
It also aims to control NOx from these same activities by introducing a ULEZ for non-road
mobile machinery (NRMM).
Domestic buildings
The Mayor of London also has programmes which look to reduce air pollution from domestic
buildings through the RE:NEW programme. The main aim of the programme to tackle fuel
poverty by improving the energy efficiency of London’s homes, and one of the projects within
this programme is the Better Boiler scheme which upgrades and/or replaces old inefficient
boilers and reduces the NOx emitted from homes. This scheme is now closed.
Non-Domestic public buildings
RE:FIT is the programme that deals with emissions from non-domestic buildings. This also
looks to improve the energy efficiency of buildings through a number of measures such as
improved insulation, LED lighting and energy plans. This could also reduce NOx emissions
from boilers slightly.
The Mayor’s Air Quality Business Fund
The Mayor has also established the Mayor’s air quality business fund, which will provide
funding to businesses and business groups to install a number of measures that will improve
air quality from their businesses, for example the development of new green areas for staff or
low emission vehicle infrastructure.
26Private Sector
Business Improvement Districts (BIDs)
A number of the BIDs in London have included a specific focus on tackling air pollution,
recognising the negative impact this can have on the surrounding area and people. For
example, in 2013 the Victoria BID launched the Victoria BID Air Quality Pledge Certificate and
worked with theatres, hotels, developers, retailers, charities and professional bodies on ways
to improve local air quality. Brixton BID is creating a public orchard on a patch of disused land
to create new green space to combat air pollution. Others are trying to use opportunities, such
as new development to make wider improvements to the area, including air quality benefits.
An interactive map of the London BIDs is here.
International examples
Cities around the world are leading the way in tackling air pollution, given this tends to be an
urban problem. Paris, Mexico City, Madrid and Athens recently pledged to ban diesel vehicles
from their cities (or large parts of them) by 2025. There are many more examples, some of
which have been detailed below.
Oxford
Oxford City Council has announced plans to introduce the ‘world’s first’ zero emission zone in
the city centre by 2020. The proposal would see diesel and petrol vehicles banned from
Oxford city centre in phases, starting with some vehicle types and a small number of streets in
2020, and - as vehicle technology develops - moving to all vehicle types across the whole city
centre in 2035.
Paris
Paris has implemented a number already of policies designed to improve air quality including:
• banning of cars in a number of historic central districts at weekends
• Banning odd-even (license plate number) vehicles
• Free public transport provision during major pollution events
• Encouraging car and bike-sharing programmes.
Paris has also reallocated space along the Right Banks of the Seine away from cars to create
a pedestrianised area. Paris currently implements the Crit’Air system, which requires drivers to
buy and display a sticker (or vignette) on their vehicles. The Vignettes come in six different
categories and related colours, which represent the year of registration, the energy efficiency,
and the vehicle's emission performance. Vehicles below a certain level are then banned from
certain areas, and this is enforced by Traffic enforcement officers and cameras.
Paris has also announced plans to ban diesel vehicles from the city by 2024, and all petrol
vehicles from the city by 2030.
Delhi
Following periods of extremely high air pollution, Delhi moved to ban all new large diesel cars
and SUVs with engines of more than 2,000CC and to phase out tens of thousands of diesel
taxis.
27Freiburg
A suburb of Freiburg in Germany, Vauban, has introduced sky-high parking fees at €18,000 in
order to force people to live without a car. In return, residents are offered cheaper housing,
free public transport, and plentiful bicycle spaces to use the more than 500km of lanes on
offer.
Copenhagen
Copenhagen prioritises bikes over cars and now has more cycles than people. Large parts of
the Danish capital have been closed to vehicles for decades and the city plans to become
carbon neutral by 2025.
Oslo
Norway is probably the world leader when it comes to electric vehicle market penetration. Oslo
has pledged large car-free zones in the city centre through a number of proposals including:
• High congestion charges,
• A rush-hour fee for motorists
• The removal of many parking spaces
• The installation of 40 miles worth of new cycle lanes.
Helsinki
The Finnish capital plans to drastically reduce the number of cars on its streets by:
• Investing heavily in better public transport
• Imposing higher parking fees
• Encouraging bikes and walking
• Converting inner city ring roads into residential and walking areas.
The idea is to make the city’s public transport so good that no one will want a car by 2050.
Zurich
The Swiss city of Zurich is seeking car reduction by directly controlling the number of cars that
are allowed in the city at any one time only and also capping the number of parking spaces in
the city. This is coupled with the building of more car-free areas, plazas, tram lines and
pedestrianised streets.
Madrid
The Spanish capital plans to embark on a programme of urban redevelopment to redesign 24
of the busiest streets in the city in order to prioritise walkers and cyclists rather than drivers.
The initiative is part of the city's "sustainable mobility plan”.
Chengdu
The layout of a new residential area in the Chinese city, designed by Chicago-based
architects Adrian Smith and Gordon Gill makes it easier to walk than drive, with streets
designed so that people can walk anywhere in 15 minutes. Only half of the roads will allow
cars.
28You can also read