Design and Neutronic Evaluation of Thorium Fuel in Pressurized Water Reactors - LIU CHANYUN
←
→
Page content transcription
If your browser does not render page correctly, please read the page content below
Design and Neutronic Evaluation of Thorium
    Fuel in Pressurized Water Reactors

              LIU CHANYUN

           Master of Science Thesis
         Reactor Physics Department
         Royal Institute of Technology

           Stockholm, Sweden 2008
TRITA-FYS 2008:05
ISSN 0280-316X
ISRN KTH/FYS/--08:05--SE
© Liu Chanyun, 2008
Printed by Universitetsservice US-AB, Stockholm 2008
2Abstract
The purpose of this thesis is to study the feasibility of a high content thorium
fuelled pressurized water reactor. The focus is on the neutronic behaviors.
Thorium based fuel design options with four different fissile components are
investigated. Standard uranium oxide is used as the reference fuel. The analysis is
performed using the statistical codes MCNP and MCB.
First, the fuel compositions are adjusted to obtain the required discharge burnup 55
MWd/kgH.M. under a fixed power density. Next, neutron spectrum, power profile,
reactivity coefficients as well as kinetic coefficients are studied.
The calculation shows a significant reduction of the quantity and quality of
plutonium can be achieved if 233U or MEU is used as the fissile component.
Plutonium is the main source of proliferation potential and radiotoxicity generated
during the irradiation of the standard UOX fuel. At the same time, although the
coolant temperature coefficient for thorium with 233U as fissile component is
slightly positive, negative feedbacks from fuel and coolant are large enough for the
safety issues during normal operation. If 233U and LWR spent fuel grade
plutonium is mixed properly and used as the fissile component, the breeding ratio
can be about 1. The neutron spectrum created in this case is more thermal than that
in case of thorium fuel with plutonium as fissile material. All the coefficients are
in reasonable range. Especially, the coolant temperature coefficient is negative.
Last, a simple shutdown study was carried out. The shutdown margin is enough in
both hot shutdown events and cold shutdown events.
As a conclusion, thorium fuel has similar behavior as uranium fuel in PWRs.
Nevertheless, thorium fuel has more negative Doppler coefficient.
34
Table of Contents
Abstract .....................................................................................................................3
Table of Contents ......................................................................................................5
Acknowledgements...................................................................................................7
1. Introduction........................................................................................................9
  1.1. Motivation and Objectives .......................................................................11
  1.2. Characteristics of Thorium Fuel...............................................................12
  1.3. History and Current State of Thorium Fuel Research..............................13
2. Methodology....................................................................................................15
  2.1. Monte Carlo Calculation Method.............................................................15
  2.2. Geometry Description of the Models.......................................................16
  2.3. Fuel Composition .....................................................................................19
3. Results..............................................................................................................21
  3.1. Burnup Calculation ..................................................................................21
    3.1.1.       Evolution of Multiplication Factor...................................................21
    3.1.2.       Nuclide Mass Change.......................................................................23
  3.2. Neutron Spectrum ....................................................................................29
  3.3. Power Profiles ..........................................................................................31
  3.4. Reactivity and Kinetic Coefficients .........................................................34
    3.4.1.       Fuel Temperature Coefficient ..........................................................35
    3.4.2.       Coolant Temperature Coefficient.....................................................36
    3.4.3.       Coolant Void Worth .........................................................................38
    3.4.4.       Reactivity coefficient of Boron Concentration ................................40
    3.4.5.       Prompt and Delayed Neutrons Parameters.......................................41
                 233
  3.5. (Th, U, Pu)O2 fuel ................................................................................43
  3.6. Shutdown Margin Check..........................................................................45
4. Conclusions......................................................................................................47
Bibliography............................................................................................................49
APPENDIX .............................................................................................................50

                                                              5
6
Acknowledgements

I would like to give my appreciations to
   • My supervisor Janne Wallenius, for his kindness and vast patience. He has
       been the great source of knowledge, encouragement and guidance.
   • Jan Dufek, for his enthusiastic help in both MCNP-input and
       computerization.
   • Waclaw Gudowski, for giving me the opportunity to come to study at the
       Royal Institute of Technology.

I also would like to thank all other the members in the reactor physics department
and friends met in Sweden. You made my life here more exciting and wonderful.

I am also grateful to my family, for their support and love.

                                           7
8
1. Introduction
The research in nuclear field and the nuclear industry has become more and more
active nowadays after more than 20 years sleeping period due to the incidents in
Three Mile Island (1979) and Chernobyl (1986). Between 1970’s and 1980’s, a lot
of countries planed to change energy to nuclear energy because nuclear energy can
help them to satisfy the objective of independence, diversity and security of energy
supply. The installed nuclear capacity rises from less than 1 GW in 1960 to more
than 300 GW in the late 1980’s. Figure 1 shows the history of the global nuclear
power industry. But the two incidents mentioned above made the public scared to
nuclear technology and wanted to shut down the nuclear reactors. A lot of plants
planed were cancelled after these two accidents.

Figure 1: History of the global nuclear capacity and reactors in power industry [1]

As of August 8th, 2007, there are 439 nuclear power reactors in operation in 31
countries in the world shown in Figure 2 and tabulated in Table 1, providing 17%
of the world electricity. Most of the reactors are uranium fuelled and light water

                                         9
moderated. The nuclear technology performs safely, reliably and environment
friendly.
Table 1: Operational Reactors by Type
Type No. of Units Total MW(e)
PWR 265 243233
BWR 94 84958
PHWR 44 22367
GCR 18 9034
LWGR 16 11404
FBR 2 690
Total 439 371686
PWR (Pressurized Water Reactor), BWR (Boiling Water Reactor), PHWR
(Pressurized Heavy-Water Reactor), GCR (Gas Cooled Reactor), LWGR (Light-
Water-cooled Graphite-moderated Reactor), FBR (Fast Breeder Reactor)
Reactors in operation worldwide
UNITED STATES OF 104
FRANCE 59
JAPAN 55
RUSSIAN FEDERATION 31
KOREA, REPUBLIC OF 20
UNITED KINGDOM 19
CANADA 18
GERMANY 17
INDIA 17
UKRAINE 15
CHINA 11
SWEDEN 10
SPAIN 8 Number
BELGIUM 7
CZECH REPUBLIC 6 Capacity
SLOVAK REPUBLIC 5
SWITZERLAND 5
FINLAND 4
HUNGARY 4
ARGENTINA 2
BULGARIA 2
BRAZIL 2
SOUTH AFRICA 2
ROMANIA 2
PAKISTAN 2
MEXICO 2
SLOVENIA 1
NETHERLANDS 1
LITHUANIA, REPUBLIC 1
ARMENIA 1
0 20 40 60 80 100 120
Figure 2: Number and Capacity of reactors in operation worldwide
Note1: world totally 439 reactor units including 6 reactors in Taiwan, China.
Note2: 5 long-term shutdown units are not counted.
Note3: data for capacity (in unit of GW) has been divided by a factor of 1000.
10As the investigation about the two accidents and the nuclear technology develops,
the public currently knows and learns more about nuclear technology than before.
Other important events are the growing demand for energy as well as the concerns
for environment. Unlike fossil fuel power plants, nuclear power plants do not
produce greenhouse gas and it is of minimal environmental impacts. It also has
competitive economics, comparing with renewable energy, such as wind power,
solar power and so on. All of these aspects will provide an important role to the
nuclear power. Scientists and engineers as well as the public turn their attention to
the nuclear technology again. One of the most important and popular international
project is the one so called Generation IV cooperating among United State, United
Kingdom, Switzerland, South Korea, South Africa, Japan, France, Canada, Brazil,
Argentina and European Union. The international project Generation IV is aimed
to design new nuclear energy system with advanced safety, nonproliferation,
highly competitive economics and minimal waste as well as natural resource
utilization. Six systems were selected to develop in 2002. The investigation is
currently carried out. Nevertheless, most of these designs are generally not
expected to be available for commercial construction before 2030.
1.1. Motivation and Objectives
Thorium discovered by Swedish chemist Jons Jakob Berzelius in 1828 is a
naturally occurring, widely distributed, easily exploitable, slightly radioactive
metal. It occurs mainly as 232Th isotope. The most common thorium mineral is the
thorium phosphate monazite. It is about 3 to 4 times more abundant than uranium.
Table 2 gives the thorium resources worldwide estimated by GeoScience,
Australia in 2006. The reserve is expected to be larger than stated in Table 2. It
can be about 4.5 million tons as given by IAEA-NEA ‘Red book’ in 2005.
In fact, some experimental power reactors based on thorium fuel were successfully
operated during 1950’s to 1980’s. Nevertheless so far, thorium fuelled reactor
hasn’t been commercially used in the world which is due to some technology
reasons and the sufficient uranium resources.
Nowadays, additional interest is given to thorium again, because of the
proliferation resistance. The plutonium content of spent thorium fuel can be less
than uranium spent fuels. Or plutonium can be burn if it is used as the initial fissile
material. Furthermore, the thorium fuel cycle can improve the quality and quantity
of the spent fuel. It can reduce the long-lived minor actinides production and the
radiotoxicity level.
11Table 2: Estimated thorium resources worldwide
Percent of
Country Tons
the world
Australia 452 000 18
USA 400 000 16
Turkey 344 000 14
India 319 000 13
Venezuela 300 000 12
Brazil 221 000 9
Norway 132 000 5
Egypt 100 000 4
Russia 75 000 3
Greenland 54 000 2
Canada 44 000 2
South Africa 18 000 1
Other countries 33 000 1
Total 2 492 000 100
The present work is to study the feasibility of high content thorium fuels in
pressurized water reactors which takes up more than 60 percent of the nuclear
plants in the world. The focus is on the neutronic behaviors of thorium fuel with
different fissile drivers and to find a better choice.
1.2. Characteristics of Thorium Fuel
The fertile isotope 232Th which is like isotope 238U can absorb a neutron and
become 233Th. Then it decays to 233Pa by β decay. Fissile isotope 233U is created
by β decay of 233Pa. 233U is a fissile isotope as 235U. So, in theory, an efficient
breeding cycle can be set up if some fissile material is used as the driver at the
beginning.
Th + n →
232 233
Th
β
Th ⎯⎯
233
→ 233 Pa (1)
β
233
Pa ⎯⎯
→ 233
U
12The high thermal capture cross section of thorium will require more amount of
initial fissile material as a compensatory. It will reduce the neutron capture in
moderator. In addition, the neutron yield as well as fission probability of 233U in
thermal energy region is higher that of 235U and 239Pu. Hence, thorium fuel can
have higher thermal neutron utilization factor. Besides, thorium oxide has an
extremely high melting point about 3300 oC.
The challenge is that, 233U is always associated with 232U. 232U and its daughter
products have strong gamma radiations which makes the process, fabrication and
handing of fuel containing 233U extremely difficult.
1.3. History and Current State of Thorium Fuel Research
There has been about 40 year’s study on thorium fuel cycles. Nevertheless, the
study is on a smaller scale compared to uranium fuel cycles or plutonium fuel
cycles. It is being studied in fast reactors, light water reactors and high temperature
reactors. Basic research and development has been conducted in the USA,
Germany, India, Russia, Japan and the UK. Several test reactors have been
partially or completely loaded with thorium fuel.
The project Dragon reactor in UK, cooperating among the UK, Austria, Denmark,
Sweden, Norway and Switzerland has been operated for 741 full power days from
1964 to 1973. The AVR experimental pebble bed reactor based on thorium fuel in
Germany was operated between 1967 and 1988. The maximum burnup was 150
MWd/kgH.M.. The operating time was over 750 weeks and around 95% of the
time was using thorium fuel. Another thorium fuelled reactor is General Atomics'
Peach Bottom high-temperature, graphite-moderated, helium-cooled reactor
operated at 110 MWth between 1967 and 1974 in the USA.
The only commercial thorium fuel based plant is the Fort St Vrain reactor in the
USA. It was a high temperature, graphite-moderated, helium-cooled reactor and
has been operated from 1976 to 1989.
Thorium fuelled Pressurized Water Reactors were investigated at Shippingport in
the USA. The initial fissile materials are both 235U and plutonium. Thorium fuelled
light water breeder reactors (LWBR) were successfully tested from 1977 to 1982.
The test LWBR was using 233U as fissile material.
Another reactor, Kakrapar-1 in India, was the first reactor in the world to achieve
power flattening across the reactor core using thorium, rather than depleted
uranium. It achieved about 300 days of full power operation in 1995. The Kamini
13experimental neutron-source research reactor started up in 1996 in India is Fast
Breeder Test Reactor with the thermal power of about 30 kW. The initial fissile
material is reprocessed 233U from spent thorium oxide fuel. Kaiga-1 and 2 and
Rajasthan-3 and 4 reactors in India were planned to use thorium. A thorium fuel
utilization program in a large scale nuclear is being carried out in India nowadays.1
There are currently four projects conducted by the U.S. Department of Energy.
They are based on a proliferation resistance and a high burnup of thorium in light
water reactors.
It is obvious that more and more interests are given to thorium nowadays. In
theory, it can be good solutions for both proliferation resistance and nuclear waste
management. It also can be a good way to increase the resource for nuclear
technology.
1
Reference: IAEA, “Thorium fuel cycle-Potential benefits and challenges”, Vienna, Austria, May 2005.
142. Methodology
All the calculations in this thesis were performed using MCNP and MCB. Two
models have been used in these calculations: single pin model and assembly model.
2.1. Monte Carlo Calculation Method
MCNP, standing for Monte Carlo N-Particle Transport Code System, is developed
at the Los Alamos National Laboratory. It is a general purpose, generalized-
geometry, continuous energy, and time-dependent Monte Carlo transport code.
It solves problems by simulating particle collisions including scattering,
absorption and fission. The particle can be neutrons, electrons or photons. MCNP
and MCB can be used in any arbitrary geometry defined by surfaces. The energy
range is from 10-5 eV to 20 MeV for neutron transport problems. Not only the
multiplication factor, but also neutron flux, particle current and other quantities
can be calculated.
The MCB code is used for burnup calculations. MCB stands for the Monte Carlo
Continuous Energy Burnup code. The code calculates the neutron flux and
material composition at the beginning of each time step which is defined by time
point card. Then the probabilities of all particle collisions of each nuclide with
continuous energy cross section are evaluated. New material densities and
composition are updated after the evaluation for the calculation in the next step.
Monte Carlo method is a statistical method. It is particularly useful for complex
problems that cannot be solved by deterministic method codes. The result is the
average behaviors of all the particles. The results got from the calculations are
with statistical errors. In order to make the error small enough, the number of
neutrons per cycle and the number of the cycles should be large enough. Because
the code simulates each particle, it takes a long time for each calculation.
In the present work, the cross section library JEFF3.1 has been used, with some
lacking nuclides taken from other libraries in the MCBXL collection.
152.2. Geometry Description of the Models
The pin cell level calculation is performed in a fuel pin with coolant and zirconium
cladding in a radial infinite lattice. The coolant and moderator are light water. The
geometrical description and schematic view of the pin cell is given in Figure 3. No
gas gap between fuel pellet and cladding is assumed. Reflecting boundary
condition in radial direction is assumed. Table 3 describes the construction
materials and moderator. No thermal expansion is assumed for construction
material. Hence, the densities of construction materials of the fuel rods and control
rod guide thimbles (G/T) as well as instrumentation thimble (I/T) are independent
on the temperature.
Figure 3: Schematic of cross section and parameters of the pin cell
Table 3: Density of zirconium clad and moderator
Construction Moderator
Type Material Material
Density (g/cc) 6.5510 6.5896 i 10-1
Atomic
Number
4.29826 i 10-02 6.60826 i 10-2
Density
(#/barn/cm)
Structural material: cladding
Remarks
Boron concentration: 500 ppm
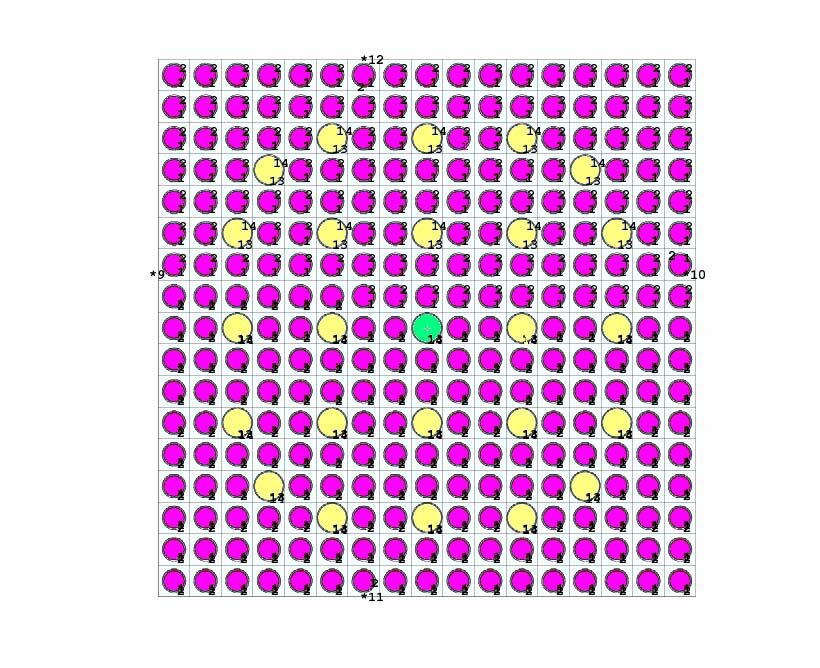
16The assembly employs the standard 17x17 PWR lattice. There are 264 fuel rods,
24 control rod guide thimbles and 1 instrumentation thimble. The fuel rod
structure is the same as that of in the pin cell model.
The geometrical description and schematic view is presented in Figure 4. The
magenta parts in Figure 4 are fuel rods. The cream-colored parts are the control
rod guide thimbles (G/T), and the cyan one is the instrumentation thimble (I/T).
Figure 4: Radial cross section of assembly
G/T and I/T are filled with water during burnup calculations. Control rods are
inserted to G/T during cold shutdown calculations. The details of the assembly are
shown in Table 4.
Construction and moderator materials are the same in both pin cell and assembly
models. They are tabulated in Table 3.
Isotopic composition of Zr cladding is given in Table 5. The temperature in each
region is shown in Table 6.
17The power density in both pin cell model and assembly model are 179 W/cm per
rod. Hence, the power output is 65.5 kW in pin cell model and 17.3 MW in
assembly model. 500 ppm boron is added to the coolant, corresponding to the
average concentration over the cycle.
Table 4: Geometry details of the assembly2
Description Size (cm)
Assembly
21.505
pitch
Fuel rod pitch 1.265
Pellet outer
0.824
diameter
Cladding inner
0.824
diameter
Cladding outer
0.952
diameter
G/T, I/T inner
1.140
diameter
G/T, I/T outer
1.220
diameter
Table 5: Atomic number densities for Zr cladding
Atomic number density
Isotope
(#/barn/cm)
90
Zr 2.2251 i 10-02
91
Zr 4.8524 i 10-03
92
Zr 7.4170 i 10-03
94
Zr 7.5156 i 10-03
96
Zr 1.2109 i 10-03
2
All the geometric data for both pin cell model and assembly model are estimated from open sources
18Table 6: Temperature of each region for normal operation
Region Temperature (K)
Fuel pellet 900
Cladding 600
Moderator 600
2.3. Fuel Composition
The discharge burnup is set to be 55 MWd/kgH.M.. Three different fissile fuel
components are used as the drivers in the thorium fuel. These are the reprocessed
233
U and LWR spent fuel grade plutonium as well as medium enriched uranium.
The processed 233U is 100% 233U. The medium enriched uranium (MEU) is 20%
enriched 235U and 80% 238U. Table 7 shows the LWR spent fuel grade plutonium
(rgPu) composition. Thorium fuel options with these fissile fuel components are
expressed as (Th, 233U)O2, (Th, MEU)O2 and (Th, Pu)O2. The standard uranium
oxide fuel (UOX) is used as a reference fuel.
Table 7: LWR spent fuel grade Plutonium
Weight
Nuclide
Percent
238
Pu 2.5
239
Pu 54.2
240
Pu 23.8
241
Pu 12.6
242
Pu 6.9
The initial fraction of fissile material is adjusted to obtain a multiplication factor of
1 at a burnup of 33 MWd/kgH.M. which corresponds best to the core average. The
thorium fuel composition is presented in Table 8. The densities are derived by
smearing dish and chamfer of fuel pellet and by assuming 95% theoretical
densities.
The 235U content in (Th, MEU)O2 fuel model is higher than 235U content in UOX
fuel model. It is due to the higher capture cross section of 232Th in thermal energy
19region, which will make fewer neutrons can be absorbed by the fissile isotope. As
a compensatory of this function, the amount of fissile material should be increased.
Table 8: Initial Fuel Composition
Weight Weight
Density Percent in Percent in
Fuel Type Nuclide
(g/cc) Pin Cell Assembly
Model Model
233
233 U 3.54 3.66
(Th, U)O2 9.15 232
Th 96.46 96.34
rgPu 8.99 8.56
(Th, Pu)O2 9.24 232
Th 91.01 91.44
MEU 26.80 25.93
(Th, MEU)O2 9.35 232
Th 73.20 74.07
235
U 4.40 4.25
UOX 10.0 238
U 95.60 95.75
203. Results
In the result part, the main results of the thesis are presented. The burnup result
shows the nuclide mass change and the composition of spent fuel. Neutron
spectrum and power profile are also presented. The important parameters for
safety including fuel temperature coefficient, coolant temperature coefficient and
delayed neutron fraction are also calculated. Finally, a simple shutdown event is
simulated to check the sufficiency of the shutdown margin.
3.1. Burnup Calculation
Plutonium fuel undergoes 2 years of nature decay before it is irradiated in the core.
The effective fuel power days (EFPD) are calculated to satisfy the discharge
burnup of 55 MWd/kgH.M. under the fixed power density 179 W/cm per fuel rod.
Multiplication factor is calculated in MCB. At the same time, neutron spectrum
and power profile are also estimated. The spent fuel composition can be found in
the output file.
3.1.1. Evolution of Multiplication Factor
The evolution of multiplication factor (K ∞ ) for three thorium fuels and reference
UOX fuel is shown in Figure 5. 3
K ∞ for the fresh fuel varies from 1.1 to 1.4. K ∞ of (Th, 233U)O2 fuel is the largest
while K ∞ of (Th, Pu)O2 fuel is the smallest. This is because 233U fission easier
than 235U and 239Pu. The fission probability presented in Figure 6 is the ratio of the
fission cross section to the total cross section. The thermal fission probability for
233
U is about 0.92, while it is for 235U is 0.84 and 0.76 for 239Pu, 0.70 for 241Pu.
3
Solid line is for assembly model and dashed is for pin cell model in most of the figures in the results part.
21Figure 5 Multiplication factor K ∞ as a function of burnup
Fission probability
1
0.9
0.8
0.7
0.6 U233
U235
0.5
Pu239
0.4 Pu241
0.3
0.2
0.1
0
1.00E-05 1.00E-03 1.00E-01 1.00E+01 1.00E+03 1.00E+05 1.00E+07
E (eV)
Figure 6: Fission probability
22K ∞ for all the fuels decreases with time due to the depletion of the fissile isotopes
and the production of the fission products and poisons. The sharp decrease at the
beginning is due to the release of 135Xe. 135Xe has a big neutron capture cross
section and it has impact on the thermal utilization factor and thus multiplication
factor. It is an important poison in reactor operation.
K ∞ decreases to 1 at burnup of 33 MWd/kgH.M.. The decrease of K ∞ for (Th,
Pu)O2 fuel model is the smallest. From the evolutions of K ∞ , we see that (Th,
233
U)O2 fuel can have the same K ∞ as UOX fuel if the enrichment of 233U is
decreased. If K ∞ for (Th, Pu)O2 fuel, UOX fuel and (Th, 233U)O2 fuel are the same
at the beginning, the average K ∞ of (Th, Pu)O2 should be the largest during the
irradiation.
3.1.2. Nuclide Mass Change
Figure 7 shows the mass change of fissile isotopes as a function of burnup. And
the consumption of fissile isotopes is presented in Figure 8. The fissile isotopes
included in Figure 7 and Figure 8 are 233U, 235U, 239Pu and 241Pu. As mentioned
before, the decrease of fissile material and the production of fission products lead
to the reactivity drop. One can see from Figure 7 and Figure 8 that the amount of
fissile isotopes thorium fuel consumes is smaller than the consumption of fissile
isotopes of uranium fuel when they have the same burnup. The amount of fissile
isotopes (Th, 233U)O2 fuel consumes is the smallest.
The change of mass of 233Pa and 233U is presented in Figure 9. The conversion
ratio for (Th, Pu)O2 fuel is close to that for (Th, MEU)O2. The amount of 233U in
(Th, 233U)O2 fuel drops down about 50% at the discharge burnup. The
consumption of 233U in (Th, 233U)O2 fuel is almost as much as the production of
233
U in (Th, Pu)O2 fuel. So it is possible to use (Th, Pu)O2 or (Th, MEU)O2 fuelled
PWRs to supply 233U to (Th, 233U)O2 fuelled PWRs.
Figure 10 presents the change of mass of 235U as a function of burnup. It is
obvious that (Th, MEU)O2 fuel need more uranium resource to concentrate than
UOX fuel does when the same discharge burnup is required, which also can be
seen from Table 8. About 78% 235U is depleted in (Th, MEU)O2 fuelled PWRs and
83% in UOX fuelled PWRs. Hence, the utilization efficiency for 235U is higher for
UOX fuel.
23Figure 7: Mass change of fissile isotopes
Figure 8: Fissile nuclide consumption at discharge burnup 55 MWd/kgH.M.
24Figure 9: mass changes of 233U and 233Pa
Figure 10: mass changes of 235U
25239
Pu is formed through the capture of a neutron in 238U and two consecutive β
decays of 239U to 239Np and of 239Np to 239Pu. Neutron capture reactions in 239Pu
form 240Pu. Heavier plutonium nuclides are formed from subsequent captures, and
eventually higher actinides are formed through further captures and β decays.
Because transuranium nuclides, whose atom numbers are higher than 92, have
long half-lives and strong radiation, they are the main contributors giving the
largest contribution to the radiological hazard for the first one million years in
storage of nuclear waste. For example, plutonium, americium and curium have
strong α - decaying. The half-lives of important actinides are shown in Table 9.
Table 9: Half-lives of important actinides, JEFF-3.1 data
Nuclide Half life
238
Pu 87.7 a
239
Pu 24100 a
240
Pu 6560 a
241
Pu 14.3 a
242
Pu 3.74 .105 a
241
Am 433 a
242m
Am 141 a
243
Am 7360 a
242
Cm 163 d
243
Cm 30.0 a
244
Cm 18.0 a
245
Cm 8500 a
Table 10 displays the utilization of plutonium, americium and curium in both pin
cell model and assembly model. Negative value indicates nuclide is produced. The
mass changes for plutonium, americium and curium in (Th, 233U)O2 fuel are
around zero. And plutonium is the most important for nuclear weapon. (Th,
233
U)O2 fuel has the biggest proliferation resistance and it can improve the quality
of the nuclear waste. The mass of plutonium in UOX increases about 1.8 times
more than it does in (Th, MEU)O2 fuel. Accordingly, UOX model produces 1.7
times amount of Am more than (Th, MEU)O2 does and 2.7 times for Cm. (Th,
Pu)O2 model can reduce around 3 times the amount of Pu created in UOX fuel
model, whereas it produces around 5 times the amount of Am and 9 times the
amount of Cm as the UOX model.
26Table 10: Consumption of Pu, Am and Cm
Nuclide Fuel Type Pin Cell (g) Assembly (g)
(Th, Pu)O2 74.25 19474.90
(Th, MEU)O2 -8.75 -2009.30
Pu
(Th, 233U)O2 -0.01 -1.96
UOX -25.03 -5810.60
(Th, Pu)O2 -3.47 -860.90
(Th, MEU)O2 -0.24 -58.40
Am
(Th, 233U)O2 0.00 0.00
UOX -0.65 -162.80
(Th, Pu)O2 -2.84 -694.38
(Th, MEU)O2 -0.08 -20.34
Cm
(Th, 233U)O2 0.00 0.00
UOX -0.30 -74.36
Figure 11 and Figure 12 show the change of mass of important actinides in four
fuel models. And the data in Figure 11 and Figure 12 for pin cell model has been
multiplied by a factor of 264. It is obvious from Figure 11 and Figure 12 that the
mass of 238Pu and 240Pu decrease only in (Th, Pu)O2 fuel model and the created
amount of 243Am and 244Cm are the largest in (Th, Pu)O2 fuels.
Thus, it can be seen that thorium fuel can improve the quantity and quality of
nuclear waste. And it also is proliferation resistant.4
4
In fact, thorium fuels are only proliferation resistant as long as they are used in a mixed neutron spectrum
(like the PWR). In a well thermalized spectrum where (n,2n) reactions on 233U are absent, one may breed
clean 233U without production of 232U.
27Figure 11: mass changes of Pu in four fuel models
Figure 12: mass changes of Am and Cm in four fuel models
283.2. Neutron Spectrum
The neutron spectrum can be calculated by F4 tally in MCNP. The definition of F4
tally used in this thesis to get the spectrum is presented in Equation (2). Figure 13
and Figure 14 show the neutron spectrum in the fuel got from assembly calculation.
SN
F 4 = ∑ ρn (2)
n =1
Where SN is the total number of simulated neutrons and ρ n is the total length of
trajectory of nth neutron simulated in volume V.
Figure 13:.Neutron spectrum in the fuel average over the assembly.
29Figure 14:.Flux weighted neutron energy spectrum average over the assembly in
the four fuel models at burnup of 33 MWd/kgH.M..
As the fuel compositions are changing, the spectrum shifts a little versus burnup. It
stands to reason, that uranium fuelled model breeds a more thermal spectrum than
the plutonium fuelled model does. It is because plutonium fuel has higher total
microscopic cross sections and the fissile isotopes of plutonium have some wide
resonances in the epithermal energy region. (Th, 233U)O2 fuelled model generates
the most thermal spectrum than (Th, MEU)O2 fuelled model and UOX fuelled
model do. The reason is similar that the total microscopic cross section of thorium
is higher than uranium. The higher total cross section and the wider resonance
result in a stronger spectrum depression. It is clearly visible, that there are two dips
between 0.1 and 1.1 eV in spectrum of (Th, Pu)O2 model, which correspond to the
high cross sections peaks at those energy regions of 238Pu and 240Pu, respectively.
The cross section is displayed in Figure 15 and Figure 16.
30Figure 15:.Microscopic Capture Cross Section of fertile isotopes
Figure 16: Microscopic fissile Cross Section of fissile isotopes
3.3. Power Profiles
The F6 tally in MCNP is used to estimate the average energy deposition over a cell.
The cross section of the assembly is symmetrical in respect to origin. Hence, the
radial power distribution is also symmetrical in respect to origin. The power
distribution in the selected positions, which are shown as the red rods on the left
31side of Figure 17, is used to express the radial power distribution.5 The right side
of Figure 17 is the vertical cross section of the assembly. 24 surfaces are used to
divide the assembly into 26 vertical cells. The energy deposition in each vertical
cell is calculated. And the axial power distribution is expressed using the energy
distribution in vertical cells.
Figure 17: Assembly with radial and axial section
The power distributions are important for thermal hydraulic analysis and safety
analysis. One of the parameters are the power peaking factors presented in
Equation(3), (4) and(5). It is the highest local power density to average power
density. The positions of the control rod and fuel optimization are also designed
based on the peaking factors. The power peaking factors shouldn’t be too large in
order to prevent fuel rod melting. The detailed three dimensional core power
distributions are monitored in operating reactors.
Figure 18 and Figure 19 display the radial power profile and axial power profile in
assembly at burnup 33 MWd/kgH.M., respectively. Since the statistical error is
5
The result is only an indication. But this analysis is not complete. Because there is one bundle symmetry
and that is octant. The power in all pins belonging to one octant should be calculated to correctly determine
the radial peaking factor. The analysis here does not catch the possibility that the maximum pin power
occurs at a pin outside this line. Due to the time limit, a complete analysis is not performed.
32very large, the shape of the profile doesn’t look so regular. But they are sufficient
to figure the power profile in assembly. Several spikes appear because of the
empty thimbles. There is no power output there. It is assumed the factors around
the empty thimbles equates to the value nearby in Figure 18 and Figure 19. The
empty thimbles make the power distribution more evenly.
r
Pmax
Fr = r
(3)
Pave
a
Pmax
Fa = a (4)
Pave
Ft = Fr × Fa (5)
Figure 18: radial power peak to average factor
33axial power profile
1.4
axial peak to average factor
ThMEU
1.2
ThPu
1 ThU
0.8
UOX
0.6
0.4
0.2
0 50 100 150 200 250 300 350 400
axial position (cm)
Figure 19: axial power peak to average factor
The minimum factor in radial direction occurs at the boundary of the assembly due
to leakage. But the minimum axial factor isn’t at the bottom or at the top of the
assembly, especially for (Th, Pu)O2 fuel. It is because of the reflector above the
top of the assembly and that under the bottom of the assembly. The maximum
power peaking occurs at the middle of the assembly. The axial peaking factors are
around 1.40. In order to fulfill the safety limits, control rods or burnable poison
can be added to the reactor to modify the power profile.
The place of the peaking factor will lead to an enhanced thermal stress and the
local fuel depletion is higher. Hence, the local power profile will cause the local
fuel inventory change. Then the difference will change the power profile. Hence,
the power profile is shifting during fuel is burn. The most even power profile will
usually be achieved at the discharge burnup.6
It can be seen from Figure 18 and Figure 19 that, uranium fuel has a smoother radial
power profile while it also has a larger axial power peaking factor than plutonium
fuel. (Th, 233U)O2 has the largest axial power peaking factor.
3.4. Reactivity and Kinetic Coefficients
6
Due to the way to describe the material in calculation, this effect on the power profile hasn’t been studied
in this thesis.
34Reactivity coefficients and kinetic coefficients are important safety parameters.
Fuel Doppler coefficient, moderator coefficient, reactivity coefficient of boron
concentration and delayed neutron parameters are calculated in this thesis.
Negative coefficients bring negative feedback which is of importance for reactor
operation. Generally, negative fuel coefficient and coolant coefficient are required.
3.4.1. Fuel Temperature Coefficient
Temperature coefficients include fuel Doppler coefficient and moderator
temperature coefficient.
Fuel Doppler coefficient is the fuel temperature coefficient of reactivity (FTR),
and can be calculated according to Equation(6)
ρT − ρT
2 1
FTR = (6)
T2 − T1
Where the reactivity ρ is can be expressed as Equation(7)
keff − 1 1
ρ= = 1− (7)
keff keff
FTR is also called prompt reactivity coefficient. It is an inherent, prompt, negative
feedback. Some isotopes have large resonances in the neutron capture cross
sections in the epithermal energy region. When the temperature increases, the
thermal movement of heavy nuclei becomes more vehement. The Doppler Effect
between the moving nuclei and the incoming neutron will make the resonance
peaks in capture cross section broadened. The probability of neutron capture
increases which will decrease the reactivity. In the epithermal energy region, the
microscopic fission cross-section will increases in the same way as for capture
cross section if the material temperature increases, Nevertheless, for fertile
nuclides the absolute increase in capture cross section is much larger than the
absolute increase in fission cross section, which will grow on the reduction of
reactivity. So, Doppler coefficient is dependant on the fuel composition.
In order to calculate the Doppler coefficient, multiplication factors are calculated
at fuel temperature of 900 K and 1200 K respectively. Coolant temperature and
cladding temperature are 600 K. Figure 20 displays FTR as a function of
temperature. The unit is pcm/K.
35Figure 20:.Fuel temperature coefficient with statistical error versus burnup
All the Doppler coefficients are negative. They are in the expected range. It is
clearly visible that, thorium fuel has more negative Doppler coefficient than
uranium fuel has. The reason is that, resonance broadening is more effective in
232
Th than in 238U, which gives the more negative Doppler coefficient. (Th, Pu)O2
has larger negative Doppler coefficient than (Th, 233U)O2 has. Nevertheless, (Th,
MEU)O2 has the largest negative Doppler coefficient while UOX has the least
negative values.
3.4.2. Coolant Temperature Coefficient
Moderation temperature coefficient (MTC) is an important parameter for fuel and
core design in terms of light water reactor safety criteria. It is delayed temperature
coefficient comparing with FTR. It can be calculated analogically to the FTR,
according to Equation(6) and(7).
The coolant flowing through the reactor is at a temperature of roughly 315 °C, the
pressure in the primary coolant loop is usually around 15 MPa at which the
saturated temperature is 342 °C. MTC is calculated by using the perturbation card
of MCNP. Multiplication factor is calculated when fuel temperature is 900 K and
coolant temperature is 600 K. 20 K decrease of coolant temperature is introduced
36by using perturbation card. In fact, the perturbation card changes the coolant
density at 600 K, 15 MPa to coolant density at 580 K, 15 MPa. The change of the
multiplication factor is calculated automatically. Figure 21 displays MTC as a
function of burnup. The unit is pcm/K.
Figure 21:.Moderate temperature coefficient versus burnup
The coolant temperature coefficients for (Th, Pu)O2, (Th, MEU)O2 and UOX are
reasonable. The most interesting thing is that the coolant temperature coefficient
of (Th, 233U)O2. It is about 10 times smaller than that of the (Th, Pu)O2 or UOX. It
is slightly positive in assembly model. Reason can be found from the fission
probabilities of 235U and 233U. The fission cross section of 235U decreases
obviously in the region of 0.1ev to 1 eV of neutron energy, but the fission cross
section of 233U has an obvious increase after the decrease, and it doesn't decrease
greatly. The ratio which is fission cross section over the total cross section of 235U
shown in Figure 6 decreases about 10 times larger than for 233U. Hence the fission
probabilities of 235U decreases 10 times larger than for 233U when temperature
increases, the K ∞ of UOX fuel decreases 10 times larger than for (Th, 233U)O2 fuel.
MTC doesn’t change linearly with burnup. It is due to the fuel composition and
mass change, then the fuel to moderator ratio changes during burnup.
373.4.3. Coolant Void Worth
The coolant void worth (CVR) is the reactivity introduced when the coolant is
removed. It can be calculated according to Equation(8)
CVR ≈ keffvoid =1 − keffvoid =0 (8)
K ∞ is calculated separately when void is 1 and when void is 0 using MCNP. Use
K ∞ from the calculations to calculate the coolant void worth.
Figure 22 presents the coolant void worth as a function of time. The unit is pcm.
One of the units of CVR is dollar ($). It normalizes the reactivity to the delayed
neutron fraction show in Equation(9). If the reactivity is 1 $, the reactor is prompt
critical which means it can be critical without delayed neutron. And the lifetime
for prompt neutron is very short. So it can’t be controlled. Hence, the reactivity
should be less than the delayed neutron fraction.
1$ = β (9)
Figure 22:.Coolant void worth versus burnup( boron concentration: 500 ppm)
From Figure 22 we can find the absolute values of CVR decrease as burnup
increases. The coolant is void, which means there is no moderator. The neutrons
38are not slowed down and the energy of the neutron increases, the neutron spectrum
becomes harder. It will make the fission cross section of some isotopes smaller
and the multiplication factor decreases. During burnup, more and more fission
products are produced. These kinds of isotopes will enhance the decrease of the
multiplication factor. The large negative value of CVR is reasonable. Large CVR
is actually a foundation for the safety of PWRs. (Th, 233U)O2 fuel has the largest
CVR while (Th, Pu)O2 has the smallest CVR and CVR for (Th, Pu)O2 doesn’t
change a lot.
Figure 23 presents CVR versus boron concentration. The Red line, Magenta line
and Blue line represent boron concentrations at 5 ppm, 500 ppm and 1200 ppm,
respectively. The solid line and dotted line represent assembly and pin cell model.
Figure 23:.Coolant void worth versus boron concentration
Red line: boron concentration is 5 ppm, Magenta line: boron concentration is 500
ppm, Blue line: boron concentration is 1200 ppm, Solid line: assembly, Dotted line:
pin cell, Plus sign: (Th, Pu)O2, Cross : (Th, MEU)O2, Asterisk: (Th, 233U)O2, point:
UOX.
It is clear to see, CVR is dependant on the concentration of boron and the absolute
value of CVR is larger when boron concentration is small. It is because when the
coolant is void, it means no moderators. When boron concentration is small, fewer
neutrons are absorbed by boron and more neutrons are slowed down. So
39multiplication factor during normal operation is larger, hence the CVR is more
negative if boron concentration is smaller.
3.4.4. Reactivity coefficient of Boron Concentration
The boron concentration is different in different kinds of fuel models. But it is 0
ppm at end of cycle (EOC). K ∞ at the beginning of the cycle (BOC) with certain
amount of boron and saturated Xe should equate to K ∞ at EOC with zero
concentration of boron. The boron concentration is adjusted according to this point.
The boron concentrations for different kind of fuel composition are show in Table
11. Reactivity coefficient of boron concentration (BCR) is calculated according to
Equation(10). The results are shown in Figure 24.
Table 11: Boron concentration at BOC
Pin Cell Assembly
Type
(ppm) (ppm)
(Th, Pu)O2 1251 1055
(Th, MEU)O2 840 719
(Th, 233U)O2 1186 1051
UOX 1327 1071
ρ C1 − ρ C 2 1 1 1
BCR = = × ( c 2 − c1 ) (10)
C1 − C 2 C1 − C 2 keff keff
Where C1 is the values presented in Table 11 and C2 is 100 ppm less than C1 .
40Reactivity Coefficient of Boron Concentration
0
-1
-2
-3
-4
pcm/ppm
-5
-6
-7
-8
-9
-10
0 5 10 15 20 25 30 35 40 45
burnup (MWd/kg)
ThPu_A ThMEU_A Th_A UOX_A
ThPu_P ThMEU_P ThU_P UOX_P
Figure 24: Reactivity coefficient of boron concentration versus boron
concentration
Boron is usually used as an absorber in the reactor for reactor regulation. BCR are
negative for all these fuels. (Th, Pu)O2 has the smallest BCR. BCR for (Th, Pu)O2
in the assembly model at burnup 33 MWd/kgH.M.is about -3 pcm/ppm. While (Th,
233
U)O2 fuel in assembly model has the largest value. The reason is that 240Pu has a
much larger capture cross section than 10B has. So thermal absorption in Pu
isotopes compete stronger compared to the other cases, hence the boron worth for
(Th, Pu)O2 is the weakest. BCR becomes more negative as burnup increases A
large negative value can be good for the shutdown capacity.
3.4.5. Prompt and Delayed Neutrons Parameters
Delayed neutrons are important for reactor operation. The neutrons emitted
directly in fission reaction are so called prompt neutron. The neutron emitted by
fission products decay are so called delayed neutron. The delayed neutrons make
the fission reactor possible to be controllable. One of the important parameters is
41the delayed neutron fraction. The effective delayed neutron fraction has been
calculated according to Equation(11) and shown in Figure 25.
k − kp
β eff = (11)
k
Where, k and k p are multiplication factor with and without delayed neutron,
respectively. PHYS card and TOTNU card in MCNP are used to get these two
values.
Effective Delayed neutron fraction
0.008
0.007
0.006
Beta_eff
0.005
0.004
0.003
0.002
0 10 20 30 40 50
Burnup (MWd/kg)
UOX_A ThPu_A ThMEU_A ThU233_A
UOX_P ThPu_P ThMEU_P ThU233_P
Figure 25: Effective delayed neutron fraction versus boron concentration
It is clear from the figure that uranium fuel has the largest effective delayed
neutron fraction. Hence, uranium fuelled core is less easy to make prompt critical.
The effective delayed neutron fractions for (Th, MEU)O2 fuel and UOX fuel
decrease with burnup, and the values for (Th, Pu)O2 fuel and (Th, 233U)O2 fuel
increase slightly with burnup.
423.5. (Th, 233U, Pu)O2 fuel
Based on the results presented above, an investigation on thorium fuel with mixed
233
U and LWR spent fuel grade Pu as fissile material is carried out. The fuel
composition is adjusted to satisfy K ∞ requirement and burnup requirement. And
the mass of 233U in the fuel at discharge burnup equates to that in the fresh fuel.
The density for (Th, 233U, Pu)O2 fuel is about 9.17 g/cc. The weight percent is
about 3.74% for Pu and 2.04% for 233U in pin cell model. In Assembly model, the
value is about 3.77% for Pu and 2.03% for 233U.
233
Figure 26 shows the mass of U and fissile material in (Th, 233U, Pu)O2 fuel
model. Not only the fissile material mass in the fresh fuel is the second smallest,
but also the consumption is the second smallest among all the studied fuel models.
About 70% of 240Pu and more than 90% of 239Pu is depleted. Mass of 238Pu, 241Pu
and 242Pu doesn’t change a lot. The production of Am and Cm is about 15% of
consumption of 239Pu. Figure 34 and Figure 35 show the power profile. Figure 33
shows the neutron spectrum. It is clear from Figure 33 that (Th, 233U, Pu)O2 creates
a thermal spectrum.
Figure 26: Evolution of masses of 233U and fissile material in (Th, 233U, Pu)O2 fuel.
43Table 12, Table 13 and Table 14 show the important neutron parameters and
coefficients. All the parameters are at 33 MWd/kgH.M from assembly model. MCT
of (Th, 233U, Pu)O2 is larger negative than (Th, 233U)O2. It is in a reasonable range.
It has a better value than (Th, 233U)O2 has. CVR of (Th, 233U, Pu)O2 is between the
values of (Th, Pu)O2 and (Th, 233U)O2. The effective delayed neutron fraction of
(Th, 233U, Pu)O2 is larger than the values of (Th, Pu)O2 and (Th, 233U)O2. It is
better for reactor operation.
Table 12: FTR and MTC at 33 MWd/kgH.M in assembly model
Fuel FTR (pcm/K) MTC (pcm/K)
(Th, 233U, Pu)O2 -3.696 -37.828
(Th, Pu)O2 -3.6824 -55.317
(Th, MEU)O2 -4.0214 -48.574
(Th, 233U)O2 -2.9303 -0.401
UOX -2.471 -54.179
Table 13: CVR at 33 MWd/kgH.M. in assembly model
Fuel 5 ppm 500 ppm 1200 ppm
(Th, 233U, Pu)O2 -55515 -52859 -49418
(Th, Pu)O2 -43038 -41431 -39170
(Th, MEU)O2 -49628 -54028 -49630
(Th, 233U)O2 -66856 -62305 -56708
UOX -55878 -52109 -47531
Table 14: Parameters at 33 MWd/kgH.M. in assembly model
BCR
Fuel Beta_eff
(pcm/ppm)
(Th, 233U, Pu)O2 -4.3449 0.00390
(Th, Pu)O2 -3.1787 0.00354
(Th, MEU)O2 -6.3094 0.00505
(Th, 233U)O2 -7.5260 0.00301
UOX -6.4700 0.00450
443.6. Shutdown Margin Check
If a reactor is shutdown, the reactor is subcritical by at least a margin. There are
two kinds of shutdown situation. One is called hot shutdown. The other is called
cold shutdown. In hot shutdown, the fuel temperature is reduced to the coolant
temperature 300 oC, and soluble boron is also introduced into the reactor. After
that, the multiplication factor should be less than 0.99, because at least 1000 pcm
margin is required. The shutdown margin is defined in terms of reactivity. The
units can be pcm or dollar.
Two calculations are done in hot shutdown. The maximum boron concentration
allowed to introduce into the reactor is 2500 ppm. Table 16 shows K ∞ value at
different states.
Table 15: Descriptions of control rods
Parameter Value
Absorber material Ag-In-Cd (80 wt%, 15 wt%, 5 wt %)
Absorber diameter 0.86 cm
Absorber density 10.00 g/cc
Absorber length 366 cm
gas in the gap between
air
absorber and cladding
Gas gap thickness 0.005
Cladding material Stainless Steel
Cladding thickness 0.05 cm
Number of control rod
24
thimble
In cold shutdown, the fuel temperature and the coolant temperature are 300 K.
Cold shutdown is usually done after hot shutdown has been preformed for some
time. The poison Xe has reached the equilibrium. Control rods are inserted into the
guide thimbles. The control rod descriptions are tabled in Table 15. After the
control rods are inserted, there is one month of zero power.
45We can find from Table 16 that, K ∞ for each kind of fuel either at hot shutdown or
cold shutdown is less than 0.99. So, hot shutdown and cold shutdown are safe.
Table 16: K ∞ in different conditions at burnup 22 MWd/kgH.M..
464. Conclusions
Thorium fuel with four different fissile components has been studied in PWRs.
Discharge burnup and power densities similar to UOX fuels are possible to
achieve. Thorium fuel can satisfy the safety and operating requirements. Further
more, thorium fuel has a very good proliferation resistance. The quantity and
quality of the spent fuel can be improved if thorium fuel is utilized in PWRs,
especially (Th, 233U)O2 fuel even doesn’t create minor actinides.
Thorium fuel consumes less fissile material than uranium fuel consumes when
they have the same burnup. The conversion ratio of thorium fuel is higher as well.
And (Th, 233U)O2 fuel has the highest conversion ratio among the three kinds of
thorium fuels here investigated. The breeding ratio of 233U can be equal to one if
Pu and 233U are mixed correctly as fissile component.
Thorium fuel has a more negative Doppler coefficient than uranium fuel has.
Hence, thorium fuel has a larger inherent, prompt feedback. (Th, 233U)O2 fuel has
the most thermal neutron spectrum, the most negative coolant void worth and the
largest shutdown margin, while (Th, Pu)O2 has the hardest neutron spectrum, the
smallest coolant void worth.
MTC of thorium fuel decreases more slowly than UOX fuel does when fuel is
irradiated in core. (Th, 233U)O2 fuel has slight positive coolant temperature
coefficient due to the fission probability of 233U. However, the impact from the
ratio of fuel to moderator hasn’t been studied due to the time limit. Yet, coolant
void worth of (Th, 233U)O2 fuel is the largest negative.
Another drawback of thorium fuel is that the effective delayed neutron fraction of
thorium is smaller than uranium fuel has. Nevertheless, the characters is highly
improved when mixed plutonium and 233U is used as fissile components in thorium
fuel. MTC of (Th, 233U, Pu)O2 is negative, and effective delayed neutron fraction
is close to the value of UOX fuel.
(Th, MEU)O2 fuel has the most negative Doppler coefficient and coolant void
worth. Although, compared to UOX fuel, more uranium resources need to be
concentrated in (Th, MEU)O2 fuel, less fissile material is depleted and the quantity
and quality of the spent fuel is greatly improved.
Shutdown margin are large enough for all the fuel options. It is safe in both cold
shutdown and how shutdown. As a conclusion, it is feasible to use high content
thorium fuel in pressurized water reactor. The neutronic behaviors of thorium fuel
47can be acceptable if proper fissile material is used. Yet, farther study is needed to
find the reasons and more behaviors of thorium fuel. And study in whole core
scale is necessary.
48Bibliography
1. http://www.globalwarmingart.com/wiki/Image:Nuclear_Power_History_png,
data from “Nuclear Power Reactors in the World”, IAEA, April 2006
Edition.
2. http://www.iaea.org/cgi-bin/db.page.pl/pris.oprconst.htm, “Nuclear Power
Plant Information”, last update 15th January 2008.
3. Akio YAMAMOTO, “Benchmark Problem Suite for Reactor Physics Study
of LWR Next Generation Fuels”, Japan, 2002.
4. Dean Wang, “Optimization of a Seed and Blanket Thorium-Uranium Fuel
Cycle for Pressurized Water Reactor”, Massachusetts Institute of
Technology, June 2003.
5. IAEA, “Thorium fuel cycle-Potential benefits and challenges”, Vienna,
Austria, May 2005.
6. Judith F. Briesmeister, “MCNPTM-A General Monte Carlo N-Particle
Transport Code”, Los Alamos National Laboratory Los Alamos, New
Mexico, December 2000.
7. B. Fourest, T. Vincent. “Long-term behaviour of a thorium-based fuel”,
Group de Radiochimie, Institute de Physique Nuclear, France, August 2000.
8. J.C. Gehin and R.T. Primm, “American Nuclear Society Light Water Reactor
Mixed Oxide Benchmark I”, Computational Physics and Engineering
Division Oak Ridge National Laboratory, July 1997.
9. IAEA, “Nuclear Power Reactors in the World”,VIENNA,2006
10. J. Stephen Herring, Philip E. “Low cost, proliferation resistant, uranium-
thorium dioxide fuels for light water reactor”, Advanced Nuclear Energy
Products, Idaho National Engineering and Environment Laboratory, USA,
May 2000.
11. P.K. Dey, N.K. Bansal, “Spent fuel reprocessing: A vital link in Indian
nuclear power program”, Nuclear Recycle Group, Bhabha Atomic Research
Centre, Trombay,,India 2005
12. Final report (1979-1988) “Thorium Utilization in PWRs”, 1988
13. Galperin, M Segev,“Radkowsky Thorium Fuel-A nonproliferative Th-based
Fuel Cycle for PWRs”, Reactor Analysis Group, Ben-Gurion University of
the Negev, Arial 1999
49APPENDIX
Figure 27: mass of fissile material (233U 235U 239Pu and 241Pu) for five fuel model
50Figure 28: fissile material consumption
Figure 29: mass of 233U and 233Pa
Figure 30: mass of 235U
51Figure 31: mass of Pu (238Pu, 239Pu, 240Pu, 241Pu and 242Pu)
Figure 32: important minor actinides
52Figure 33: neutron spectrum in the fuel of assembly model
Figure 34: radial power profile of assembly model
53axial power profile
1.4
ThMEU
axial peak to average factor
1.2 ThPu
ThU
1 UOX
0.8 ThUPu
0.6
0.4
0.2
0 50 100 150 200 250 300 350 400
axial position (cm)
Figure 35: axial power profile of assembly model
54You can also read