DETAILED SIMULATIONS OF ATMOSPHERIC FLOW AND DISPERSION IN DOWNTOWN MANHATTAN
←
→
Page content transcription
If your browser does not render page correctly, please read the page content below
DETAILED SIMULATIONS OF
ATMOSPHERIC FLOW AND
DISPERSION IN DOWNTOWN
MANHATTAN
An Application of Five Computational Fluid Dynamics Models

BYSTEVEN R. HANNA, MICHAEL J. BROWN, FERNANDO E. CAMELLI, STEVENS T. CHAN, WILLIAM J. COIRIER,
OLAV R. HANSEN, ALAN H. HUBER, SURA KIM, AND R. MICHAEL REYNOLDS

                                                            Using the same urban atmospheric bound-
                                                             ary layer scenario in New York City, the
                                                              five CFD models produce similar wind
                                                               flow patterns, as well as good agree-
                                                                            ment with winds observed
                                                                            during a field experiment.

                       T
                            here are increased concerns about releases of chemical or biological
                            agents or toxic industrial chemicals by terrorist activities or acci-
                            dents in downtown urban areas. For planning purposes and for real-
                       time emergency response, decision makers want to know whether either
                       evacuation or shelter-in-place is required and what areas are impacted
                       and for how long a time. City dwellers are familiar with the swirling,
                       nonuniform wind patterns in downtown street canyons, which cause
                       standard straight-line atmospheric transport and dispersion models to
                       be inappropriate. Many papers describe the variability that characterizes
                       flow and turbulence in urban

     AMERICAN METEOROLOGICAL SOCIETY                                              DECEMBER 2006     | 1713
areas (e.g., Oke 1987; Rotach 1997; Roth 2000; Britter              resolution (1–10 m) three-dimensional grid system,
      and Hanna 2003). To address this problem, a group                   within a domain with sides of a few kilometers at
      of scientists and engineers has been using compu-                   most and with typical depths from 0.5 to 1 km.
      tational fluid dynamics (CFD) models to estimate                    Detailed three-dimensional (3D) building data are
      airflow and dispersion patterns in the street canyons               also needed for the simulations. Now that comput-
      of large cities.                                                    ers are faster and have more storage, it has become
          New York, New York, is the focus of a set of recent             possible to run CFD models on an urban domain
      field experiments sponsored by the Urban Dispersion                 within a reasonable time frame (say less than a few
      Program of the Department of Homeland Security                      hours). Multiple sensitivity studies are now possible.
      (DHS). The wind data from the March 2005 Madison                    However, most early applications were to scenarios
      Square Garden (MSG05) experiment are used in the                    that were strongly forced by obstacles, such as a single
      current paper. In addition, a second field experiment               cube, and only the near-field results were analyzed.
      took place in August 2005 in the Midtown area. The                  Modelers (e.g., Hanna et al. 2002) found that the CFD
      Manhattan experiments are part of a sequence of                     model-simulated turbulence was reasonable near the
      intensive urban field experiments that have taken                   obstacle but, in many cases, died away too quickly
      place over the past five years, sponsored collabora-                once the flow passed the influence of the obstacle.
      tively by a number of agencies. Others include the                  Some models had a difficult time maintaining suf-
      Salt Lake City Urban 2000 experiment (Allwine et al.                ficient turbulence over, say, a uniform grassy field.
      2002), the Oklahoma City Joint Urban 2003 experi-                   The atmosphere is naturally quite turbulent, with
      ment (Allwine et al. 2004; Dugway Proving Ground                    turbulence intensities of 0.1 or more. The turbulence-
      2005), and the London Dispersion of Air Pollutants                  maintenance question and other related scientific
      and their Penetration into the Local Environment                    questions were the subject of a workshop held in July
      (DAPPLE) experiment (Britter 2005). These experi-                   2004 at George Mason University in Fairfax, Vir-
      ments make use of dense networks of fast-response                   ginia, where the current authors were in attendance
      sonic anemometers sited at street level and on                      and agreed to proceed with collaborative studies. A
      building tops, as well as remote sounders such as                   methodology for overcoming the turbulence-mainte-
      minisodars. The experiments also include tracer gas                 nance problem was suggested by the Environmental
      releases and sampling at many locations. The avail-                 Protection Agency (EPA) CFD modeling group (Tang
      ability of these extensive urban databases provides an              et al. 2006) at the American Meteorological Society
      opportunity for further development and evaluation                  (AMS) Annual Meeting.
      of many types of urban flow and dispersion models,                      One aspect of the collaborative studies discussed
      including CFD models.                                               at the workshop was to use some standard field da-
                                                                          tabases to advance the development and evaluation
      CFD MODELS. For urban applications, the CFD                         of the CFD models. These databases included the
      models solve the basic equations of motion on a high-               Kit Fox, Mock Urban Setting Test (MUST), Prairie
                                                                          Grass, and Evaluation of Model Uncertainty (EMU)
                                                                          data (e.g., Hanna et al. 2004). A key database was the
AFFILIATIONS : HANNA —Harvard School of Public Health,
Boston, Massachusetts; B ROWN —Los Alamos National
                                                                          classical 1955 Prairie Grass field experiment, which
Laboratory, Los Alamos, New Mexico; CAMELLI —George Mason                 took place over a grassy field, allowing model perfor-
University, Fairfax, Virginia; CHAN —Lawrence Livermore National          mance to be tested for a scenario with no buildings
Laboratory, Livermore, California; COIRIER AND KIM —CFD                   or other obstacles to force the flow. Although there
Research Corporation, Huntsville, Alabama; HANSEN —GexCon,                is not space in this paper to describe the details,
Bergen, Norway; HUBER—Air Resources Laboratory, NOAA,                     some modelers were able to improve their turbulence
Research Triangle Park, North Carolina; REYNOLDS —Brookhaven
                                                                          parameterizations so as to produce good agreement
National Laboratory, Upton, New York
CORRESPONDING AUTHOR : Steven R. Hanna, 7 Crescent
                                                                          with the Prairie Grass data.
Ave., Kennebunkport, ME 04046                                                 Another aspect of the collaborative study was to
E-mail: shanna@hsph.harvard.edu                                           run the CFD models as part of ongoing major studies
                                                                          such as the Manhattan (MSG05) study. The models
The abstract for this article can be found in this issue, following the
table of contents.
                                                                          were used to plan the experiment and are now being
DOI:10.1175/BAMS-87-12-1713                                               used to analyze the results, as discussed in the cur-
                                                                          rent paper. It should be mentioned that, while some
In final form 19 July 2006
©2006 American Meteorological Society                                     of the CFD work [Finite Element Model in 3D and
                                                                          Massively-Parallel version (FEM3MP) and FLU-

1714 |          DECEMBER 2006
ENT-EPA] was directly sponsored by the MSG05                • FEM3MP (Gresho           S. Chan, Lawrence
   lead agency (DHS) or a cosponsoring agency (the               and Chan 1998;           Livermore National
   Defense Threat Reduction Agency), the Finite Ele-             Calhoun et al. 2005)     Laboratory
   ment Flow-Urban (FEFLO-Urban) and FLACS runs
   were carried out with internal funds from George            • FEFLO-Urban              F. Camelli, George Mason
   Mason University and GexCon, respectively. Thus,              (Camelli et al. 2004;    University
   this scientific initiative conforms to the spirit of          Camelli and Lohner
   advancing the overall field.                                  2004)
       A unique aspect of the current paper is that this
   is the first time that several CFD models have been            Although these five CFD models are currently too
   applied to the same urban boundary layer scenario           slow to be used for real-time emergency response,
   to enable model comparisons. Identical three-dimen-         they can be used for planning purposes and to guide
   sional building data files and similar input meteorol-      parameterizations in simpler, real-time wind flow
   ogy were used. The CFD models, their references, and        models. An example of a fast-running real-time wind
   the persons running the models for the current study        flow and dispersion model that is parameterized
   are listed below:                                           based on the CFD results is Quick Urban and Indus-
                                                               trial Complex (QUIC) dispersion modeling system
   • CFD-Urban                W. Coirier and S. Kim, CFD       (Williams et al. 2004).
    (Coirier et al. 2005;     Research Corporation                Four of these same CFD models (all but FEM3MP)
    Coirier and Kim                                            were used to plan the MSG05 experiment. Those runs
    2006a,b)                                                   used the expected south-southwest wind direction,
                                                               which is the most probable according to historic
   • FLACS (Hanna             O. R. Hansen, GexCon
                                                               climate data. However, the actual wind directions
    et al. 2004)
                                                               during MSG05 were from the north-northwest to
   • FLUENT-EPA               A. Huber, National Oceanic       northwest, and these wind directions are the sub-
    (Huber et al. 2005)       and Atmospheric Adminis-         ject of the current paper. Some comparisons for the
                              tration (NOAA)                   south-southwest planning runs were presented by

TABLE 1. Summary of CFD model characteristics.
Characteristic CFD-Urban                FLACS                 FEM3MP               FEFLO-Urban          FLUENT-EPA
Type               RANS                 RANS                  RANS                 LES                  RANS
Mesh               Finite volume,       Finite volume,        Finite element,      Unstructured         Finite volume,
                   adaptive Cartesian   rectangular           hexahedrons          tetrahedral          unstructured hexa-
                                                                                                        hedron dominant
Inflow             Fixed log profile,   Fixed log profile,    Fixed log profile,   Fixed log profile,   Scaled EPA wind
                   neutral, west-       neutral, west-        neutral, west-       neutral, west-       tunnel bound-
                   northwest, u = 5.3   northwest, u = 5.3    northwest, u = 5.0   northwest u = 3.0    ary layer, neu-
                   m s –1 at z = 50 m   m s –1 at z = 10 m    m s-1 at z = 92 m    m s –1 at z = 10 m   tral, northwest
                                                                                                        u = 3.1 m s –1 at
                                                                                                        z = 100
Closure            k–ε                  k–ε                   nonlinear eddy       Smagorinski          k–ε
                                                              viscosity
Domain size        3.5 km × 3.1 km      Outer: 10 km       1.75 km × 1.2 km        3.3 km east–west, 2 km × 2 km
                   × 0.6 km             × 7.5 km × 1 km,   × 0.8 km                2.6 km north–     × 1.2 km
                                        inner: 3 km × 3 km                         south, 0.6 km
                                                                                   vertical
Resolution         3-m horizontal in    10-m horizontal       5-m horizontal,      2 m at street        1–2 m near
                   MSG area, 1-m        and 5-m vertical in   2–8-m vertical                            buildings,
                   vertical stretched   inner area                                                      expansion away
                   to 40 m at 600 m                                                                     from buildings
Grid points,       2.1 M                2.7 M grid cells      12.7 M               4.4 M points,        19 M grid cells
elements                                                                           25.2 M elements

   AMERICAN METEOROLOGICAL SOCIETY                                                                 DECEMBER 2006          | 1715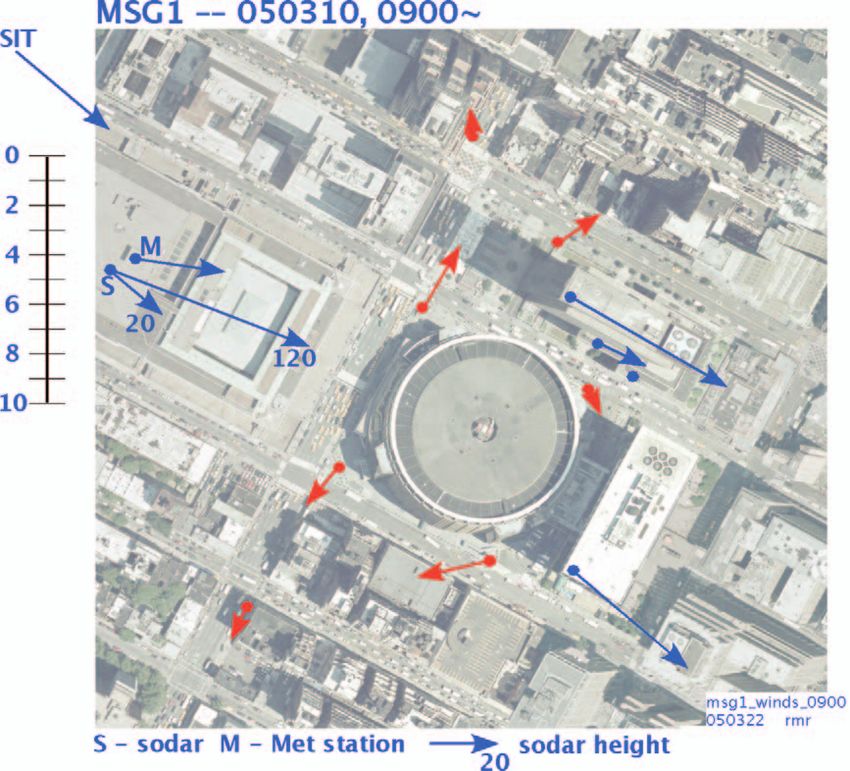
M. Brown at the 2006 AMS Annual Meeting (Camelli             RANS models’ outputs have 3D variability but rep-
     et al. 2006), and a brief comparison of FEM3MP with          resent an average over time and are therefore steady
     observations for the MSG05 west-northwest case was           state. FEFLO-Urban was run in large-eddy simulation
     presented by M. Leach at the same meeting (Leach             (LES) mode, which requires more computer time but
     et al. 2006). The conclusions by Camelli et al. (2006)       produces time-variable flow fields.
     concerning model-to-model comparisons were                       All CFD models used the three-dimensional
     similar to what is found here (i.e., good agreement          building database for Manhattan licensed by the
     concerning general flow patterns), although there            Vexcel Corporation. These licensed building data
     were no observations from south-southwest wind               have a resolution of about 1 m, and support visualiza-
     directions to aid in the evaluations.                        tions that look like “real” photographs. However, we
         Summaries of the CFD model characteristics and           point out that, because buildings in large cities such
     assumptions for the current MSG05 exercise (for the          as New York are razed and rebuilt with surprising
     west-northwest wind directions observed during the           frequency, it is necessary to update the 3D file for
     field experiment) are given in Table 1. Readers inter-       applications at any particular time.
     ested in more details can consult the references. All            To allow for comparisons with the observed winds
     models except for FEFLO-Urban were run in Reyn-              at street level, the CFD model simulations were made
     olds-averaged Navier–Stokes (RANS) mode. The                 for average rooftop wind conditions observed during

 TABLE 2. Summary of wind observations during two MSG05 experiment days (10 and 14 Mar 2005).
                                              10 March                           14 March      14 March
   Site                            z (m)                     10 March wind
                  Name                       wind speed                         wind speed       wind         Comment
  label                            AGL                        direction (º)
                                               (m s –1)                           (m s –1)   direction (º)
    R1       One Penn Plaza         229           7.3              286             7.0            327         Tall rooftop
    R2       Two Penn Plaza         153           5.8              306             3.8            318         Tall rooftop
                                                                                                             On broad, flat
    R3      Farley Post Office       34           3.6              281             3.9            269
                                                                                                               building
              City College of
 CCNY*                               58           5.2              266             5.2            309        Open rooftop
                New York
            Stevens Institute of
   SIT*                              52           5.7              297             6.9            335        Open rooftop
                Technology
              Environmental
  EML*           Monitor             82           3.3              286             4.3            323        Open rooftop
               Laboratory
              Lehmann Bros.
  LBR*                              160           4.7              286             3.6            308        Open rooftop
                 Building
   JFK*           Airport            3.4          6.2              290             6.5            320          Flat airport
    S1       Northwest MSG           3.0          3.0              212             2.7            187          See figure
    S2       Southwest MSG           3.0          1.7           27 steady          1.2         80 variable     See figure
                                                                                                Variable
    S3        Southeast MSG          3.0          3.3           76 steady          2.6                         See figure
                                                                                               west–east
                                                             Variable, north-
    S4       Northeast MSG           3.0          1.6         northwest to         3.6         165 steady      See figure
                                                             south-southeast
              Northwest
    S5                               3.0          2.6              238             1.7            292          See figure
             One Penn Plaza
              Front of New
    S6                               5.0          1.2              162              —              —           Channeled
              Yorker Hotel
              8th Ave Side of
    S7                               3.0          1.2              17              2.0             28          Channeled
                   MSG

* These sites are outside of the MSG area shown in Fig. 1.

1716 |       DECEMBER 2006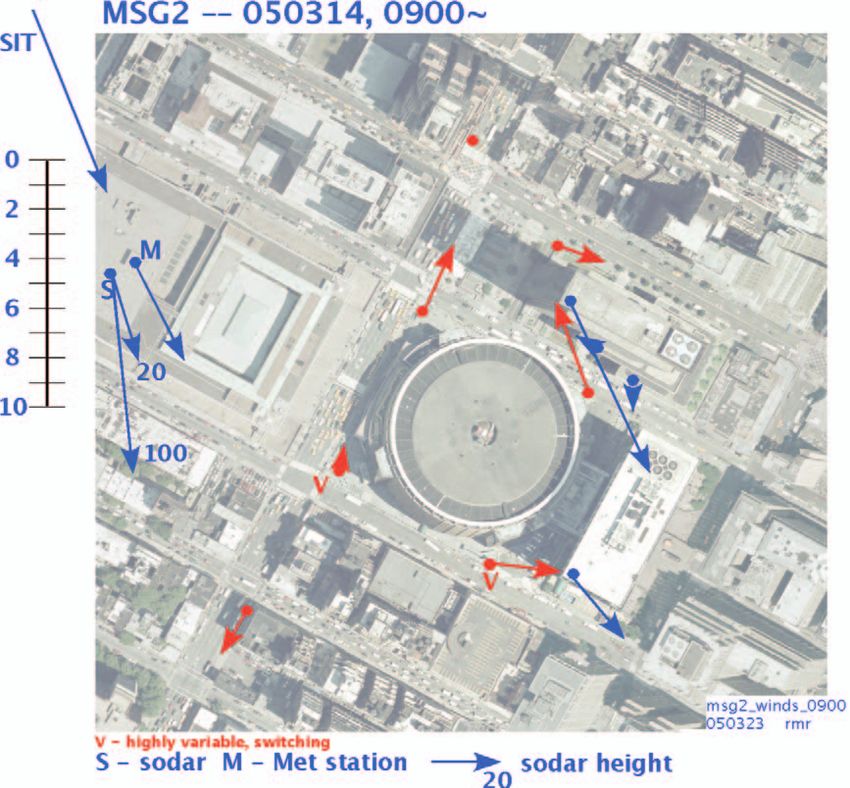
the two time periods (from
    0900 to 1400 LST 10 and 14
    March 2005) during which
    time the MSG05 field experi-
    ment took place. These two
    days were both characterized
    by fairly steady moderate west-
    northwest to northwest wind
    flows, well-mixed near-neu-
    tral conditions, and cold tem-
    peratures (near 0°C). Hanna et
    al. (2006) provide an overview
    of the MSG05 field experiment
    and a summary of the wind
    and turbulence observations.
    As seen in Table 1, the five
    CFD models assumed similar
    inflow conditions, based on
    averaged wind observations
    at rooftop and other exposed
    sites on 10 March, as listed
    in Table 2. Although the five
    models used slightly different
    assumptions for inflow (up-
                                       FIG. 1. Aerial photograph of area (of approximate dimensions 500 m × 500 m)
    wind) wind speeds, the results
                                       around MSG in Manhattan, where MSG is the round building and has 130-m
    are expected to be relatively      diameter and 50-m height. The 229-m-tall One Penn Plaza building is to
    unaffected because the build-      the northeast of MSG and the 153-m-tall Two Penn Plaza building is to
    ings have such a strong ef-        the east-southeast of MSG. At the R3 site (on the Farley Post Office), M
    fect on the wind patterns and      refers to the fixed anemometer and S refers to the sodar.
    the incoming flow has a few
    blocks to adjust to the underly-
    ing built-up urban area.
        To illustrate the magnitudes
    and variability of the observed
    wind speeds and directions,
    Table 2 (prepared by Hanna
    et al. 2006) contains average
    observed winds during the
    five-hour (0900–1400 LST)
    experiment periods on 10 and
    14 March. Data are given for
    the anemometers shown on
    Fig. 1, as well as for anemom-
    eters from other Manhattan
    building tops, from John F.

F IG . 2. Observed wind vectors
(red near street level and blue
at rooftop) at 0900 LST 10 Mar
2005. At the “S” site on the Post
office, the sodar wind vectors at
z = 20 and 120 m above the roof
are shown.

    AMERICAN METEOROLOGICAL SOCIETY                                                      DECEMBER 2006       | 1717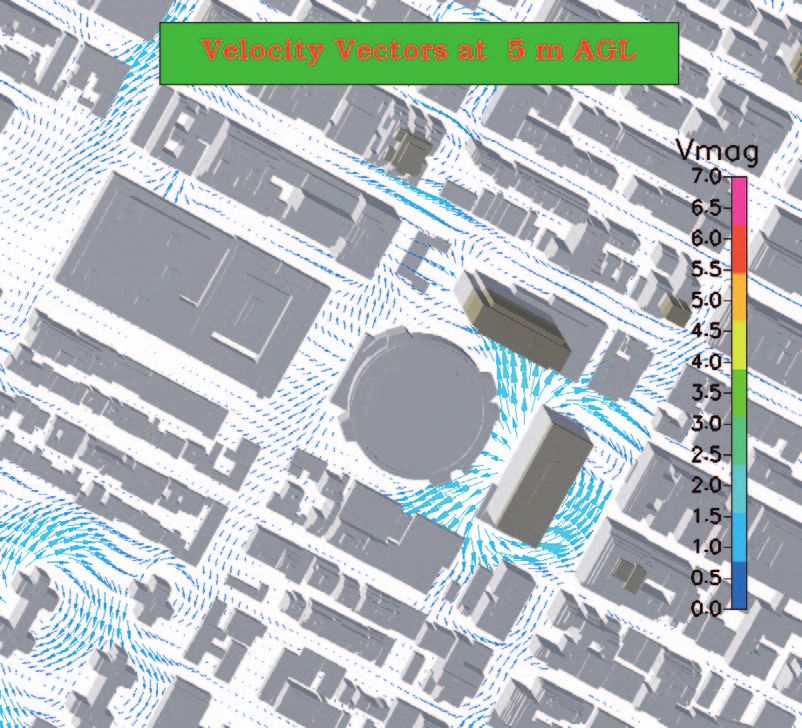
Kennedy International (JFK)
                                                                                 Airport, and from the top
                                                                                 of a building on the Stevens
                                                                                 Institute of Technology (SIT)
                                                                                 campus in Hoboken, New
                                                                                 Jersey, on the west bank of the
                                                                                 Hudson River.
                                                                                    The sonic anemometers
                                                                                 listed in Table 2 measured
                                                                                 winds at eight locations near
                                                                                 street level and on several
                                                                                 rooftops, such as the One
                                                                                 Penn Plaza (229 m) and Two
                                                                                 Penn Plaza (153 m) buildings,
                                                                                 which are adjacent to Madi-
                                                                                 son Square Garden (MSG).
                                                                                 Figure 1 shows the MSG do-
                                                                                 main and buildings, and gives
                                                                                 the positions of the anemom-
                                                                                 eters at street level (S) and at
                                                                                 rooftop (R). Figures 2 and 3
                                                                                 use the same geographic do-
                                                                                 main and include, as an exam-
                                                                                 ple, the observed 30-minute-
FIG. 3. Observed wind vectors (red near street level and blue at rooftop) at     averaged wind vectors from
0900 LST 14 Mar 2005. At the “S” site on the Post office, the sodar wind
                                                                                 0900 to 0930 LST 10 March
vectors at z = 20 and 120 m above the roof are shown.
                                                                                 and 14 March, respectively.
                                                                                 The observed rooftop winds
                                                                        have speeds of about 6 m s–1 and are
                                                                        from the west-northwest direction on
                                                                        10 March and the northwest direc-
                                                                        tion on 14 March, while the observed
                                                                        street-level winds (with an average
                                                                        scalar speed of about 2 m s -1) have
                                                                        many directions, depending on nearby
                                                                        buildings. The figures show that, with
                                                                        the exception of the two sonic ane-
                                                                        mometers close to the windward (east)
                                                                        side of Two Penn Plaza, the observed
                                                                        street-level wind patterns do roughly
                                                                        agree on the two days.
                                                                            As intuition would suggest, the
                                                                        relative inf luence of the One Penn
                                                                        Plaza (229 m) and Two Penn Plaza
                                                                        (153 m) buildings switches for the
                                                                        south-southwest wind direction used
                                                                        in the CFD planning runs (Camelli et
                                                                        al. 2006) and the west-northwest wind
                                                                        directions observed during the field
                                                                        experiment and used in the current
FIG. 4. Simulations of horizontal wind vectors (m s ) at z = 5 m by comparisons. Because the broad side
                                                     –1

CFD-Urban model for 10 Mar 2005 upstream wind inputs (flow from of One Penn Plaza faces the south-
the west-northwest).                                                    southwest, it dominates the flow for

1718 |     DECEMBER 2006
the south-southwest wind direction.
And because the broad side of Two
Penn Plaza faces the west-northwest,
it dominates for the west-northwest
wind direction, as seen in the results
in the figures. Although we did not
carry out any CFD model runs for
light winds with variable directions,
it is obvious that the flow patterns
would flip back and forth from be-
ing dominated by one building or
the other if the wind directions are
varying back and forth between the
southwest and northwest.
    Although the MSG05 CFD model
comparison exercise is nearly fin-
ished, these same CFD models are
being run for the August 2005 Mid-
town field experiment (MID05) in          FIG. 5. Simulations of horizontal wind vectors (m s –1) at z = 5 m by
Manhattan. MID05 was the second           FLACS model for 10 Mar 2005 upstream wind inputs (flow from the
experiment in the series begun by         west-northwest).
MSG05 and involved more experi-
ment days (six instead of two) and
many more meteorological and sam-
pling instruments. Wind speeds were
lighter, by a factor of 3, in MID05
than in MSG05. The MID05 CFD
comparisons are being planned to be
more quantitative than the current
qualitative comparisons for MSG05.
    There are 19 figures presented that
illustrate the degree of agreement (or
disagreement) among the five models
for MSG05. The first set of figures
presents the horizontal wind vectors
near the ground. The second set of
figures presents the vertical veloci-
ties near the ground. The third set of
figures shows along-wind (x–z) cross
sections of wind vectors. The final set
of figures shows some predicted nor-
malized concentration patterns for
the tracer-release locations around
MSG. With much more planning
and support, we perhaps could have
produced the figures in the same
format and color scheme for each
model. However, because several of
the modelers are participating on
a volunteer basis, we were satisfied
once the domains, inputs, heights         FIG. 6. Simulations of horizontal wind vectors (m s –1) at z = 4 m by the
of outputs, and other details were        FEM3MP model for 10 Mar 2005 upstream wind inputs (flow from
reasonably close for each model. Per-     the west-northwest).

AMERICAN METEOROLOGICAL SOCIETY                                                         DECEMBER 2006         | 1719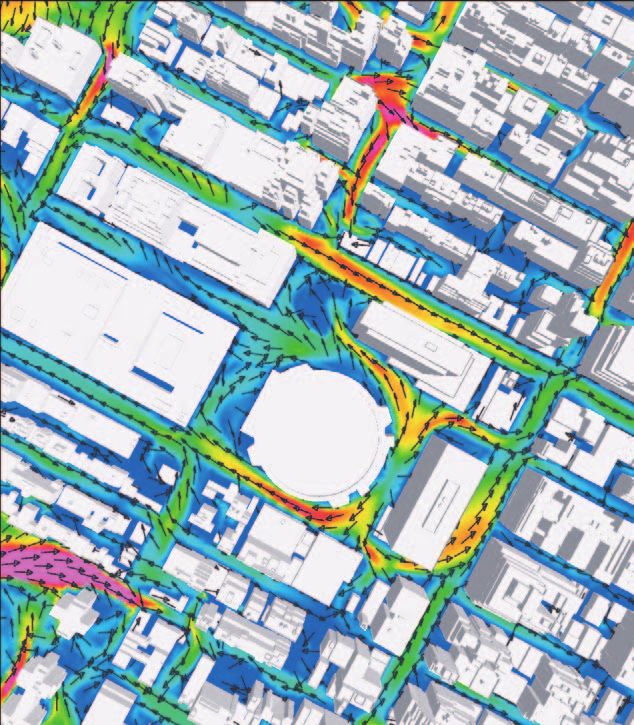
FIG . 9. Simulations of vertical velocity w (m s –1) at
                                                              z = 5 m, by CFD-Urban for 10 Mar 2005 upstream wind
                                                              inputs (flow from the west-northwest).

                                                             CFD models (CFD-Urban, FLACS, FEM3MP, FEFLO-
                                                             Urban, and FLUENT-EPA, respectively). Side-by-side
                                                             comparisons with the 30-minute-averaged observed
                                                             wind vectors (in Fig. 2) show reasonable agreement
                                                             in speed (within a factor of 2) and direction (within
FIG. 7. Simulations of horizontal wind vectors (m s –1)
at z = 5 m by FEFLO-Urban model for 10 Mar 2005 up-
                                                             about 30°) for most street-level sites. For example,
stream wind inputs (flow from the west-northwest).           the models capture the diverging flow toward the
                                                                             upwind and crosswind directions on
                                                                             the windward side of MSG and Two
                                                                             Penn Plaza (just east of MSG).
                                                                                 In the planning run compari-
                                                                             sons for the south-southwest wind
                                                                             direction, Camelli et al. (2006) show
                                                                             that there are a few locations on the do-
                                                                             main that show significant differences
                                                                             among the models, and these warrant
                                                                             further investigations. Usually the dif-
                                                                             ferences occur where the wakes of two
                                                                             adjacent buildings are “battling” each
                                                                             other for dominance. Careful com-
                                                                             parisons of Figs. 4 through 8 reveal
                                                                             similar discrepancies in certain parts
                                                                             of the domain.
                                                                                 The CFD model outputs and
                                                                             the obser vations are compared
                                                                             qualitatively in the current paper.
                                                          –1
FIG. 8. Simulations of horizontal wind vectors (m s ) at z = 2 m by          The CFD team is proceeding with
FLUENT-EPA model for 10 Mar 2005 upstream wind inputs (flow                  limited quantitative comparisons
from the northwest).                                                         for the MSG05 experiment, and
                                                                             more extensive comparisons for the
     haps future comparison studies could impose precise MID05 experiment, and results will be shown in a
     criteria for these details beforehand.                  future paper. For example, the 30-minute-averaged
                                                             wind speed and direction simulated by the five mod-
     RESULTS. Examples of simulated wind vectors near els at each anemometer location will be compared
     street level, at 0900 LST 10 March of the MSG05 field using standard statistics. Vertical profiles and cross
     experiment, are given in Figs. 4 through 8 for the five sections of model outputs such as turbulent kinetic

1720 |      DECEMBER 2006
energy (TKE) will be tabulated and
analyzed.
    As another qualitative conclusion,
the results show the strong influence
on the near-surface wind f low of
the tallest buildings, which bring
down momentum from aloft on
their windward sides and have an
upward-directed “chimney effect”
on their leeward sides. These verti-
cal velocity patterns on a horizontal
plane near the ground are seen in
Figs. 9–13 for the five CFD models
(CFD-Urban, FLACS, FEM3MP,
FEFLO-Urban, and FLUENT-EPA,
respectively). The typical magni-
tudes of the vertical velocities are
a few tenths of a meter per second,
although larger values (as much as
5 m s -1) are sometimes simulated
                                          FIG . 10. Simulations of vertical velocity w (m s –1) at z = 5 m, by
close to tall buildings. These verti-
                                          FLACS for 10 Mar 2005 upstream wind inputs (flow from the west-
cal motions are associated with the       northwest).
diverging and converging flow pat-
terns at street level, which can extend
a block or two out from the base of
the building. The lateral extent of
the outflow and inflow patterns is
approximately equal to one or two
building heights.
    The vortices in street canyons
and behind buildings can also be
seen when the results of the simula-
tions are plotted as along-wind verti-
cal (x-z) cross sections, as shown in
Figs. 14–18 for the five CFD models.
The (x–z) cross section is through
the middle of MSG and directed
parallel to the streets (e.g., 33rd
Street), which are oriented from the
west–northwest to east–southeast.
This direction is approximately
aligned with the inflow wind direc-
tion. In particular, the downdraft on
the windward side of Two Penn Plaza
(just east of MSG) is clearly seen
in the figures, as well as the street
canyon eddy on the windward side
of MSG. Slightly different orienta-
tions have been used for the five
models; for example, in Fig. 16 (for
FEM3MP), the absence of buildings         FIG . 11. Simulations of vertical velocity w (m s –1) at z = 5 m, by
to the right side (to the south-south-    FEM3MP for 10 Mar 2005 upstream wind inputs (flow from the
east) of the Two Penn Plaza building      west-northwest).

AMERICAN METEOROLOGICAL SOCIETY                                                      DECEMBER 2006       | 1721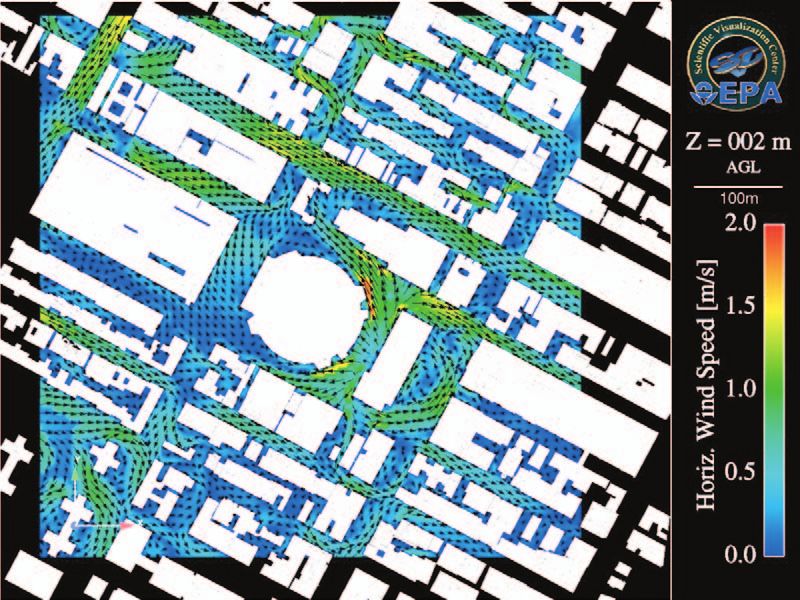
FIG. 13 (ABOVE). Simulations of vertical velocity w (m s–1)
                                                         at z = 2 m, by FLUENT-EPA for 10 Mar 2005 upstream
                                                         wind inputs (flow from the northwest).

                                                         FIG. 12 (LEFT). Simulations of vertical velocity w (m s –1)
                                                         at z = 5 m, by FEFLO-Urban for 10 Mar 2005 upstream
                                                         wind inputs (flow from the west-northwest).

                                                                             FIG. 14. Simulations of wind vectors
                                                                             (m s –1) on x–z cross section through
                                                                             MSG for the west-northwest direc-
                                                                             tion, for CFD-Urban. The view is
                                                                             toward the north-northeast.

FIG. 15. Simulations of wind vectors (m s –1) on x–z cross section through MSG for the west-northwest direction,
for FLACS. The view is toward the north-northeast.

1722 |     DECEMBER 2006
FIG. 16. Simulations of wind vectors (m s–1)
on x–z cross section through MSG for the
west-northwest direction, for FEM3MP.
The view is toward the north-northeast.
FIG. 17. Simulations of wind vectors (m s–1)
on x–z cross section through MSG for the
west-northwest direction, for FEFLO-
Urban. The view is toward the north-
northeast.
FIG . 18. Simulations of wind vectors on
x–z cross section through MSG for the
northwest direction, for FLUENT-EPA.
The view is toward the north-northeast.
AMERICAN METEOROLOGICAL SOCIETY DECEMBER 2006 | 1723FIG . 19. CFD-Urban simulation of
tracer gas dispersion for a point
release near street level on the
southwest side of MSG, for the
west- northwest wind direction.
This is one of the five source loca-
tions used during the MSG05 field
experiment.
F IG . 20. FL ACS simulation
of tracer gas dispersion for
a point release near street
level on the southwest side of
MSG for the west-northwest
wind direction. This is one
of the five source locations
used during the MSG05 field
experiment. The figure is for
900 s after the release was
initiated.
FIG. 21. FEM3MP simulation of tracer
gas dispersion for the west-northwest
wind direction and a point release near
street level on the southwest side of
MSG. This is one of the five source
locations used during the MSG05 field
experiment.
1724 | DECEMBER 2006decisions, and further analysis of the
CFD model outputs and the tracer
data should aid in devising decision
strategies.
It is seen from these example
figures that the simulations by the
five models are qualitatively simi-
lar. They agree fairly well with each
other and with the MSG05 f low
observations, at least concerning
general patterns and flow magni-
tudes. Although more analysis is
clearly needed, these preliminary
CFD results suggest that they hold
promise for aiding in increasing
our understanding of wind flow and
tracer dispersion in urban areas.
ACKNOWLEDGMENTS. The re-
search has been sponsored by the U.S.
Department of Homeland Security,
the Defense Threat Reduction Agency,
the National Science Foundation, the
Department of Energy, the National
FIG. 22. FEFLO-Urban simulations of tracer gas dispersion for a west- Oceanic and Atmospheric Administra-
northwest wind direction. There is a continuous release from five
tion, and the Environmental Protection
point sources near street level (on sidewalk off four corners of MSG
and on sidewalk north of One Penn Plaza) as used during MSG05. Agency. FLACS runs were supported
The figure presents the plume concentrations at a time of 1000 s by GexCon internal research funds and
after the release is initiated. FEFLO-Urban runs were supported
by the George Mason University CFD
Laboratory internal research funds.
is because the x–z cross section passes through the The MSG05 field experiment and the current research
middle of a narrow street. are part of the multiyear Urban Dispersion Program (UDP),
Four of the models were also used to simulate whose primary sponsor is the Department of Homeland
tracer dispersion patterns for eventual comparison Security. The March 2005 MSG05 field experiment and the
with observations during MSG05. Although the August 2005 Midtown field experiment (MID05) datasets
tracer studies are not the main emphasis of the cur- are still undergoing quality assurance/quality control but
rent paper, it is found that the models agree that the will soon be placed in a permanent data archive.
tracer initially spreads a block or two upwind and
laterally while it is still near street level, and then
spreads downwind as a broad plume after it mixes REFERENCES
vertically to the building tops. Examples of CFD mod- Allwine, K. J., J. H. Shinn, G. E. Streit, K. L. Clawson,
el simulations of tracer dispersion from the release and M. Brown, 2002: Overview of Urban 2000. Bull.
positions around MSG are shown in Figs. 19–22 for Amer. Meteor. Soc., 83, 521–536.
CFD-Urban, FLACS, FEM3MP, and FEFLO-Urban, —, M. Leach, L. Stockham, J. Shinn, R. Hosker, J.
respectively. The simulations are presented in nor- Bowers, and J. Pace, 2004: Overview of Joint Urban
malized mode, and comparisons are not given with 2003—An atmospheric dispersion study in Okla-
the actual observations because of security reasons. homa City. Preprints, Symp. on Planning, Nowcast-
When time series of CFD model concentration ing and Forecasting in the Urban Zone, Seattle, WA,
plots are studied, they show the “hold up” of tracer Amer. Meteor. Soc., CD-ROM, J7.1.
material in recirculating zones behind buildings or Britter, R. E., cited 2005: DAPPLE: Dispersion of Air
in blocked regions with very low velocities. These Pollutants and their Penetraiton into the Local Envi-
zones are very important for emergency response ronment. [Available online at www.dapple.org.uk.]
AMERICAN METEOROLOGICAL SOCIETY DECEMBER 2006 | 1725—, and S. R. Hanna, 2003: Flow and dispersion in turbulence within simple obstacle arrays. Atmos.
urban areas. Annu. Rev. Fluid Mech., 35, 469–496. Environ., 36, 5067–579.
Calhoun, R., F. Gouveia, J. Shinn, S. Chan, D. Stevens, —, O. R. Hansen, and S. Dharmavaram, 2004: FLACS
R. Lee, and J. Leone, 2005: Flow around a complex air quality CFD model performance evaluation with
building: Experimental and large-eddy simulation Kit Fox, MUST, Prairie Grass, and EMU observa-
comparisons. J. Appl. Meteor., 44, 571–590. tions. Atmos. Environ., 38, 4675–4687.
Camelli, F. E., and R. Löhner, 2004: Assessing maximum —, J. White, Y. Zhou, and A. Kosheleva, 2006: Analysis
possible damage for containment release events. Eng. of JU2003 and MSG05 meteorological and tracer data.
Comput., 21, 748–760. Preprints, Sixth Symp. on the Urban Environment,
—, S. R. Hanna, and R. Löhner, 2004: Simulation of Atlanta, GA, Amer. Meteor. Soc., CD-ROM, J7.1.
the MUST field experiment using the FEFLO-Urban Huber, A., M. Freeman, R. Spencer, B. Bell, K. Kuehlert,
CFD model. Fifth Symp. on the Urban Environ- and W. Schwarz, 2005: Applications of CFD simula-
ment, Vancouver, BC, Canada, Amer. Meteor. Soc., tions of pollutant transport and dispersion within
CD-ROM, 13.12. ambient urban building environments: Including
—, W. J. Coirier, A. H. Huber, O. R. Hansen, S. Kim, homeland security. AWMA 98th Annual Conf.,
S. R. Hanna, and M. J. Brown, 2006: An intecompari- Minneapolis, MN, AWMA, CD-ROM, Paper
son of four CFD models: Transport and dispersion #1241.
around Madison Square Garden. Preprints, Conf. on Leach, M. J., S. T. Chan, and J. K. Lundquist, 2006: High-
Air Pollution Modeling, Atlanta, GA, Amer. Meteor. resolution CFD simulation of airflow and tracer dis-
Soc., CD-ROM, J2.6. persion in New York City. Preprints, Sixth Symp. on
Coirier, W. J., and S. Kim, 2006a: CFD modeling for the Urban Environment, Atlanta, GA, Amer. Meteor.
urban area contaminant transport and dispersion: Soc., CD-ROM, J5.6.
Model description and data requirements. Preprints, Oke, T. R., 1987: Boundary Layer Climates. 2nd ed.
Sixth Symp. on the Urban Environment, Atlanta, GA, Routledge, 435 pp.
Amer. Meteor. Soc., CD-ROM, JP2.11. Rotach, M. W., 1997: The turbulence structure in the
—, and —, 2006b: Summary of CFD-Urban re- urban roughness sublayer. Flow and Dispersion
sults in support of the Madison Square Garden and Through Groups of Obstacles, R. J. Perkins and S. E.
Urban Dispersion Program field texts. Preprints, Belcher, Eds., Clarendon Press, Oxford, 143–155.
Sixth Symp. on the Urban Environment, Atlanta, GA, Roth, M., 2000: Review of atmospheric turbulence over
Amer. Meteor. Soc., CD-ROM, J5.5. cities. Quart. J. Roy. Meteor. Soc., 126, 941–990.
—, D. M Fricker, M. Furmaczyk, and S. Kim, 2005: A Tang, W., A. Huber, B. Bell, and W. Schwartz, 2006:
computational fluid dynamics approach for urban Application of CFD simulations for short-range
area transport and dispersion. Environ. Fluid Mech., atmospheric dispersion over open fields and within
15, 443–479. arrays of buildings. Preprints, 14th Joint Conf. on
Dugway Proving Ground, cited 2005: Data archive for the Application of Air Pollution Meteorology with
JU2003. [Available online at https://ju2003-dpg.dpg. the AWMA, Atlanta, GA, Amer. Meteor. Soc., CD-
army.mil.] ROM, 1.8.
Gresho, P. M., and S. T. Chan, 1998: Projection 2 goes Williams, M. D., M. Brown, D. Boswell, B. Singh, and
turbulent—And fully implicit. Int. J. Comput. Fluid E. Pardyjak, 2004: Testing of the QUIC-PLUME
Dyn., 9, 249–272. model with wind-tunnel measurements for a high-
Hanna, S. R., S. Tehranian, B. Carissimo, R. W. Mac- rise building. Preprints, Urban Environment Conf.,
donald, and R. Lohner, 2002: Comparisons of model Vancouver, BC, Canada, Amer. Meteor. Soc., CD-
simulations with observations of mean flow and ROM, J5.3.
1726 | DECEMBER 2006You can also read