Detecting Body Mass Index from a Facial Photograph in Lifestyle Intervention - MDPI
←
→
Page content transcription
If your browser does not render page correctly, please read the page content below
technologies
Article
Detecting Body Mass Index from a Facial Photograph
in Lifestyle Intervention
Makenzie L. Barr 1       ID
                              , Guodong Guo 2 , Sarah E. Colby 3   ID
                                                                        and Melissa D. Olfert 1, *   ID

 1    Davis College of Agriculture, Natural Resources and Design, Division of Animal Nutrition and Science,
      Human Nutrition and Foods, West Virginia University, Morgantown, WV 26506, USA;
      mbarr6@mix.wvu.edu
 2    Benjamin M. Statler College of Engineering and Mineral Resources, West Virginia University,
      Morgantown, WV 26506, USA; Guodong.guo@mail.wvu.edu
 3    Department of Nutrition, The University of Tennessee, Knoxville, TN 37996-1920, USA; scolby1@utk.edu
 *    Correspondence: Melissa.olfert@mail.wvu.edu

 Received: 31 July 2018; Accepted: 26 August 2018; Published: 31 August 2018

 Abstract: This study aimed to identify whether a research participant’s body-mass index (BMI) can
 be correctly identified from their facial image (photograph) in order to improve data capturing in
 dissemination and implementation research. Facial BMI (fBMI) was measured using an algorithm
 formulated to identify points on each enrolled participant’s face from a photograph. Once facial
 landmarks were detected, distances and ratios between them were computed to characterize facial
 fatness. A regression function was then used to represent the relationship between facial measures
 and BMI values to then calculate fBMI from each photo image. Simultaneously, BMI was physically
 measured (mBMI) by trained researchers, calculated as weight in kilograms divided by height in
 meters squared (adult BMI). Correlation analysis of fBMI to mBMI (n = 1210) showed significant
 correlation between fBMI and BMIs in normal and overweight categories (p < 0.0001). Further analysis
 indicated fBMI to be less accurate in underweight and obese participants. Matched pair data for
 each individual indicated that fBMI identified participant BMI an average of 0.4212 less than mBMI
 (p < 0.0007). Contingency table analysis found 109 participants in the ‘obese’ category of mBMI were
 positioned into a lower category for fBMI. Facial imagery is a viable measure for dissemination of
 human research; however, further testing to sensitize fBMI measures for underweight and obese
 individuals are necessary.

 Keywords: Body Mass Index (BMI); facial image; BMI prediction; young adults

1. Introduction
     Body Mass Index (BMI) is a well-utilized measure to generally describe weight status [1] based
on the ratio between an individual’s height and weight. It is used to ultimately classify an individual
as underweight, normal weight, overweight, or obese [2]. Within dissemination and implementation
research in particular, measuring BMI can be an obstacle that interferes with obtaining outcome
data. First, reaching participants to physically measure BMI is unlikely when aiming to disseminate
a program nationally due to limited time available and the resources needed by facilitators to accurately
measure weight and height (a research quality stadiometer and scales) as well as carrying out the
intervention [3]. Further, relying on individuals to perform self-measurements may not be realistic or
reliable, and measurements would often rely on corrective equations [4,5]. Nevertheless, self-reported
measurements are typically used as a secondary measure when physical measurements are not
feasible [6]. Previous research has shown that participants tend to overestimate their height and
underestimate their weight, resulting in inaccurate BMI data [7]. Pursey et al. found that young

Technologies 2018, 6, 83; doi:10.3390/technologies6030083                        www.mdpi.com/journal/technologies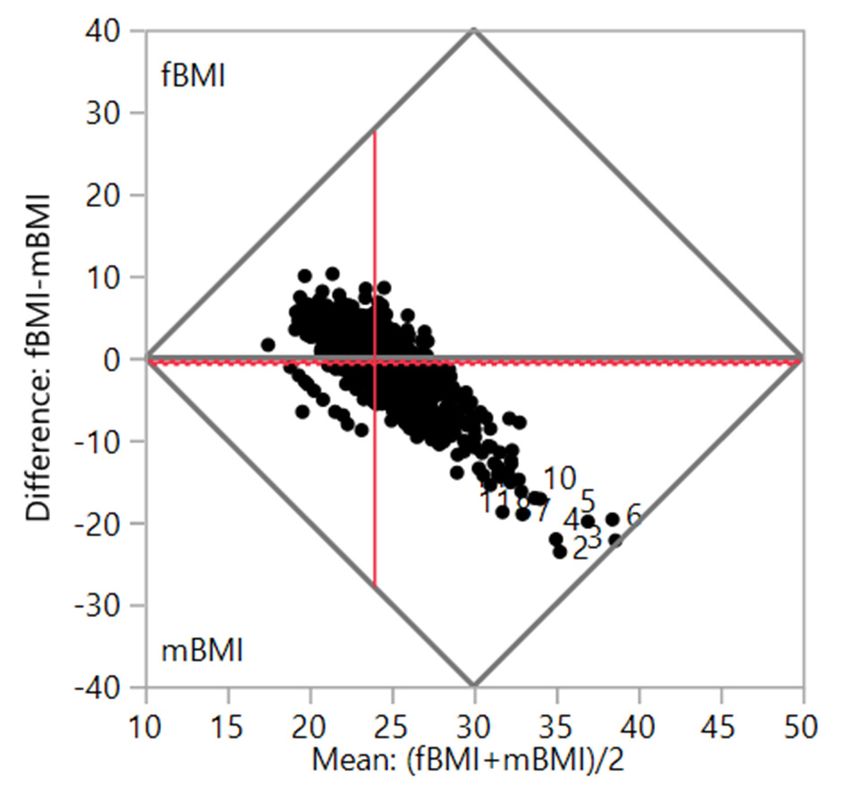
Technologies 2018, 6, 83                                                                             2 of 8

adults tended to overestimate their height while underestimating weight [6]. Similar findings from
the National Health and Nutrition Examination Survey (NHANES) and the National Institutes of
Health (NHI) data found younger (18–42 years) and older (>55 years old) adults inaccurately reported
BMI, with over-reported height and under-reported weight [8]. A solution to this problem may be the
utilization of participant facial photographs to assess BMI.
      With today’s ever-evolving technology, ‘selfies’, iPhone facial recognition, and social media
sites enable users to easily take and display self-portraits. Recently, life insurance companies have
begun offering the option of sending in a selfie to assess health and weight status for eligibility [9].
When performing studies among a population that has grown up in a technology-based atmosphere,
such as current college students, the ease of taking a portrait may entice them to participate in
health interventions [10]. This type of facial recognition software has been used for various reasons
including by the Department of Defense, and for criminal investigations, protection, and emotional
recognition [11,12]. However, increases and decreases in weight in a single participant can make it
difficult for facial recognition technology to accurately identify an individual [13].
      Recent work has examined ways to address changes in weight to improve the accuracy of facial
recognition software. Previous approaches have worked to examine changes in facial features due
to weight fluctuation [13]. Research has shown that facial adiposity demonstrated in photographs of
participant faces has been positively associated with their BMI [13], but there has been limited research
on using this method to estimate an individual’s BMI. The current study will be an extension of testing
for the method developed by Guo and colleagues in 2013, which uses a computational approach to
determine an individual’s BMI from their facial features [14]. As this has been the only study to develop
this approach, further, updated investigation of this method is needed, aimed at improving the ease of
dissemination of intervention programs that aim to capture health-based data. Guo et al.’s previous
approach used over 14,500 facial images of people of different age, race, and gender to formulate BMI
predictions [14]. We propose now to utilize this method with a new cohort of individuals who have
enrolled in a lifestyle intervention study and to predict their BMI from their facial photos.
      The objective of the current study was to test the effectiveness and comparability of a facial image
algorithm for detecting the BMI of participants enrolled in a health intervention, and to compare the
predicted fBMI to their physically collected BMI measurement.

2. Methods
     As part of a larger study, Get Fruved, three cohorts of participants consented as participants
in this study and were enrolled and assessed [15]. The cohorts included (1) upperclassmen college
students (18 years or older), who were partners in the development of the Get Fruved peer-led
social marketing campaign to increase healthier lifestyle among their incoming peers, (2) incoming
freshmen at each university (four interventions and two control), and (3) a subproject of individuals
enrolled in an 8-week dietary intervention aimed at increasing fruit and vegetable consumption.
All individuals were physically assessed at baseline (August 2015) to capture anthropometrics of
height, weight, and a facial picture by a trained researcher. Height was measured via stadiometer
(SECA 213) in a standing position with shoes removed, shoulders relaxed, facing forward, with head up
and back facing the wall. Weight was measured with minimal clothing on via a Tanita TBF-310GS Total
Body Composition Analyzer (Garmin, Tanita Corporation of America, Arlington Heights, IL, USA).
All measures were performed twice and averaged for reliability and accuracy. As eligibility criteria
required participants to be 18 years or older, adult BMI measures were used [16]. BMI was calculated
by dividing measured weight in kilograms by height in meters squared. Classifications of BMI
included:
Technologies 2018, 6, 83 3 of 8
aTechnologies
white paper2018, with
6, x FOR PEER
their REVIEW ID in their photo and photos were saved by ID number to ensure
participant 3 of 8
anonymity of all enrolled.
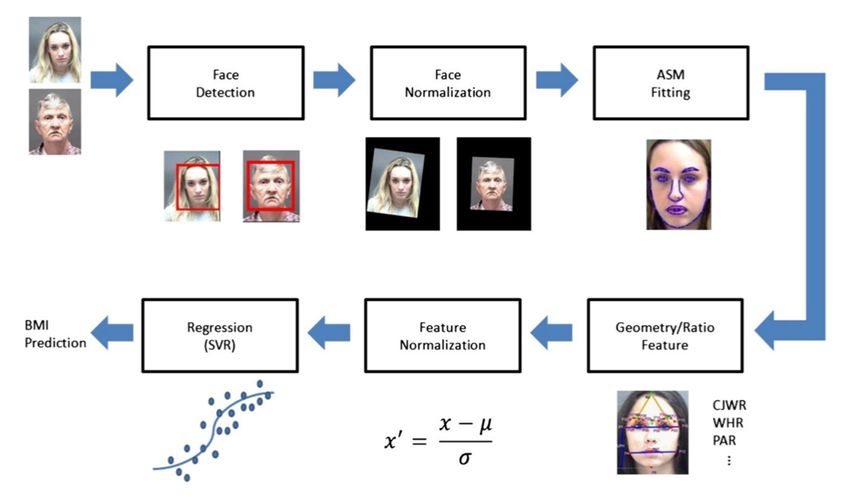
To test the algorithm developed by Wen and Guo, facial images were analyzed by a facial
To test the algorithm developed by Wen and Guo, facial images were analyzed by a facial landmark
landmark detector to identify a number of facial fiducial points, which were then used to compute
detector to identify a number of facial fiducial points, which were then used to compute seven facial
seven facial features. The seven facial features computed were automatically estimated and include
features. The seven facial features computed were automatically estimated and include cheek to jaw
cheek to jaw width (CJWR), width to upper facial height ratio (WHR), perimeter to area ratio (PAR),
width (CJWR), width to upper facial height ratio (WHR), perimeter to area ratio (PAR), eye size (ES),
eye size (ES), lower face to face height ratio (FW/FH), and mean of eyebrow height (MEH). Feature
lower face to face height ratio (FW/FH), and mean of eyebrow height (MEH). Feature normalization
normalization was executed and a regression function arrived at to represent the relation between
was executed and a regression function arrived at to represent the relation between facial measures
facial measures and BMI values. This function was used to compute the BMI for each test face image.
and BMI values. This function was used to compute the BMI for each test face image. Computed
Computed facial BMIs (fBMI) were compared to physically measured BMIs (mBMI) through
facial BMIs (fBMI) were compared to physically measured BMIs (mBMI) through correlation analysis,
correlation analysis, matched pair comparisons, and adjusting the sensitivity of the algorithm to
matched pair comparisons, and adjusting the sensitivity of the algorithm to detecting the reliability of
detecting the reliability of fBMI to mBMI. Methods of analyzing photos are explained in a previous
fBMI to mBMI. Methods of analyzing photos are explained in a previous manuscript, but are generally
manuscript, but are generally described in Figure 1.
described in Figure 1.
Figure 1. Proposed
Figure 1. Proposed framework
frameworkto
topredict
predictbody-mass
body-massindex
index(BMI) from
(BMI) facial
from image.
facial Approach
image. used
Approach by
used
Wen and Guo (2013).
by Wen and Guo (2013).
3. Results
A sample of 1412 young adults were assessed as part of a larger study. study. Sample size calculation
from this population size at 95% confidence level is 292 participants. Completed facial algorithm data
were available on 1210 participants of the larger cohort. Participants were predominately Caucasian
(62.5%) and female
female (69.6%),
(69.6%),and
andwere
wereaverage
averageofof1919years
yearsofofage.
age.Participants
Participants were
were predominately
predominately in
in the normal weight range category, with an mBMI of 18.5–24.9 kg/m 2 (60.2%) (Table 1). Likewise,
the normal weight range category, with an mBMI of 18.5–24.9 kg/m (60.2%) (Table 1). Likewise, with
2
with
fBMIfBMI participants
participants werewere primarily
primarily detected
detected to be
to be in in
thethe normalweight
normal weightcategory
categoryofofBMI
BMI (81.9%).
(81.9%).
Pairwise correlation of mBMI and detected fBMI was significant
detected fBMI was significant (r = (r = 0.3070; p < 0.0001). A regression
model to predict fBMI from mBMI also found a significant relationship
relationship (F(F = (11,208) 125.7; pTechnologies 2018, 6, 83 4 of 8
In comparing participant placement using mBMI and fBMI, we found that 60% of participants were
placed in the correct category using fBMI.
Table 1. Participant demographic and anthropometric characteristics.
Participant Characteristic n Average
Demographics
Gender
Male 359 30.4
Female 823 69.6
Race/Ethnicity
White 520 62.4
Black 85 10.2
Hispanic/Latino 68 8.2
Other (including bi-racial) 160 19.2
Mean ± SD (Range)
Age 956 19.2 ± 1.3
Anthropometrics
Height (cm) 1210 167.7 ± 8.9
Weight (kg) 1210 68.0 ± 15.1
mBMI (kg/m2 ) 1210 24.1 ± 4.5 (14.7–49.7)
fBMI (kg/m2 ) 1210 23.7 ± 1.5 (16.3–28.9)
Table 2. Contingency table of measured body-mass index (mBMI) category placement and facial
body-mass index (fBMI) category placement.
fBMI
Count
Total %
Underweight Normal Overweight Total
Col %
Row %
1 67 2
0.08 5.54 0.17 70
Underweight
10.00 6.76 0.96 5.79
1.43 95.71 2.86
8 632 88
mBMI 0.66 52.23 7.27 728
Normal
80.00 63.77 42.11 60.17
1.10 86.81 12.09
1 228 74
0.08 18.84 6.12 303
Overweight
10.00 23.01 35.41 25.04
0.33 75.25 24.42
0 64 45
0.00 5.29 3.72 109
Obese
0.00 6.46 21.53 9.01
0.00 58.72 41.28
10 991 209
Total 1210
0.83 81.90 17.27
Classifications of BMI included:Technologies 2018, 6, 83 5 of 8
Technologies 2018, 6, x 14.73–49.74
Total range: kg/m2
FOR PEER REVIEW for mBMI and 16.29–28.85 kg/m2 for fBMI. Average fBMI 5 of 8
was 23.7 ± 1.5 kg/m2 2
and average mBMI was 24.1 ± 4.5 kg/m . Difference in average BMI
the mean2018,absolute 2error (MAE) between mBMI and detected fBMI, we found the MAE between the
was 0.4 ± 3.0 kg/m . Matched
Technologies 6, x FOR PEER pair comparison indicated that fBMI detected participant BMI5 of
REVIEW as8
two results to 2 be 3.2 ± 2.9 kg/m . 2
0.4212 kg/m less than mBMI (t(1209) = −3.39, p < 0.0007). A matched pair plot shows analysis
theFigure
in mean 2. absolute
When error (MAE)the
examining between
mean mBMI and
absolute detected
error (MAE)fBMI, we found
between mBMItheand
MAE between
detected the
fBMI,
two results to be 3.2 ± 2.9 kg/m 2.
we found the MAE between the two results to be 3.2 ± 2.9 kg/m . 2
Figure 2. Matched pairs difference: fBMI–mBMI.
Matched pair data plotFigure
shown Matched
2. as pairs between
difference difference:algorithm-predicted
fBMI–mBMI. facial BMI (fBMI) and
Figure 2. Matched pairs difference: fBMI–mBMI.
objectively measured BMI (mBMI). As gender is an important factor in BMI, Figure 3 graph shows
difference
Matched
Matchedbetween
pair gender
pair data
data plot average
plot shown
shown asasofdifference
algorithmbetween
difference predicted
between facial BMI (fBMI) and
algorithm-predicted
algorithm-predicted its BMI
facial
facial relationship
BMI (fBMI) with
(fBMI) and
and
objectively
objectively measured
measured BMI
BMI (mBMI).
(mBMI). As gender is an important factor in BMI, Figure
objectively measured BMI (mBMI). As gender is an important factor in BMI, Figure 3 graph shows 3 graph shows
Bothbetween
difference
difference trajectories
between following
gender
gender averageaof
average similar
of pattern
algorithm
algorithm analysis
predicted
predicted of BMI
facial
facial MAE(fBMI)
BMI of mBMI
(fBMI) and and
and its
its fBMI found
relationship
relationship no
with
with
significant
objectively differences
measured BMIbetween
(mBMI).
objectively measured BMI (mBMI). genders (p = 0.1120).
Both trajectories following a similar pattern analysis of MAE of mBMI and fBMI found no
significant differences between genders (p = 0.1120).
Figure3.3.Gender
Figure Gendersimilarities
similaritiesininrelationship
relationshipofoffBMI
fBMItotomBMI.
mBMI.
4. Discussion Figure 3. Gender similarities in relationship of fBMI to mBMI.
Determining weight status through BMI is a commonly utilized parameter in health-related
4.research
Discussion
studies [1]. When applying research outside the vicinity of one’s home university or research
Determining weight status through BMI is a commonly utilized parameter in health-relatedTechnologies 2018, 6, 83 6 of 8
Both trajectories following a similar pattern analysis of MAE of mBMI and fBMI found no
significant differences between genders (p = 0.1120).
4. Discussion
Determining weight status through BMI is a commonly utilized parameter in health-related
research studies [1]. When applying research outside the vicinity of one’s home university or research
center, however, it may be challenging to obtain anthropometric data such as BMI. Our aim in this
study was to use facial photographs and a previously developed algorithm to estimate BMI [14].
We then compared the estimated facial BMI to our objective BMI calculated from measured participant
anthropometrics to find fMBI correctly identified BMI in 58.4% of cases. fBMI was more accurate in
normal weight and overweight categories than in underweight and obese categories. As stature is not
included in the measurement for fBMI, it is possible that individuals who were considered obese by
objective measurement were of short stature, although their fBMI detected their facial features only
as appearing overweight. Furthermore, as our population was predominately in the ‘normal’ weight
category, the algorithm had better odds at accuratelyn detecting this category.
Although the facial algorithm used in this study was nearly 60% accurate, reliability in research is
vital for accurate results and drawing conclusions. Kocbey et al. [17] examined social media profile
pictures using both examined computer technology and actual human analyses of weight status to
find that the computer and human judges detected similar results for BMI from the photos, with a tiny
difference in results of less than 2%. This demonstration that the algorithm used was very similar to
human visual judgment. A similar study by Dancheva et al. [18] used single-shot facial images of
predominately famous individuals to determine BMI, as compared to the current method used by Wen
and Guo. Dancheva et al. found a smaller range of error (MAE) in their BMI predications compared to
Wen and Guo. Comparing the accuracy of the Wen and Guo method, we find a MAE value slightly
higher than Dancheva et al. (2.3 + 0.6), and at the high end of the range found by Wen and Guo in
their previous work (2.65–4.29) [14,18]. Our findings show that when extending the usage of this
algorithm to collaborative research efforts without the use of controlled photos, the error rate is within
the range detected in previous studies. A method similar to Wen and Guo’s was used by Wolffhechel
and colleagues testing principal components resulting from face shape and color features to find the
best BMI predictor model using 2D principal components of both shape and color [19]. Among more
recent studies that have developed the use of facial imagery to estimate BMI, Pascali and colleagues
examined 3D images of participants to estimate their BMI and found strong correlations between
facial features and BMI [20]. However, the study had a small sample size (n = 30) and participants
were required to travel to the researchers to be scanned by the 3D technology [20]. This burden to the
participant is not feasible for dissemination of lifestyle interventions and this method does not further
the use of simple photographs for detecting BMI, which remains the ultimate goal for improving the
current method.
When looking into the dissemination and implementation of science and the ability to take current
interventions out of the laboratory for use with the public, utilizing BMI as a simple measure can be vital
to capturing data on participants. There are several methods used for measuring BMI which have been
explained here: self-reported measures, an intervention facilitator physically measuring participants,
or the proposed facial image prediction [14]. The utilization of a simple ‘selfie’ from participants
around the world participating in the dissemination of interventions may bridge the gap between
scientists collecting data and community use of projects. However, along with further testing and
improving of the fBMI algorithm, comparing the reliability of self-reported BMI to facial recognition
BMI could be of interest in future research. Self-reported height and weight as well as BMI should be
included in surveys and questionnaires and correlations between mBMI, fBMI, and self-reported BMI
should be analyzed. Understanding the accuracy of both fBMI and BMI measurements and improving
the fBMI algorithm can enhance the dissemination and implementation of research.Technologies 2018, 6, 83 7 of 8
Our current study is not without limitations. As with retrospective analyses and data mining post
intervention, bias can be found with significant results. However, the plan for this subproject was in
place at the start of the overarching project. We understand the bias of BMI, but as a gold standard for
quickly measuring weight status, this was used to test for future intervention dissemination. We had
a wide spread of individuals enrolled in this project; however, they were at four separate sites and
dealt with different researchers. Some photos were rendered illegible by the algorithm and unable to
be used for analysis. However, to address potential poor quality of the photos and reliability of data
capturing, researchers at all sites were trained for inter-rater reliability. When addressing this issue
moving forward, especially in dissemination research, stressing the importance of quality photos with
a clear face will be imperative. We also found considerable error of fBMI compared to mBMI. However,
to our knowledge this was the first study using community researchers to capture and test their own
participant photographs for use with the algorithm. This method needs further testing before it can be
legitimately used by other researchers and the public outside of pure research.
5. Conclusions
This current study aimed to use an algorithm to detect BMI from facial images of young adults to
improve ease of data collection in dissemination research. Using participant photos and performing
a facial detection algorithm to predict BMI was effective for participants in the normal and overweight
categories of BMI. However for individuals falling in the ‘extreme’ categories of underweight and
obese BMI, the algorithm was less effective. Further testing of this algorithm needs to be completed
with additional photographs from community interventions.
Author Contributions: Conceptualization, M.L.B., G.G., S.E.C., M.D.O.; Methodology, M.L.B., S.E.C., G.G.,
M.D.O.; Software, G.G., M.D.O.; Formal analysis, M.L.B., G.G.; Investigation, M.L.B., G.G., M.D.O.; Resources,
G.G., M.D.O.; Data curation, M.L.B., G.G.; Writing—original draft preparation, M.L.B.; Writing—review and
editing, M.L.B., G.G., S.E.C., M.D.O.; Supervision, M.D.O.; Project administration, S.E.C., M.D.O., G.G.; Funding
acquisition, S.E.C., G.G., M.D.O.
Funding: This research was funded by National Institute of Food and Agriculture 2014-67001-21851, West Virginia
University WVA00641, and an NSF grand IIS-1450620.
Acknowledgments: Support or Funding Information Approval to use the dataset was granted by the University of
Tennessee Institutional Review Board prior to study implementation. Authors thank all subjects for participation
in data collection.
Conflicts of Interest: The authors declare no conflict of interest.
References
1. Yaemsiri, S.; Slining, M.M.; Agarwal, S.K. Perceived weight status, overweight diagnosis, and weight control
among US adults: The NHANES 2003–2008 Study. Int. J. Obes. 2010, 35, 1063–1070. [CrossRef] [PubMed]
2. Centers for Disease Control and Prevention (CDC). Defining Adult Overweight and Obesity; Overweight &
Obesity. Available online: https://www.cdc.gov/obesity/adult/defining.html (accessed on 28 August 2018).
3. Singh, A.S.; Chinapaw, M.J.M.; Brug, J.; van Mechelen, W. Process evaluation of a school-based weight gain
prevention program: The Dutch Obesity Intervention in Teenagers (DOiT). Health Educ. Res. 2009, 24, 772–777.
[CrossRef] [PubMed]
4. Pérez, A.; Gabriel, K.P.; Nehme, E.K.; Mandell, D.J.; Hoelscher, D.M. Measuring the bias, precision, accuracy,
and validity of self-reported height and weight in assessing overweight and obesity status among adolescents
using a surveillance system. Int. J. Behav. Nutr. Phys. Act. 2015, 12, S2. [CrossRef] [PubMed]
5. Mozumdar, A.; Liguori, G. Corrective Equations to Self-Reported Height and Weight for Obesity Estimates
among U.S. Adults: NHANES 1999–2008. Res. Q. Exerc. Sport 2016, 87, 47–58. [CrossRef] [PubMed]
6. Pursey, K.; Burrows, T.L.; Stanwell, P.; Collins, C.E. How Accurate is Web-Based Self-Reported Height,
Weight, and Body Mass Index in Young Adults? J. Med. Internet Res. 2014, 16, e4. [CrossRef] [PubMed]
7. Famodu, O.A.; Charlier, C.M.; Barr, M.L.; Colby, S.E.; Zhou, W.; Mathews, A.E.; Olfert, M.D. Self-reported vs.
Measured Height and Weight in Young Adults. FASEB J. 2017, 31, 970–975.Technologies 2018, 6, 83 8 of 8
8. Stommel, M.; Schoenborn, C.A. Accuracy and usefulness of BMI measures based on self-reported weight
and height: Findings from the NHANES & NHIS 2001–2006. BMC Public Health 2009, 9, 421.
9. General, L. Submit a Selfie, Get a Quote for Life Insurance. Available online: https://term.lgamerica.com/
selfie-quote/#!/ (accessed on 28 August 2018).
10. Coyne, S.M.; Padilla-Walker, L.M.; Howard, E. Emerging in a Digital World: A Decade Review of Media Use,
Effects, and Gratifications in Emerging Adulthood. Emerg. Adulthood 2013, 1, 125–137. [CrossRef]
11. Military. US military deploys facial recognition technology in Bin Laden operation. Biom. Technol. Today
2011, 2011, 1. [CrossRef]
12. Zebrowitz, L.A. Finally, Faces Find Favor. Soc. Cognit. 2006, 24, 657–701. [CrossRef]
13. Wen, L.; Guo, G.; Li, X. A study on the influence of body weight changes on face recognition.
In Proceedings of the 2014 IEEE International Joint Conference on Biometrics (IJCB), Clearwater, FL, USA,
29 September–2 October 2014; pp. 1–6.
14. Wen, L.; Guo, G. A computational approach to body mass index prediction from face images.
Image Vis. Comput. 2013, 31, 392–400. [CrossRef]
15. Colby, S.; Kattelmann, K.; Olfert, M.; Mathews, A.; Kidd, T.; Brown, O.; Horacek, T.; White, A. “Get Fruved”:
A Peer-Led, Trained-the-Trainer Social Marketing Intervention to Increase Fruit and Vegetable Intake and
Prevent Childhood Obesity. J. Nutr. Educ. Behav. 2015, 47, S109. [CrossRef]
16. Nissinen, K.; Mikkilä, V.; Männistö, S.; Lahti-Koski, M.; Räsänen, L.; Viikari, J.; Raitakari, O.T. Sweets and
sugar-sweetened soft drink intake in childhood in relation to adult BMI and overweight. The Cardiovascular
Risk in Young Finns Study. Public Health Nutr. 2009, 12, 2018–2026. [CrossRef] [PubMed]
17. Kocabey, E.; Camurcu, M.; Ofli, F.; Aytar, Y.; Marin, J.; Torralba, A.; Weber, I. Face-to-BMI: Using computer
vision to infer body mass index on social media. arXiv 2017, arXiv:170303156.
18. Dantcheva, A.; Bremond, F.; Bilinski, P. Show me your face and I will tell you your height, weight and body
mass index. In Proceedings of the International Conference on Pattern Recognition (ICPR), Beijing, China,
20–24 August 2018.
19. Wolffhechel, K.; Hahn, A.C.; Jarmer, H.; Fisher, C.I.; Jones, B.C.; DeBruine, L.M. Testing the utility of
a data-driven approach for assessing BMI from face images. PLoS ONE 2015, 10, e0140347. [CrossRef]
[PubMed]
20. Pascali, M.A.; Giorgi, D.; Bastiani, L.; Buzzigoli, E.; Henríquez, P.; Matuszewski, B.J.; Morales, M.-A.;
Colantonio, S. Face morphology: Can it tell us something about body weight and fat? Comput. Biol. Med.
2016, 76, 238–249. [CrossRef] [PubMed]
© 2018 by the authors. Licensee MDPI, Basel, Switzerland. This article is an open access
article distributed under the terms and conditions of the Creative Commons Attribution
(CC BY) license (http://creativecommons.org/licenses/by/4.0/).You can also read