Detection of Gas Flares Using Satellite Imagery - ThinkMind
←
→
Page content transcription
If your browser does not render page correctly, please read the page content below
PATTERNS 2021 : The Thirteenth International Conference on Pervasive Patterns and Applications

                                   Detection of Gas Flares Using Satellite Imagery

                                 Alexander Troussov, Dmitry Botvich and Sergey Vinogradov
                               International laboratory for mathematical modelling of social networks,
                                                             RANEPA,
                                                           Moscow, Russia
                             e-mails: troussov@gmail.com, dbotvich@gmail.com, derbosebar@gmail.com

   Abstract—During the extraction, transportation and processing      it is also desirable to classify the flares by type of enterprise
of oil, associated petroleum gas is formed, which is usually          (upstream, transportation, downstream processing).
disposed in flares. Monitoring these flares is an important
                                                                         In our paper [4], methods of manual correction of the list
environmental challenge. Objective instrumental methods for
detecting gas flares and assessing the volumes of gas burnt on        of gas flares for the territory of Russia are described based
them are based on multi-spectral remote sensing of the nighttime      on the use of various additional sources and databases. For
Earth. To refine the list, a manual check is used, which includes     example, the presence of an object in the authoritative list
a visual examination of the locations of the alleged gas flares on    CEDIGAS (The International Association For Natural Gas),
high-resolution daytime images. Automating this check reduces
                                                                      is a confirmation of the eligibility of including the object in
the cost of monitoring flares. The paper proposes a method
for verifying the list of high-temperature anomalies, based on        the ”final list”. If the coordinates of an object are not included
the classification of images of objects in daytime images. The        in the boundaries of licensed areas for oil production, then
classification is carried out using machine learning methods.         in the conditions of Russia this object can be confidently
                                                                      excluded from objects of the upstream type. However, such
    Keywords—night lights; light pollution; viirs; image              manual corrections are laborious and time-consuming, and
processing; machine learning; deep learning.                          flare monitoring needs to be done on a continuous basis with
                                                                      a high temporal resolution. Automation of verification, even
                     I. INTRODUCTION
                                                                      partial, reduces the cost of monitoring flares. If we consider
   During the extraction, transportation and processing of oil,       the monitoring of gas flares in areas of armed conflict, where
associated petroleum gas is formed, which is usually disposed         illegal oil production and processing may take place, then the
in flares. Monitoring these flares is an important environ-           automation of gas flare testing becomes uncontested.
mental challenge (see materials of the World Bank’s Global               In this paper, we propose a method for checking the list
Gas Flaring Reduction Partnership). Objective instrumental            of high-temperature anomalies obtained on the basis of NTL
methods for detecting gas flares and assessing the volumes            data, based on the classification of images of objects in
of gas burnt on them are based on multi-spectral remote               daytime images. The classification is carried out using machine
sensing of the nighttime Earth. The sensor Visible Infrared           learning methods.
Imaging Radiometer Suite (VIIRS) is used by satellites (Suomi            The paper is organized as follows. In Section II, we describe
National Polar-orbiting Partnership (Suomi NPP) and NOAA-             the satellite data used in the paper. Our approach to the
20 weather satellite) at nighttime to collect imagery and radio-      correction of gas flares list is outlined in Section III. In Section
metric measurements of the land, atmosphere and oceans in             IV, we present the image transformation process, including
the visible and infrared bands of the electromagnetic spectrum.       image coding, image descriptor extraction, etc. In Section
These data make it possible to find high-temperature anomalies        V, we present some preliminary results. Finally, Section VI
on the Earth’s surface, and by the spectrum of radiation              concludes the paper.
to distinguish gas flares from, for example, forest fires and
greenhouses. The most famous algorithm for finding gas flares                        II. SATELLITE IMAGE DATA
from Earth remote sensing data is the VIIRS Nightfire (VNF)
algorithm [1], [2], [3].                                                 The original flare list used in this work is part of the list
   The refinement of this algorithm for use on the territory          of associated petroleum gas flares in Russia obtained in the
of Russia is described in our paper [4]. However, the list of         course of our work described in [4]. For each prospective
gas flares obtained using the VNF method is not completely            gas flare, a high-resolution daytime image was selected that
correct. Among the main factors that make the presence of             covered the location of the supposed flare. Some of these data
errors inevitable, we mention the low temporal resolution of          are labeled - that is, it is known whether or not there is a
satellite data (satellites do not often fly over objects, objects     gas flare a given point. In addition, during the training phase,
can be covered by clouds), and interference in observations           we added a manually selected set of daytime images that do
that are difficult to eliminate (snow cover, polar nights).           not contain gas flares, but there are production facilities that
Additional work is required to compile a “final list” of gas          may visually resemble oil and gas production and processing
flares from a “preliminary list” of gas flares. In the “final list”   facilities.

Copyright (c) IARIA, 2021.     ISBN: 978-1-61208-850-1                                                                                   45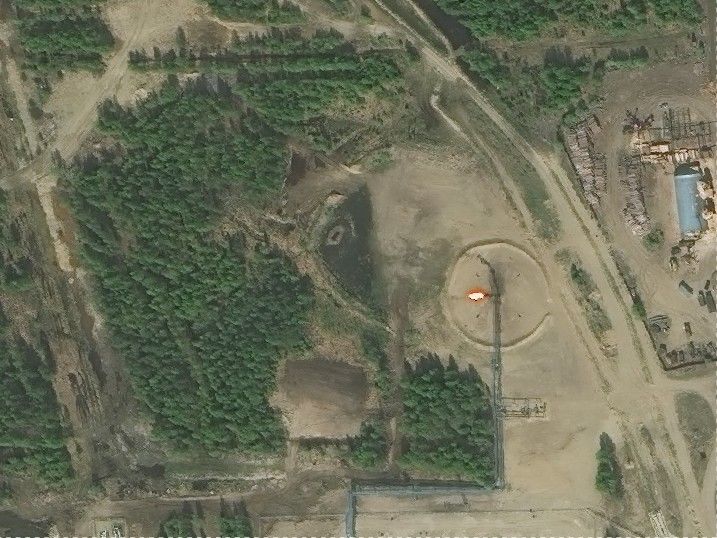
PATTERNS 2021 : The Thirteenth International Conference on Pervasive Patterns and Applications

   The VNF algorithm utilizes near-infrared and short-wave              ∙  images may have additional features such as snow cover,
infrared data at night, gathered by the VIIRS on board satel-              which also distorts the original.
lites NPP and NOAA-20 [3]. In [4] we used a version of the              All these factors significantly affect the quality of the clas-
VNF algorithm adapted to the conditions of Russia. The total         sification and should be taken into account when developing
number of gas flares detected in [4] is about two and a half         a classifier.
thousand.
   We used also daytime satellite imagery from the webserver                IV. DATA FOR THE CLASSIFIERS TRAINING
TerraServer to compile a “final list” of gas flares based on            This section describes the data and machine learning classi-
a “tentative list” of gas flares. The resolution of the daytime      fiers used for the training and evaluation of the satellite image
images is about 1m per pixel.                                        classification. The image transformation techniques are also
                                                                     discussed in this section.
      III. CHECKING AND CORRECTION OF GAS
                   FLARES LIST                                       A. Training data sets
                                                                        We use satellite imagery (from the TerraServer web site) for
   First of all, we note that a wide variety of third-party
                                                                     the period 2010-2017 (GasFlareData dataset). The resolution
external sources can also be used when considering whether a
                                                                     of images from this dataset is within 1 m per pixel. The images
snapshot contains a gas flare. For example, in many countries
                                                                     include both different types of gas flares and images where
the licensing of oil areas for oil production (for example, in the
                                                                     there are no gas flares. As a rule, pictures are presented for
USA, Saudi Arabia, Russia, etc.) works quite effectively(and
                                                                     different moments in time (usually 3-10 variants), both in color
reliably. The lists of such areas (i.e., their coordinates) are
                                                                     and in black and white. Images also often contain ”clouds”
publicly available and can be used for the evaluation if a
                                                                     and ”snow cover” as natural disturbances in our classification
particular area is actually the oil area.
                                                                     task. There are also in small numbers simply spoiled pictures.
   Here, we consider a different approach based on the daytime
                                                                     Figures 1, 2 and 3 show examples of images from the used
satellite image classification. We are using machine learning
                                                                     dataset.
techniques here to adjust the ”final list” of gas flares based
on some ”tentative list” of gas flares. The input data for
us are the geographic coordinates of the alleged gas flares,
which are used to extract recent daily satellite data, and
then these images are analyzed by our automatic classifier
(called, ClassGasFlare), which determines the type of gas
flare from the image (by specialization enterprises: production,
transportation, upstream processing, downstream processing)
or lack of flares in the picture.
   Since manual correction of this data is quite laborious
and time-consuming, automating the check of the list can
significantly reduce this work and helps to close the entire
verification technological cycle: from automatic acquisition of
images from the data cloud to their classification according
to the type of gas flare or the absence of gas flares. In those
cases when the automatic classifier has a ”difficult” case, then
only these ”difficult” cases can be left for manual additional
verification, which significantly reduces the volume of manual
work.
   We train our classifier on a sufficiently large volume of
historical images, where they are labeled as (flare-dobycha,
flare-transport, flare-upstream, flare-downstream, flare-no) de-
pending on the type of oil production or simply as (flare-yes,
flare-no) to classify the presence or absence of oil production.
Thus, formally, in terms of machine learning, we get the
picture classification problem. In a first approximation, this
is true, but there are some important aspects that significantly            Figure 1: Examples of ”clean” upstream flare images.
complicate this task. For example, aspects such as:
  ∙   images can cover partially our objects (where the gas flare       Moreover, it would be more correct to consider our task as
      is located),                                                   a task for the presence of certain types of scenes (scene detec-
  ∙   images can be ”naturally spoiled” (for example, by clouds      tion), which in itself, as a rule, is much more complicated than
      that cover part of the surface in the image),                  the usual classification. We only note that we do not consider

Copyright (c) IARIA, 2021.   ISBN: 978-1-61208-850-1                                                                                  46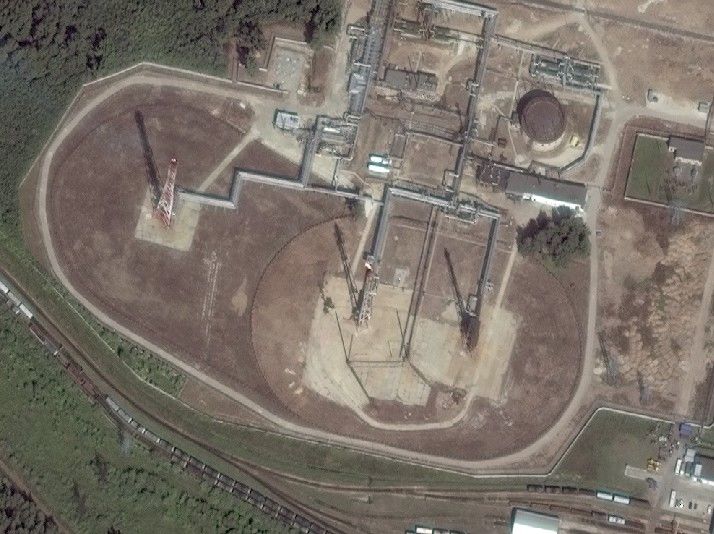
PATTERNS 2021 : The Thirteenth International Conference on Pervasive Patterns and Applications
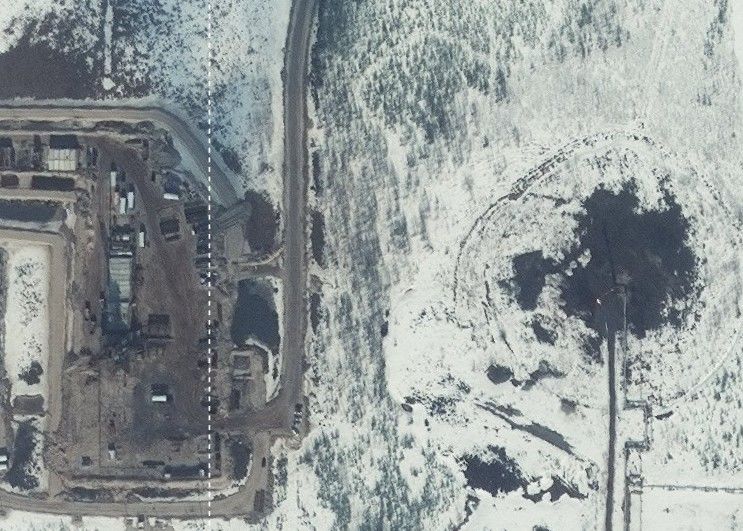
Figure 2: Examples of ”clean” downstream flare images. Figure 3: ”Unclean” examples of flare images: downstream
flare, covered with clouds (on the left) and upstream flare,
covered with snow (on the right).
the approach from the point of view of scene detection in this
work.
themselves, both at the stage of training and at the stage of
B. Image extractors and descriptors: SIFT and SURF algo- using the classifier.
rithms
C. Image Data Set Augmentation
This section provides an overview of the various experi-
ments we use to evaluate the performance of the algorithm The quality and quantity of datasets is very important as this
for image classification. The set of raw data used in our ex- affects the accuracy of machine learning algorithms, as well
periments is described here. The following describes methods as it is related to overfitting and underfitting problems. We
for transforming images and methods for obtaining feature increase the size of the training data by using augmentation
descriptors (including SIFT, SURF, etc.). Then, preliminary techniques, e.g., cropping, rotating, shifting and scaling of
results of our work on evaluating the accuracy of the algorithm original images. As SIFT and SURF are invariant with respect
for classifying images with flares are presented. to rotating, shifting and scaling we do not use them with SIFT
Both of these methods have an important feature: they are and SURF algorithms but we use cropping technique. On other
relatively insensitive to both scaling and rotation of images. hand, for deep learning models, in particular, for we use all of
This is very important for our task, since our images can them: including rotating, shifting, scaling as well as cropping
be with different scaling and resolution, and are oriented in extensively. Overall, the image augmentation helps to improve
different ways. The scale-invariant feature transform (SIFT) the prediction accuracy of the model. In our experiments after
[5] [6] was the first algorithm with similar properties, and the applying the augmentation technique, the data set (about 11000
speeded up robust features (SURF) algorithm [7] improves it images) is increased approximately by factor 2 (about 22000
overall: SURF is faster and more robust than SIFT. The result images).
of SIFT and SURF is a certain finite-dimensional vector of
descriptors, and the order of the elements itself is not important D. Classifier training process
in this vector of descriptors, i.e., this means that in fact it is a The encoded image feature vectors from each category
set. An image descriptor vector is a kind of histogram of the of images are used in the classifier training process for the
visual elements it contains. SVM and Random Forrest algorithms to create a predictive
After using SIFT or SURF algorithms, one can use the function of the model. Figure 4 demonstrates the steps of the
corresponding descriptors of pictures instead of the pictures image preparation used in our image classification approach.
Copyright (c) IARIA, 2021. ISBN: 978-1-61208-850-1 47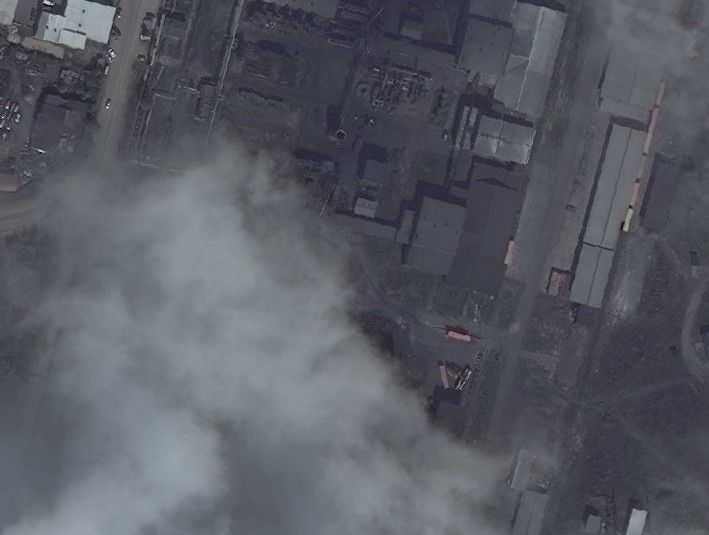
PATTERNS 2021 : The Thirteenth International Conference on Pervasive Patterns and Applications

It is based on a more generic framework for image data                 TABLE I. THE AVERAGE ACCURACY RESULTS FOR THE TWO
transformation discussed in [10].                                                                  CLASSES

                                                                       Data                       SVM        Random     CNN
                                                                                                             Forrest

                                                                       Upstream ”Clean”           0.81       0.79       0.75

                                                                       Downstream ”Clean”         0.78       0.78       0.74

                                                                       Upstream ”all”             0.79       0.76       0.75

                                                                       Downstream ”all”           0.77       0.76       0.74

                                                                         TABLE II. THE AVERAGE ACCURACY RESULTS FOR THE
                                                                                                 THREE CLASSES

                                                                       Data                       SVM        Random     CNN
                                                                                                             Forrest

                                                                       Upstream,   ”clean”   +    0.72       0.71       0.70
    Figure 4: Stages of processing for gas flare images.               Downstream, ”clean”

                                                                       Upstream, ”all + Down-     0.70       0.70       0.68
    V. EXPERIMENTS WITH THE FLARE IMAGE                                stream, ”all”
              CLASSIFICATION
   In this section, we describe the experiments we use to
                                                                     ”clean”). The rest of the images (i.e., 30% of all images) are
evaluate the quality of classifiers for classifying gas flare
                                                                     included in the test data set and are used during the forecast
images.
                                                                     evaluation stage. Preliminary experiments also demonstrate
   We are interested in the average accuracy measurement and
                                                                     that the achieved average forecast accuracy for the three
the ”the confusion matrix” for various experiments. For this
                                                                     classes is about 70% (see TABLE II).
we use different categories of images and their groups from
the GasFlareData data set.
   Note that the results below are preliminary, and the classi-               VI. CONCLUSION AND FUTURE WORK
fiers themselves are far from optimal. This is especially true
                                                                        In this paper, a method for checking and correcting the
for the results on the application of the deep learning (CNN
                                                                     list of high-temperature anomalies obtained on the basis of
classifier).
                                                                     nighttime light data is proposed. The image classification of
Experiment 1. Measuring classification accuracy from data            daytime satellite images is used for this purpose. It is carried
(”all” or ”clean”) into categories (upstream and downstream)         out using machine learning methods.
using SURF extractor for SVM [8], Random Forrest [9]                    Various machine learning methods and algorithms to clas-
and without using SURF in the case of the CNN classifier.            sify the gas flare images from the GasFlareData set is applied.
Here a classifier (SVM, Random Forrest and CNN) is used              The up-to-date solutions that generally demonstrate the most
to create a prediction model based on two image classes,             acceptable classification quality in a wide variety of applica-
including (1) ”presence of a gas flare” and (2) ”no gas flare”.      tions are used. The process of preparing images for classifi-
Each category of data sets (upstream and downstream) is              cation, including special image encoding operations such as
considered separately here. In the training process, we use          the well-known SIFT and SURF algorithms, is presented. For
70% of the entire set of images from each category for the           different variants of datasets: ”clean” (including only those
training purposes. The rest of each image set (i.e., 30% of          that do not contain clouds or snow) and ”all” (including
all images ) are used during the forecast evaluation stage.          those that do not contain clouds and/or snow), the flare image
Our measurements show that the achieved average forecast             classification is performed.
accuracy is about 75% (see TABLE I).                                    In experiments, the preliminary comparison of the classifica-
                                                                     tion quality for different machine learning methods (including
Experiment 2. Measuring classification accuracy from data            SVM, random forest, Convolutional Neural Networks (CNN))
(”all” or ”clean”) combined categories (upstream + down-             both with and without image encoding operations is carried
stream) using SURF extractor for SVM, Random Forrest and             out. Both the variants of the input data (”clean” or ”all”) are
without using SURF for CNN. Here the SVM, Random Forrest             evaluated. The following average forecast accuracy is achieved
and CNN classifier are used to generate a prediction model           in the experiments: about 75% for the two classes and about
based on three image classes: ((1) ”downstreanm gas flare            70% for the three classes.
presence”, (2) ”upstreanm gas flare presence” or (3) ”gas               Future work concerns the improvement of the classification
flare absence”). During training we use 70% of the whole             accuracy of the machine learning models used in the paper.
set of images (downstream + upstream) for data (”all” or             We also plan to apply the other deep learning architectures to

Copyright (c) IARIA, 2021.   ISBN: 978-1-61208-850-1                                                                                48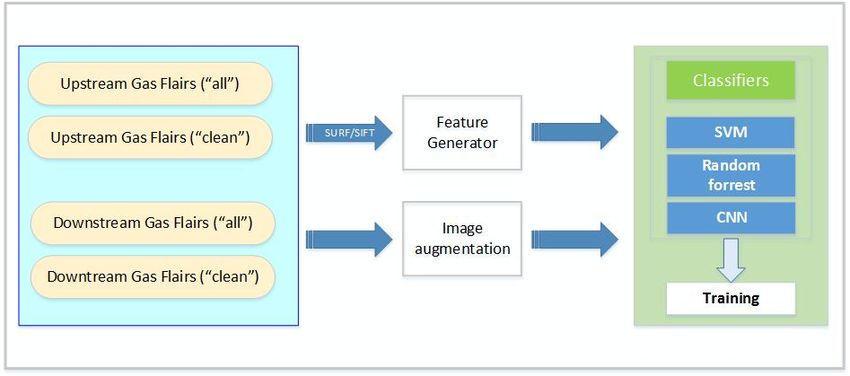
PATTERNS 2021 : The Thirteenth International Conference on Pervasive Patterns and Applications

the problem of interest and compare them with the all other
classifiers.
                       ACKNOWLEDGMENT
   We thank Mikhail Zhizhin at the Colorado School of Mines,
Golden, USA and Alexey Poyda at the National Research
Centre ”Kurchatov Institute”, Moscow, Russia for fruitful
discussions and collaboration in collecting samples of satellite
images.
                            R EFERENCES
 [1] Earth      Observation      Group,      Payne       Institute,  Colorado
     School of Mines, Golden, USA [Online]. Available from:
     https://payneinstitute.mines.edu/eog/viirs-nightfire-vnf/      [retrieved:
     March, 2021].
 [2] C.Elvidge, M. Zhizhin, F-C. Hsu and K. Baugh, “VIIRS nightfire:
     Satellite pyrometry at night”. Remote Sensing, 5, no. 9, 2013, pp.4423-
     4449.
 [3] C. Elvidge, M. Zhizhin, K. Baugh, F-C. Hsu and T. Ghosh, “Methods
     for Global Survey of Natural Gas Flaring from Visible Infrared Imaging
     Radiometer Suite Data”. Energies, 9(1), 14, 2016, pp.1-15.
 [4] A. Matveev, A. Andreev, M. Zhizhin and A. Troussov, “Satellite Moni-
     toring of Associated Gas Flaring Torches in Russia” (In Russian). SSRN
     Electronic Journal, DOI: 10.2139/ssrn.3362303, January 2019.
 [5] D. G. Lowe, “Object recognition from local scale-invariant features”.
     Proceedings of the International Conference on Computer Vision. 2.
     1999, pp. 1150–1157.
 [6] D. G. Lowe, “Distinctive Image Features from Scale-Invariant Key-
     points”. International Journal of Computer Vision. 60 (2), 2004,
     pp.91–110.
 [7] H. Bay, T. Tuytelaars and L. Van Gool, “Surf: Speeded up robust
     features”. European conference on computer vision, 2006, pp.404-417.
 [8] H. Drucker, C. Burges, L. Kaufman, A. J. Smola, and V. Vapnik, “Sup-
     port Vector Regression Machines”, in Advances in Neural Information
     Processing Systems 9, NIPS 1996, 1997, pp.155–161.
 [9] L. Breiman, “Random Forests”. Machine Learning, 45, pp.5-32, 2001.
[10] S. Loussaief and A. Abdelkrim, “Machine Learning framework for
     image classification”. Advances in Science, Technology and Engineering
     Systems Journal, 3, 2018, pp.1-10.

 Copyright (c) IARIA, 2021.        ISBN: 978-1-61208-850-1                                        49
You can also read