DETECTIONS OF NUCLEAR EXPLOSIONS BY TRIPLE COINCIDENCE - UPPSALA UNIVERSITY DEPARTMENT OF PHYSICS AND ASTRONOMY MARIELLE AKSÉR JULY 1, 2021 - DIVA
←
→
Page content transcription
If your browser does not render page correctly, please read the page content below
Detections of nuclear explosions by triple
               coincidence

                  Uppsala University
          Department of Physics and Astronomy

                    Marielle Aksér

                      July 1, 2021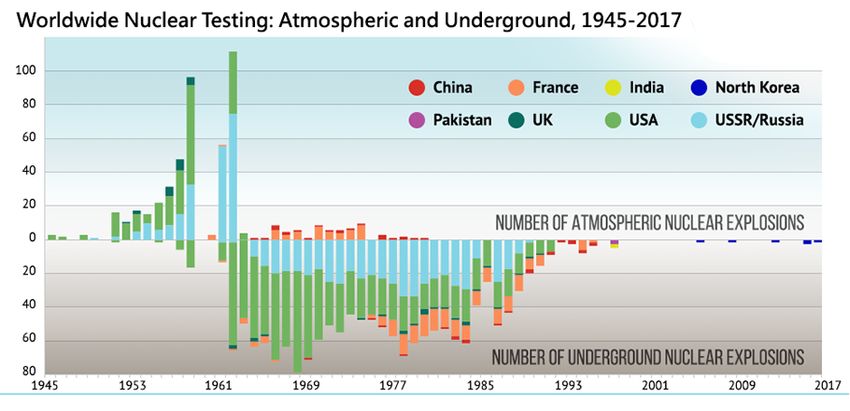
Detections of nuclear explosions by triple coincidence

       Dissertation in partial fulfillment of the requirements for the degree of

                  MASTER OF SCIENCE WITH A MAJOR IN PHYSICS

                                   Uppsala University
                        Department of Physics and Astronomy

Supervisor,        Peter Jansson

Subject reader,    Cecilia Gustavsson

Examiner,          Andreas Korn

                                        July 1, 2021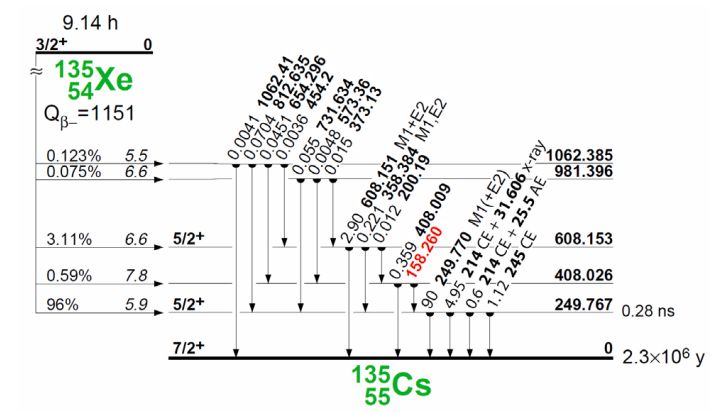
II

Abstract

When a nuclear explosion occurs certain radionuclides are emitted, notably xenon. Due
to the fact that xenon is a noble gas, it is hard to contain and can therefore be detected
far from the explosion site. There are four isotopes of xenon that are of interest in
the detection of a nuclear explosion:   131m Xe, 133m Xe, 133 Xe   and   135 Xe.   By constantly
measuring the amount of these isotopes in the air, changes in the concentration in an
indication that a nuclear explosion has occurred.

In this thesis a detector was modelled in GEANT4 and focuses on one kind of noble gas
detector: SAUNA - the Swedish Automatic Unit for Noble gas Acquisition. SAUNA
uses the coincidence technique in order to determine the concentration of xenon there
is in the air. By using the coincidence technique, it is possible to reduce the impact of
the background radiation and therefore increase the efficiency of the detector.        133 Xe   has
a coincidence when it first undergoes beta decay, with an endpoint energy of 346 keV,
and then emits a 80 keV gamma particle.    135 Xe   has also a dual coincidence, a beta decay
with an endpoint energy of 910 keV together with a 250 keV gamma-ray. However both
these isotopes have a triple coincidence decay that also can be exploited: for 133 Xe, a
beta particle with endpoint energy of 346 keV, a 30 keV X-ray and a 45 keV conversion
electron, while for 135 Xe there is instead of the gamma particle a 30 keV X-ray and a 214
keV conversion electron that can be emitted together with the beta particle. The 30 keV
X-ray together with the beta particle for 133 Xe can also be used as a dual coincidence, in
that case the conversion electron is ignored.

For 133 Xe, when a beta particle, a 45 keV conversion electron, and a 30 keV X-ray are
emitted, the model was able to detect all three particles in 69.2% ± 0.1 of the cases.
However, when only the particles with a detected energy within a 5 keV interval of their
generated energies are considered to be in coincidence, then for 133 Xe triple coincidence
occurs in 22.9% ± 0.2 of the cases. For   135 Xe    the model was able to detect the triple
coincidence (between a beta, 214 keV CE and 30 keV X-ray) in 63.5% ± 0.1 of the cases.

This work shows that adding another particle in a coincidence reduces the chance to
detect the coincidence. The positive effect of adding another particle in a coincidence
is that the minimum detectable concentration of xenon should be smaller. The goal for
future detectors should be to make it possible for the detector to take advantage of the
triple coincidences but at the same time be also able to use the dual coincidences.
III

Populärvetenskaplig sammanfattning

1945 släppte USA två kärnvapenbomber över Japan i samband med andra världskriget.
Skillnaden mellan en vanlig bomb och en kärnvapenbomb är att en kärnvapenbomb
också släpper ut farliga ämnen samt radioaktiv strålning i och med sin detonation. Dessa
stannar inte på detonationsplatsen utan kan även sprida och utsätta människor och djur
långt ifrån detonationen för fara. Från mitten av 1900-talet har det arbetats för att förhin-
dra användandet av kärnvapen. 1996 kom ett internationellt avtal, the Comprehensive
Nuclear-Test-Ban Treaty (CTBT). Avtalet förbjuder alla former av kärndetonationer på
jorden, oavsett om det är ur ett militärt, civilt eller i något annat syfte. Tyvärr har inte
alla världens länder bekräftat avtalet ännu.

För att säkerställa att avtalet följs behöver man ett kontrollsystem. I en kärnexplosion
släpps specifika ämnen ut och genom att hela tiden mäta vilka ämnen som finns i luften
kan man upptäcka om dessa specifika ämnen dyker upp. Gör de det, betyder det att
en kärnexplosion har skett. Sedan kan man, genom vindanalyser, komma fram till var
explosionen skett. Ett av världens kontrollsystemen som används har Totalförsvarets
forskningsinstitut, FOI, utvecklat, kallad SAUNA - the Swedish Automatic Unit for
Noble gas Acquisition.

SAUNA använder sig utav s.k. koincidence-teknik, det betyder att man försöker mäta
flera partiklar samtidigt. I SAUNA så använder man dubbel koincidence, dvs. man
mäter två partiklar samtidigt. I detta examensarbete så undersöker jag möjligheten att
detektera tre partiklar samtidigt, dvs. trippel-koincidence. Fördelen med trippel jämfört
med dubbel är att även om det skulle finnas mindre mängder av ämnet i luften kan man
detektera det ändå. För att testa detta så gjorde jag datorsimuleringar.

Resultatet blev att sannolikheten att detektera tre partiklar var lägre än att detektera
två, men fördelen att man kan detektera mindre mängder av ämnet väger upp den
låga sannolikheten. Det betyder att framtida detektorer borde ändå använda sig utav
trippel-koincidence (utöver dubbel) och på så sätt bli ännu bättre i arbetet att upptäcka
ifall något land utför ett kärnvapenprov.
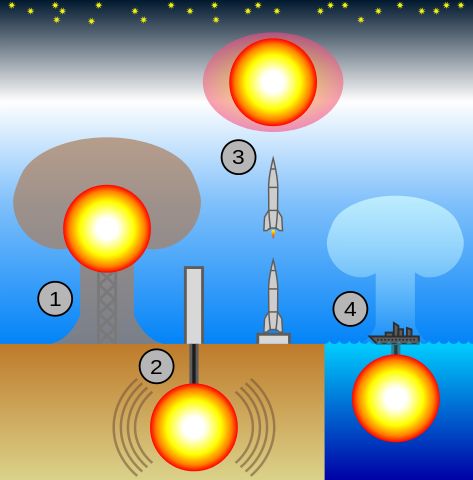
Table of Contents                                                                                IV

Table of Contents

Abstract                                                                                          II

Populärvetenskaplig sammanfattning                                                               III

List of Tables                                                                                   VI

List of Figures                                                                                  VII

1   Introduction                                                                                   1

2   Theory                                                                                         5
    2.1   SAUNA . . . . . . . . . . . . . . . . . . . . . . . . . . . . . . . . . . . . . .        5
    2.2   Coincidence technique . . . . . . . . . . . . . . . . . . . . . . . . . . . . .          6
    2.3   Efficiency of the SAUNA detector . . . . . . . . . . . . . . . . . . . . . . .          10
    2.4   GEANT4 . . . . . . . . . . . . . . . . . . . . . . . . . . . . . . . . . . . . .        11

3   Methodology                                                                                   12
    3.1   Building the detector . . . . . . . . . . . . . . . . . . . . . . . . . . . . . .       12
    3.2   Implementation of the coincidence in GEANT4 . . . . . . . . . . . . . . .               12
    3.3   Obtaining the energy distribution of the beta particle . . . . . . . . . . .            13
    3.4   Checking the detector model . . . . . . . . . . . . . . . . . . . . . . . . .           14

4   Results                                                                                       15
    4.1   The detector model . . . . . . . . . . . . . . . . . . . . . . . . . . . . . . .        15
    4.2   Xenon 133 . . . . . . . . . . . . . . . . . . . . . . . . . . . . . . . . . . . .       16
          4.2.1   Efficiency . . . . . . . . . . . . . . . . . . . . . . . . . . . . . . . .      17
          4.2.2   Beta particles energy distribution . . . . . . . . . . . . . . . . . . .        19
    4.3   Xenon 135 . . . . . . . . . . . . . . . . . . . . . . . . . . . . . . . . . . . .       20
          4.3.1   Efficiency . . . . . . . . . . . . . . . . . . . . . . . . . . . . . . . .      20
          4.3.2   Beta particles energy distribution . . . . . . . . . . . . . . . . . . .        22

5   Discussion                                                                                    24
    5.1   The model . . . . . . . . . . . . . . . . . . . . . . . . . . . . . . . . . . . .       24
    5.2   Beta spectrum . . . . . . . . . . . . . . . . . . . . . . . . . . . . . . . . . .       25
    5.3   Efficiency . . . . . . . . . . . . . . . . . . . . . . . . . . . . . . . . . . . . .    26
    5.4   Triple coincidence . . . . . . . . . . . . . . . . . . . . . . . . . . . . . . . .      27

6   Conclusion                                                                                    29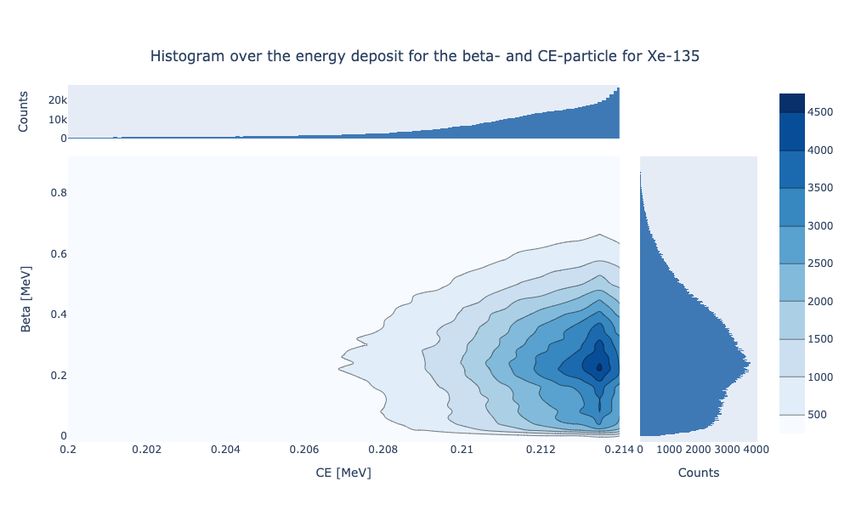
Table of Contents   V

7   Outlook         30

Acknowledgements    31

References          32
List of Tables                                                                                     VI

List of Tables

Table 2.1: Decay energies and types for the four isotopes of xenon . . . . . . . . .                8
Table 2.2: Calculated efficiencies of SAUNA-detector . . . . . . . . . . . . . . . .               10
Table 2.3: The total-, γ- and β-efficiencies of the SAUNA-detector . . . . . . . . .               11

Table 4.1: Triple coincidence result for 133 Xe . . . . . . . . . . . . . . . . . . . . . .        18
Table 4.2: Dual coincidence result for      133 Xe   . . . . . . . . . . . . . . . . . . . . . .   19
Table 4.3: Triple coincidence result for 135 Xe . . . . . . . . . . . . . . . . . . . . . .        21
Table 4.4: Dual coincidence result for      135 Xe   . . . . . . . . . . . . . . . . . . . . . .   22

Table 5.1: Comparison between the efficiency of SAUNA and the simulations for
           133 Xe   . . . . . . . . . . . . . . . . . . . . . . . . . . . . . . . . . . . . . .    27
Table 5.2: Comparison between the efficiency of SAUNA and the simulations for
           135 Xe   . . . . . . . . . . . . . . . . . . . . . . . . . . . . . . . . . . . . . .    27
List of Figures VII
List of Figures
Figure 1.1: Four major types of nuclear testing . . . . . . . . . . . . . . . . . . . . 1
Figure 1.2: Worldwide nuclear testing between 1945 - 2018 . . . . . . . . . . . . . 2
Figure 1.3: Worldwide nuclear testing: atmospheric and underground . . . . . . 2
Figure 2.1: Schematic drawing of SAUNA . . . . . . . . . . . . . . . . . . . . . . . 6
Figure 2.2: Two-dimensional energy spectra . . . . . . . . . . . . . . . . . . . . . 7
Figure 2.3: Decay scheme for 133 Xe . . . . . . . . . . . . . . . . . . . . . . . . . . . 9
Figure 2.4: Decay scheme for 135 Xe . . . . . . . . . . . . . . . . . . . . . . . . . . . 9
Figure 3.1: Beta energy distribution for 133 Xe . . . . . . . . . . . . . . . . . . . . . 13
Figure 3.2: Beta energy distribution for 135 Xe . . . . . . . . . . . . . . . . . . . . . 13
Figure 3.3: Calibration spectra for 137 Cs . . . . . . . . . . . . . . . . . . . . . . . . 14
Figure 4.1: Detector model over SAUNA . . . . . . . . . . . . . . . . . . . . . . . 15
Figure 4.2: β-γ coincidence spectra for 137 Cs . . . . . . . . . . . . . . . . . . . . . 16
Figure 4.3: Events needed before the amount of the detection of three particles
converges . . . . . . . . . . . . . . . . . . . . . . . . . . . . . . . . . . . 17
Figure 4.4: 2D-histogram over the energy deposit of the conversion electron and
the beta particle for 133 Xe . . . . . . . . . . . . . . . . . . . . . . . . . . 18
Figure 4.5: Histogram over the energy deposit for the beta particle for 133 Xe . . . 20
Figure 4.6: 2D-histogram over the energy deposit of the conversion electron and
the beta particle for 135 Xe . . . . . . . . . . . . . . . . . . . . . . . . . . 21
Figure 4.7: Histogram over the energy deposit for the beta particle for 135 Xe . . . 23
Figure 5.1: Detector model over SAUNA . . . . . . . . . . . . . . . . . . . . . . . 24
Figure 5.2: Calibration spectra comparison between the simulations and a physical
detector . . . . . . . . . . . . . . . . . . . . . . . . . . . . . . . . . . . . 25
Figure 5.3: Histogram over the energy deposit for the beta particle for 135 Xe and
135 Xe . . . . . . . . . . . . . . . . . . . . . . . . . . . . . . . . . . . . . . 25
Figure 5.4: Histogram over 135 Xe beta particle in both detectors . . . . . . . . . . 26
Figure 5.5: Histogram over CE for 133 Xe and 135 Xe . . . . . . . . . . . . . . . . . . 28Introduction 1
1 Introduction
The first atomic bomb exploded on the 16th of July 1945 in the desert in New Mexico,
USA. The test was part of the well-known Manhattan Project, which eventually led to
the bombing of Hiroshima and Nagasaki in August 1945. In 1996 an international treaty,
the Comprehensive Nuclear-Test-Ban Treaty (CTBT), was signed at the UN General
Assembly in New York. The CTBT prohibits all nuclear test explosions on earth. How-
ever, there are still a few countries that haven’t ratified it, preventing the treaty from yet
entering into force. Between 1945 and 1996, over 2000 nuclear tests were carried out,
while only ten nuclear tests have been conducted after the CTBT opened for signatures
[1].
Nuclear weapon tests have historically been divided into four categories depending
on the location of the test: 1. atmospheric, 2. underground, 3. exoatmospheric and 4.
underwater, see figure 1.1 below [2].
Figure 1.1: Four major types of nuclear testing: 1. atmospheric,
2. underground, 3. exoatmospheric, and 4. underwater
Before 1950 there were some considerations about the health risks when exposed to the
radiation from nuclear testing and public protests played a part in the development
of the Partial Test Ban Treaty (PTBT) in 1962. The PTBT stated that nuclear testing
in the atmosphere, outer space and under water were banned; however nuclear testsIntroduction 2
were still allowed underground. The PTBT was not signed by France and China which
continued to do atmospheric tests until 1974 and 1980, respectively [3]. In the two figures
below are presented the worldwide numbers for nuclear testing, figure 1.2 illustrates
which countries: USA, USSR/Russia, UK, France, China, India, Pakistan and DPRK
(North Korea), and in which year they conducted the tests, from 1945 to 2018. Figure 1.3
illustrates instead whether the test was done in the atmosphere or underground between
1945 and 2017.
Figure 1.2: Worldwide nuclear testing between 1945 - 2018 [4].
Figure 1.3: Worldwide nuclear testing atmospheric vs. underground [5].
The PTBT worked partially, reducing the number of atmospheric nuclear explosions,
as shown in figure 1.3, resulting in a drop of the concentration of radioactive particlesIntroduction 3 in the atmosphere. However it did not result in a complete stop of nuclear prolifera- tion, i.e. the spread of nuclear weapons, fissionable material and weapons-applicable nuclear technology [6]. In 1985, during a Non-proliferation Treaty (NPT) conference, a Comprehensive Nuclear-Test-Ban Treaty was called for and in 1988 it was proposed to enhance the scope of the PTBT to include all environment explosion sites, which would eventually transform the PTBT into the CTBT [7]. The Comprehensive Nuclear-Test-Ban Treaty Organization (CTBTO) is the international organization whose purpose is to make sure that the Comprehensive Nuclear-Test-Ban Treaty is upheld. The organisation’s main tasks are to promote the CTBT and to build up the verification system to detect nuclear explosions. The organization’s verification regime consists of six elements; International Monitoring system (IMS), The International Data Centre (IDC), Global Communications Infrastructure (GCI), Consultation and clari- fication, On-site Inspection (OSI) and Confidence-building measures. The International Monitoring System (IMS) consists of 321 stations and 16 laboratories which are built all over the world, and it is these facilities that are checking for signs of a nuclear explosion [8]. The IMS uses four different methods to detect the explosions: seismic, hydroacoustic, infrasound and radionuclide technologies. In the event of a nuclear explosion, different radionuclides are released into the air, which can then be detected and act as proof of a nuclear explosion. The air current will move the radionuclides from the explosion site to the detector and then an atmospheric transport model (ATM) can be made to backtrack the probable detonation location [9]. In order to hide a test, the released nuclides need to be contained. One way to do this is to perform the test underground, in which case only a fraction of the created nuclides will reach the atmosphere. When a nuclear test is performed underground it is however difficult to contain the noble gases due to their low reactivity with other elements so they will reach the atmosphere. In fission events four isotopes of xenon, 131m Xe, 133m Xe, 133 Xe and 135 Xe are produced and because they have sufficient half-lives and nuclear yield, it is possible to detect them even far from the explosion site [10]. These four isotopes are therefore important to obtain as evidence of a nuclear test. While the three other methods, seismic, hydroacoustic, and infrasound can only suspect that an explosion has occurred, it is only radionuclide technologies that can definitely determine that it was a nuclear detonation, therefore radionuclide monitoring is the most important technique to check that the Comprehensive Nuclear-Test-Ban Treaty is upheld [11]. However, nuclear power reactor operations, nuclear fuel reprocessing and medical isotope production or usage are also releasing xenon. To be able to differentiate between these atmospheric radioxenon atoms and the ones that are produced in a nuclear test, the radioxenon system needs to automatically collect and measure the amount of the four xenon isotopes a few times per day to collect the background and automatically transmit the data to the International Data Center (IDC) [11]. The ratios between 135 Xe/133 Xe and
Introduction                                                                           4

133m Xe/133 Xe   are also different when the xenon comes from a nuclear reactor or from a
nuclear detonation [12]. When a change of the concentration of these isotopes of xenon
is detected, it is indisputable evidence that a nuclear test has occurred. Not detecting
them does however not necessarily mean that a nuclear test has not been conducted:
the xenon emissions could be too weak to be detected or be indistinguishable from the
global radioactive xenon background [10]. This means that it is important to continue
to improve the signal-to-noise ratio of the detector in order to enhance the detection of
prohibited nuclear tests.
Theory                                                                                   5

2 Theory

As mentioned previously, detection of the four xenon isotopes; 131m Xe, 133m Xe, 133 Xe and
135 Xe   play a major part in upholding the Comprehensive Nuclear-Test-Ban Treaty. For
this purpose, different systems have been developed: the Swedish Automatic Unit for
Noble gas Acquisition (SAUNA), the Automated Radioxenon Sampler and Analyser
(ARSA), the Analyser of Xenon RadioIsotopes (ARIX) and the Système de Prélève-
ment Automatique en Ligne avec l’Analyse du Xénon atmosphérique (SPALAX). These
systems use either high resolution HPGe gamma spectroscopy and/or β-γ incidence
technique [10].

This thesis work focuses on the detector developed by the Swedish Defence Research
Agency, SAUNA. In this section the geometry of SAUNA as well as the coincidence
technique used in SAUNA are described as well as the efficiency of said detector. Lastly,
the simulation tool that was used to obtain the simulation results is also described.

2.1 SAUNA
The Swedish Automatic Unit for Noble gas Acquisition, SAUNA, was developed by the
Swedish Defence Research Agency, FOI, and is one of the detector systems that are being
used all over the world, both as a part of the CTBT and in different national monitoring
systems, to analyse the amount of xenon in the air [13]. SAUNA consists of three major
parts, the sampling, the processing, and the detector units. The sampling unit collects
atmospheric xenon during a 12h period. The gas is then processed and quantified in
the processing unit and lastly, the particles emitted from radioxenon, for example beta
and gamma-rays, are being measured in the detector unit. The beta-gamma coincidence
system is made up of four cylindrical plastic scintillator cells which are surrounded by
two NaI(Tl) crystals in a close to 4π configuration [12].

A schematic drawing of the detector system is shown in the figure 2.1 below. The detector
unit consisting of two identical beta-gamma detectors is placed inside a lead-copper
radiation shield. The lead is 5 cm thick and is made out of low-activity lead and a 5
mm thick copper layer is placed inside the lead shielding. The NaI(Tl) detectors are
cylindrical with a diameter of 4 in. (10.16 cm) and a height of 5 in. (12.7 cm) and are
attached to a single light guide and a photomultiplier tube (PMT). The beta detector is
placed in a hole through the middle of the NaI(Tl) cylinder. A 0.2 mm aluminium layer
is covering the inside of the cylindrical hole. The beta cell is made from BC404 plastic
Theory 6
scintillator material [12]. The BC404 material consists of 8.4% of hydrogen and 91.6%
carbon with a density of 1.032 g/cm3 [14]. The beta cells have a radius of 1 cm, a length
of 7 cm and a thickness of 1 mm [15].
Figure 2.1: A schematic drawing of SAUNA [16] ©2003 Elsevier.
2.2 Coincidence technique
The radionuclide technology is the only detection technique that is able to confirm a
nuclear explosion, and by reducing the noise from background radiation the efficiency
of the detector will increase [11]. The coincidence technique makes it possible to get a
reduction of the detected background radiation [12] and therefore plays an important
part in the detection of nuclear explosions.
In some cases of nuclear decay more than one particle is created, or particles are created
in quick succession of each other. For example, if a nucleus undergoes beta decay to
a daughter nucleus which then will emit a gamma ray, these two events will happen
essentially at the same time. It is said that these two events are in a coincidence with
each other. The two events can be detected by two different detectors, and due to the
fact that the events occur together it is possible to reject all the other events that are not
in coincidence. In other words, two histograms over the energy can be created, one for
each detector, or the combination of coincidence events from the two detectors can be
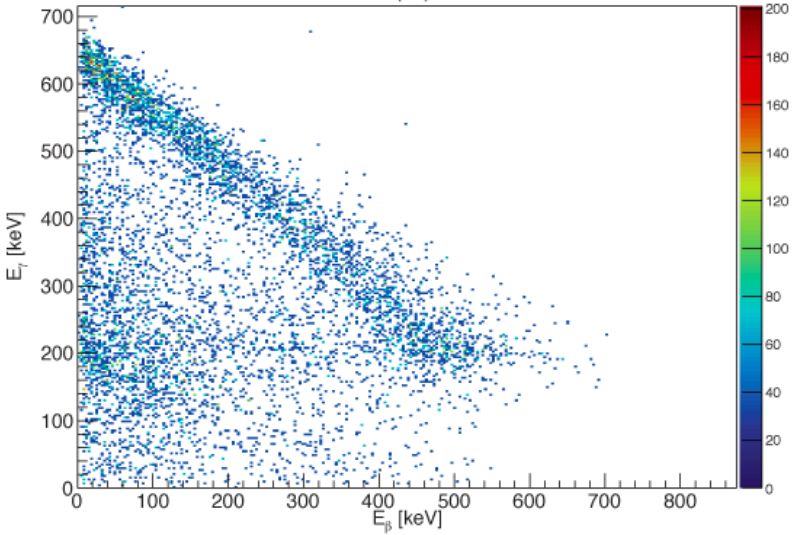
tallied in a two dimensional energy spectrum [17]. The figure 2.2 below illustrates that:Theory 7
the histograms, b) and c) are over the beta decay and the gamma ray energies while
histogram a) show the combined two dimensional energy spectrum.
Figure 2.2: a) beta-gamma coincidence spectra, b) beta energy spectra and c) gamma
energy spectra [16] ©2003, Elsevier.
The four aforementioned isotopes of xenon have their own unique β-γ spectrum and
their half-life, decay energy, decay intensity and type of radiation are shown in the table
2.1 below [12].Theory 8
Table 2.1: Relevant decay energies and types for the four isotopes of xenon
Isotope Half-life Decay energy (keV) Decay intensity (%) Radiation
131m Xe 11.84 (7) d 30.4 54.0 X-ray (average energy)
163.930 (8) 1.91 (6) Gamma ray
129 60.7 Conversion electron
133 Xe 5.243 (1) d 31.6 48.9 X-ray (average energy)
79.6139 (26) 0.27 (3) Gamma ray
80.9971 (14) 38.0 (7) Gamma ray
45 54.1 Conversion electron
346.4 99 (3) Beta (endpoint energy)
133m Xe 2.19 (1) d 30.4 56.3 X-ray (average energy)
233.221 (18) 10 Gamma ray
199 63.1 Conversion electron
135 Xe 9.14 (2) h 31.6 5.2 X-ray (average energy)
249.770 (4) 90 Gamma ray
608.151 (12) 2.90 (9) Gamma ray
214 5.7 Conversion electron
910 96 (4) Beta (endpoint energy)
We see that all isotopes have X-rays in the 30 keV region with the associated conversion
electron energies at 129, 45, 199 and 214 keV for 131m Xe, 133 Xe, 133m Xe and 135 Xe, respec-
tively. 133 Xe has another strong coincidence decay mode, 81 keV gamma ray together
with 346 keV endpoint energy beta decay. 135 Xe also has multiple coincidence decay
modes, 249.8 keV gamma ray with 910 keV endpoint energy beta decay [12]. Each iso-
tope has their unique beta-gamma energy spectra, but there are some overlaps between
them [18]. For example all of the isotopes have the 30 keV X-ray and the overlap are
especially strong between 133 Xe, 131m Xe and 133m Xe, because the intensity for the X-ray is
quite high for these three compared to the X-ray intensity of 135 Xe which is only at 5%.
The double coincidence technique for detecting nuclear testing is well established.
However, using triple coincidence, i.e. detecting three particles at the same time instead
of two, will make it possible to detect the concentration of xenon in the air even with a
high amount of background radiation. Both 133 Xe and 135 Xe have a triple coincidence,
β- CE and X-ray which can be used to obtain the concentration of the two isotopes [19].
In the figure 2.3 below is shown a decay scheme for 133 Xe. The following event is the
triple coincidence: 133 Xe undergoes beta decay to 133 Cs, which leads to the 5/2+ state, inTheory 9
which there are a 48.76% chance of a conversion electron with the energy of 45 keV and
an X-ray with energy 31.6 keV to be emitted.
Figure 2.3: Decay scheme for 133 Xe [18] ©2013, IEEE.
In figure 2.4 we instead have the decay scheme for 135 Xe. The beta particle in 96% of the
cases has an endpoint energy of 910 keV which is at 135 Cs’s 5/2+ state. Then in 4.95%
of the events a conversion electron with an energy of 214 keV and a 31.6 keV X-ray are
emitted.
Figure 2.4: Decay scheme for 135 Xe [18].
These three energies are emitted essentially at the same time and can be used to create a
triple coincidence spectrum and then calculate the concentration of the isotopes. ThisTheory 10
thesis work is done under the assumption that it is possible to distinguish between the
beta electron and the conversion electron.
For 133 Xe we have one dual coincidence in 38.0% of the cases between the beta particle
and 80.997 keV gamma-ray, the beta particle and the 31.606 X-ray can also be used in
a dual coincidence. Similarly, a dual coincidence exists for 135 Xe: there is also a 90%
possibility from 5/2+ state to instead only emit a 249.77 keV gamma.
To be able to detect a double coincidence, two detectors are necessary. In order to detect
a triple coincidence, either three detectors can be used, or two detectors measuring the
time between the energy deposit and then studying the shape of the electric signal from
the detector.
2.3 Efficiency of the SAUNA detector
To calculate the efficiency of a xenon detector, various regions of interest (ROI) are
defined where energy peaks are expected to be and it is therefore important to know the
efficiency of the detector in these regions. The total efficiencies of the detectors, eβγ , and
the efficiency of the gamma- and beta-detector have the following relation:
eβγ = eβ · eγ (2.1)
where eγ and eβ are the efficiency of the gamma and the beta detector, respectively.
The efficiency of the SAUNA detector has been studied at different ROIs. In the table 2.2
below the efficiencies of the gamma detector at different energies are shown as well as
the total efficiencies of the detectors with different beta thresholds [20].
Table 2.2: Calculated efficiencies of SAUNA detector in various ROIs
133 Xe 135 Xe
Gamma energy 30 keV 80 keV 250 keV
Gamma efficiency, eγ 80% 87% 74%
Beta threshold = 0 keV
Calculated efficiency, eβγ 71% 75% 68%
Beta threshold = 10 keV
Calculated efficiency, eβγ 70% 74% 68%
Beta threshold = 20 keV
Calculated efficiency, eβγ 67% 71% 67%
Using equation 2.1 above the beta detector efficiencies can be calculated. The result of
the beta detector efficiencies at the 0 keV threshold, together with the values used in the
equation 2.1 are illustrated in the table 2.3 below [20].Theory 11
Table 2.3: The total-, γ- and β-efficiencies of the SAUNA-detector in various ROIs
133 Xe 135 Xe
Gamma energy 30 keV 80 keV 250 keV
Gamma efficiency, eγ 80% 87% 74%
Beta threshold = 0 keV
Calculated efficiency, eβγ 71% 75% 68%
Beta efficiency, eβ 89% 86% 92%
2.4 GEANT4
GEANT4 is a toolkit for simulating particles when they go through matter. It is an
object-oriented software library implemented in the C++ programming language and
was created in a worldwide collaboration of physicists and software engineers [21]. In
this thesis work the SAUNA detector geometry was built in GEANT4 to simulate the
response of the detector when it is exposed to the same particles that are released in a
nuclear explosion, from the decay of the various xenon isotopes.Methodology 12 3 Methodology This section starts with a discussion over the key parts in the building of the detector and how the coincidences were implemented in GEANT4, followed by how the energy distribution of the beta particles for 133 Xe and 135 Xe were obtained, and lastly by a section discussing how to be certain that the detector model is working as intended. The code for the construction of SAUNA detector as well as the result from the simula- tions are available at: github.com/MarielleAkser/Master_thesis. 3.1 Building the detector The geometry and the material of SAUNA, as described in the theory, were built in the GEANT4 simulation toolkit. However before this could be done the simulation toolkit and the necessary visualising applications needed to be acquired, which was done by using Docker images [22]. In GEANT4 detector construction, volumes can be classified as “sensitive” and then assigned to record a specific physical quantity to simulate a real detector response. In this case, it means that the volumes representing the gamma and beta detectors will record the energy deposit that occurs in that volume for an event. The energy deposit in the detectors then gets saved into csv-files to get analysed outside the GEANT4 environment. The analysis and the creation of plots were all done in Python. 3.2 Implementation of the coincidence in GEANT4 Coincidence is when two or more particles are detected at the same time. In GEANT4 a run is defined as a sequence of events. To simulate that more than one particle could be detected at the same time they are generated in the same event using multiple vertices. The energy deposits that get registered in the detectors during an event are saved onto a csv-file. Which detector registers the energy deposit, what type of parent particle it was, the energy deposit as well as the type of corresponding parent particle were all saved in different columns in the csv-file. Each row of the csv-file corresponds to one event. The particles are generated randomly inside the beta cell and have an isotropic angular distribution. The angle distribution may not be completely reflecting the true angle
Methodology                                                                                  13

distribution but since the particles will have their starting position somewhere inside
the beta cell it was important that the initial direction of the particles was also random.

3.3 Obtaining the energy distribution of the beta particle
When a particle undergoes beta decay an electron and an antineutrino (or positron and
neutrino) are being ejected from the nucleus [23]. The three particles in the reaction, the
daughter nucleus, the beta electron, and the antineutrino all share the released energy.
However, due to the daughter nucleus being extremely heavy compared to the other
two particles, the energy it receives is negligible. This leaves only the electron and the
antineutrino to share the energy [24].    133 Xe   and 135 Xe undergo beta decay into 133 Cs and
135 Cs,   respectively. To be able to simulate the correct energy distributions for the 133 Xe
and 135 Xe beta electron, a package created by Gabe Zangakis [25] was used to model
the beta energy spectrum for the two isotopes of xenon. Figure 3.1 and 3.2 display the
resulting distributions. Both distributions have been normalized.

Figure 3.1: Beta energy distribution                Figure 3.2: Beta energy distribution
            for 133 Xe.                                         for 135 Xe.

The code uses Evaluated Nuclear Structure Data File (ENSDF), Fermi Function ap-
proximation and forbiddenness correction to model the spectra. While the distributions
haven’t been validated any more than by comparing the shape of the curves to previously
published graphs, I concluded that they were accurate enough for these simulations.

In GEANT4 it is possible to make a custom histogram of the energy distribution for
the generated particle by defining the energy and its corresponding probability. The
values from the distributions shown above were used in GEANT4 when generating beta
particles.
Methodology 14
3.4 Checking the detector model
A physical detector always needs to be calibrated so that the detector channel corre-
sponds to the correct energy and as an initial calibration 137 Cs is used as a calibration
source in SAUNA [18]. In 94.6% of the cases, 137 Cs undergoes beta-decay into 137m Ba
which then will emit γ with 662 keV. 85.1% of 137 Cs decays will lead to the emission
of gamma-rays with that specific energy and is one of the reasons why 137 Cs is good
for calibration [26]. The gamma energy can also be used when calibrating the beta
detector using Compton scattering. The 662 keV gamma-ray will Compton scatter in the
NaI-detector and produce an electron-gamma pair with the total energy of 662 keV. The
electron can then be detected in the beta cell, and the gamma in the NaI-detector and
will result in a diagonal distribution going from the top left to bottom right. Top left is
when the gamma particle deposits all the energy in the NaI-crystal and bottom right is
the other way around, the electron deposits all the energy in the beta cell. Fitting a line
to that distribution and extending it to the Eβ axis will give the endpoint energy [18].
Figure 3.3: Calibration spectra for 137 Cs [18].Results 15
4 Results
4.1 The detector model
The detector system SAUNA was built in GEANT4 as described in the theory and is
shown in the figure 4.1 below. In purple is the beta cell, on each side of the beta cell in
yellow is the PM tubes. In blue-green we have the NaI-detector and all around in light
grey is the lead shielding. The aluminium layer around the beta cell is also simulated,
however it is not visible in this figure.
Figure 4.1: Detector model over SAUNA build in GEANT4.
When building and extracting information from a detector in GEANT4 there is no need
for energy calibration as the software does it automatically. However, in order to make
sure the detector model works as intended, the typical 137 Cs Compton scatter calibration
spectra were recreated using a point source which released its energy in an isotropic
angle distribution. The point source that should represent the energy of 137 Cs wasResults 16
gaussian distributed with a mean of 661.657 keV with a standard deviation of 0.003 keV
[27]. This resulted into the following plot, figure 4.2:
Figure 4.2: β-γ coincidence spectra for 137 Cs.
4.2 Xenon 133
The plot below, figure 4.3 is showing a graph over the number of events and the percent-
age of events where all the three (γ, CE, and a beta) particles are being detected with theResults 17
corresponding error-bar (for every 1000th event). In 69.2% ± 0.1 of the cases all three
particles are being detected.
Figure 4.3: Events needed before the amount of the
detection of three particles converges.
Although only the relevant particles were generated, if only the particles with an energy
of 31.6 ± 5 keV were counted as gamma particles, and the electrons with an energy of 45
± 5 keV were counted as a conversion electron. With one million generated particles the
percentage of triple coincidence is 22.9% ± 0.2.
That the interval limit is set to ± 5 keV is an arbitrarily selected limit from the region of
interest in the 2D-histogram figure 4.4 in the following section. From the decay schemes,
figures 2.3 and 2.4, for the 133 Xe and 135 Xe also show that there are no other particles in
that energy span.
4.2.1 Efficiency
The table 4.1 below shows the result of a 133 Xe simulation. One million events were
generated. In each event, two monoenergetic particles, one gamma and one electron
with energies of 31.6 keV and 45 keV respectively, together with an electron with energy
distributed according to the precreated energy spectrum, were generated. For the gamma
particle to be counted in a triple coincidence the energy deposit in the detector need to
be 31.6 ± 5 keV and for the conversion electron the energy needs to be in the interval 45
± 5 keV.Results 18
Table 4.1: Triple coincidence result for 133 Xe
Particle Total number of % of particles detected
particles generated in triple coincidence
Gamma 1 000 000 86.5%
(31.6 ± 5 keV)
Conversion electron 1 000 000 31.4%
(45 ± 5 keV)
Beta electron 1 000 000 84.2%
(endpoint energy 346 keV)
In the figure 4.4 below, a 2D-histogram over the energy deposit of the conversion electron
and the beta particle when the deposit from the photon were exactly 31.6 keV. The top
graph is the histogram over the conversion electrons energy deposit and the histogram
to the right is over the beta particles energy.
Figure 4.4: 2D-histogram over the energy deposit of the conversion electron and the
beta particle for 133 Xe.
If, instead of generating three particles, only the gamma and the beta particle were
generated and the same ± 5 keV interval for detecting a gamma particle was used, 72.8%
± 0.1 of the particles generated were in a double coincidence. This simulation was also
done with 1 million events.Results 19
The other strong coincidence for 133 Xe is the β-particle together with a 80.997 keV γ-ray.
One million events were generated and in each event one gamma particle with energy
80.997 keV and a beta particle were created. The photons were only counted as a gamma
particle if the energy deposit was in the interval 80.997 ± 5 keV. The dual coincidence
rate in this case was 77.9% ± 0.1. The amount of the individual particles that were
detected is shown in the table 4.2 below.
Table 4.2: β- and 80 keV γ-particle coincidence result for 133 Xe
Particle Total number of % of particles detected
particles generated in double coincidence
Gamma 1 000 000 92.5%
(80.997 ± 5 keV)
Beta electron 1 000 000 84.2%
(endpoint energy 346 keV)
4.2.2 Beta particles energy distribution
The energy of the beta particles follows a continuous distribution, as explained in
the previous section. Here, one million events were generated where an X-ray and a
45 keV CE were created at each event. The figure 4.5 below illustrates, in black, the
energy distribution of the beta particles taken from the original 133 Xe distribution. The
blue histogram is the energy of all the detected beta particles, the red histogram is the
beta particles when the other two particles were also detected. The histogram in yellowResults 20
represents the beta particles that are in triple coincidence with a gamma and a conversion
electron in the previously mentioned energy interval.
Figure 4.5: Histogram over the energy deposit for the beta particle for 133 Xe.
4.3 Xenon 135
For 135 Xe with one million events generated a β-, CE- and a γ-particle were detected in
83.0% ± 0.1 of the cases. If the detected X-ray were only considered detected when they
have the energy 31.6 ± 5 keV, and 214 ± 5 keV for the conversion electron, together with
a beta particle, the triple coincidence rate dropped to 63.5% ± 0.1.
4.3.1 Efficiency
The table 4.3 below shows how many particles released their energy (in coincidence or
not) in the detectors.Results 21
Table 4.3: Triple coincidence result for 135 Xe
Particle Total number of % of particles detected
particles generated in triple coincidence
Gamma 1 000 000 85.7%
(31.6 ± 5 keV)
Conversion electron 1 000 000 77.3%
(214 ± 5 keV)
Beta electron 1 000 000 95.7%
(endpoint energy 910 keV)
The following plot 4.6 is a 2D-histogram over the energy deposit for the conversion
electron and the beta particle for 135 Xe when the photons energy deposit were exactly
31.6 keV. The top plot is the histogram over the energy deposit for the conversion electron
and the right plot is a histogram over the energy deposit for the beta particle.
Figure 4.6: 2D-histogram over the energy deposit of the conversion electron and the
beta particle for 135 Xe.
If instead of generating three particles in each event, only the beta and the gamma particle
were created, out of the one million events there were 82.2% ± 0.1 of the particles that
were in coincidence with each other, when the gamma particle had an energy of 31.6 ± 5
keV.Results 22
From figure 2.4 and table 2.1 we know that in 90% of the cases, after 135 Xe undergoes
beta decay it will be followed by a gamma ray with the energy of 249.770 keV. Simulating
that, one million events with one gamma particle with the energy of 249.770 keV and
a beta particle with an energy following the precalculated energy were generated. If
the gamma particle needs to release an energy of 249.770 ± 5 keV, the coincidence rate
with a beta particle is 80.5% ± 0.2. The amount of beta and gamma particles detected is
shown in the table 4.4 below.
Table 4.4: Dual coincidence result for 135 Xe
Particle Total number of % of particles detected
particles generated in double coincidence
Gamma 1 000 000 84.1%
(249.770 ± 5 keV)
Beta electron 1 000 000 95.7%
(endpoint energy 910 keV)
4.3.2 Beta particles energy distribution
The energy distribution of the beta particles for 135 Xe when one million events were
generated is shown in the figure 4.7 below. The black line is the distribution of the
beta energy previously calculated, the blue histogram represents the energy of all the
detected beta particles. The red histogram represents the beta particles energy deposit
when a gamma particle and a conversion electron also were detected and the yellow areResults 23
the histogram over the beta particles in triple coincidence (CE has an energy of 214 ± 5
keV and gamma 31.6 ± 5 keV).
Figure 4.7: Histogram over the energy deposit for the beta particle for 135 Xe.Discussion 24
5 Discussion
5.1 The model
While constructing the model some parts of the real SAUNA were left out, for example
the Xe-inlet which carries the gas from the sampling and processing parts of SAUNA to
the detector. Instead the generated particles were randomly distributed in the hollow
beta cell, the inlet is so small that the difference in detector size and how the tube
could interact with the particles is negligible. The PM tubes on each side of the beta
detector however are relatively big, so even though their function is not being used,
their placement significantly reduced the size of the NaI-detector so they were added. In
SAUNA the PM-tubes have an aluminium cover and because the PM-tubes in the model
do not have any function, the material they consist of is only aluminium. There is also
another PM-tube in SAUNA, on the top of the NaI-detector (y-direction in the figure
5.1 below); that one was just removed and lead was put there instead, mostly due to
simplicity. It is speculated that these minor changes to the detector do not significantly
alter the results. The fact that this is a simulation and that the model can acquire the
energy deposit very precisely plays a much bigger part than minor changes in the
geometry of the detector. However the removal of the PM-tubes functionality probably
has some impact on the result.
Figure 5.1: Detector model over SAUNA build in GEANT4.Discussion 25
It is evident that the model is very precise when looking at the beta-gamma coincidence
spectra for 137 Cs. The figure 5.2 below illustrates how precisely the simulation, on the
left plot, is able to detect the energy deposit compared to a real detector on the right.
Figure 5.2: Calibration spectra comparison between the simulations and a physical
detector [18].
5.2 Beta spectrum
When looking at the energy distribution for the beta particles, both for 133 Xe and 135 Xe,
it is evident that the detector is missing some of the particles in the low energy part of
the spectrum. See figure 5.3. This is expected due to the fact that some electrons will
interact with the air inside the beta cell and could either have lost some of their energy
or not even reach the detector.
Figure 5.3: Histogram over the energy deposit for the beta particle for 135 Xe and 135 Xe
The spectrum for 135 Xe, the right plot in figure 5.3, also has a distinctive bump after
0.2 MeV. The reason for that may be that electrons with higher energies only partially
deposit their energy in the beta cell which results in that shape. The figure 5.4 below
illustrates a simulation with only one million 135 Xe beta particles generated, with theDiscussion 26
black line is still the precalculated emission energy distribution, the green histogram is
the energy deposit in the beta cell and the purple line is the histogram with step curve
with no fill over the energy deposit in any detector.
Figure 5.4: Histogram over 135 Xe beta particle in both detectors
In the figure 5.4 above we see that the bump is smaller in the total energy deposit
histogram compared to the energy deposit in the beta cell. We also see that we have an
increase in the number of high energy particles that are being detected, while retaining
the same total amount of detected particles. The histogram is consistent with the theory
that the beta particles sometimes escape the beta cell, which may partly explain the
bump.
5.3 Efficiency
In the table 5.1 below the values of the efficiency of the SAUNA detector [20], see section
2.3, are shown together with the ones obtained from the simulations for 133 Xe. In table
5.2 are instead presented the values for 135 Xe. The last column of the table indicates
whether there is an increase or a reduction in the amount of detected particles in the
simulations compared to the SAUNA values.Discussion 27
Table 5.1: Comparison between the efficiency of SAUNA and the simulations for 133 Xe
SAUNA Simulations Increase or reduction
Gamma energy 30 keV 80 keV 30 keV 80 keV 30 keV 80 keV
Gamma efficiency, eγ 80% 87% 87% 93% +9% +7%
Beta threshold = 0 keV
Total efficiency, eβγ 71% 75% 73% 78% +3% +4%
Beta efficiency, eβ 89% 86% 84% 84% -6% -2%
Table 5.2: Comparison between the efficiency of SAUNA and the simulations for 135 Xe
SAUNA Simulations Increase or reduction
Gamma energy 250 keV 250 keV 250 keV
Gamma efficiency, eγ 74% 84% +14%
Beta threshold = 0 keV
Total efficiency, eβγ 68% 81% +19%
Beta efficiency, eβ 92% 96% +4%
From the tables above we see that there is no big difference between the detector model
and SAUNA, which means that SAUNA should respond and obtain similar results as
the simulation.
5.4 Triple coincidence
For 133 Xe there was 23% chance for a particle being detected in triple coincidence,
whereas for 135 Xe there was a 64% chance. The fact that there is a higher chance for
135 Xe is reasonable, due to the fact that the conversion electron has a higher energy for
135 Xe compared to 133 Xe, 214 keV compared to 45 keV, as well as for the beta particle.
Having a higher energy means that they are harder to stop, so for 135 Xe almost all of
the conversion electrons reach the detector and then deposit their energy. However for
133 Xe’s conversion electron, they have a lower energy and therefore there is is a higher
risk that they will lose their energy before reaching the detector. The reasoning is similar
for the beta particle, for 135 Xe the energy can be three times higher than for 133 Xe’s beta
particle, meaning that the risk of losing an electron before it reaches the detector is
smaller for 135 Xe, resulting in a higher number of detected particles which then leads to
a higher amount of coincidences.
The 2-dimensional histograms, figures 4.4 and 4.6, over the energy deposit of the con-
version electron and the beta particle when the gamma particle released 31.6 keV in the
NaI-detector show the reason why there are such a big difference in the triple coincidence
rate. Studying just the energy deposit of the conversion electron we see that for 133 Xe theDiscussion 28
energy deposits are almost non-existent at 0.01 MeV but for 135 Xe the counts are almost
zero at 0.208 MeV. 0.01 MeV is quite far from the interval (which were 45 ± 5 keV) but
0.207 MeV is close to the interval (214 ± 5 keV). Comparing the conversion electrons
histogram for 133 Xe, the top plot in the figure 5.5 below, and 135 Xe, the bottom plot, we
see that the spread of the energy deposit is much higher for 133 Xe then for 135 Xe.
Figure 5.5: Histogram over CE for 133 Xe (top) and 135 Xe (bottom)
The risk that a false coincidence will occur should be smaller with a triple coincidence
than with a dual coincidence. Even though there is only a 23% change to detect the three
particles in coincidence for 133 Xe the event occurs 49% of the time in the decay-chain
which make it still an interesting coincidence to analyze. For 135 Xe there only is a 5%
chance that a conversion electron and an X-ray will be emitted, but because of the high
percentage, 64%, to detect a triple coincidence, it may be an interesting coincidence to
study as well.Conclusion 29 6 Conclusion As mentioned in the earlier sections the dual coincidence technique is a well established method to measure the amount of xenon in the air and therefore discover that a nuclear explosion has occurred. This work shows that in 73% of the cases the detector is able to detect a dual coincidence for 133 Xe (30 keV X-ray together with beta emission). For 135 Xe is was 82% (30 keV X-ray and beta particle) and 81% (250 keV gamma and a beta particle). When simulating triple coincidence the detector was able to detect a triple coincidence in 23% of the cases for 133 Xe and 64% for 135 Xe. The next step to improve the detectors should be to introduce the triple coincidence because detecting the triple as well as dual coincidence would mean that the minimum detectable concentration of xenon will be smaller. Even though this result is in a simulation with a perfect detector, there is no obvious reason why this result should not apply to the real detector. The reason why there are not the same percentages to detect a triple coincidence for 133 Xe and 135 Xe has nothing to do with the probability for these particles to be emitted. One million particles were generated in both cases. The amount of detected photons was the same for both 133 Xe and 135 Xe, but the difference was the amount of detected electrons. This is because the electrons have a lower energy for 133 Xe compared to 133 Xe which probably resulted in some particles never actually reaching the beta cell.
Outlook                                                                                30

7 Outlook

The next step would be to run these simulations together with background radiation
to get a more realistic view over the energy deposition in the detectors, as well as how
many false coincidences can occur together with the background. This work was also
carried under the assumption that it is possible to distinguish between the beta- and
conversion electron. This is however something that needs to be studied further to make
sure it is possible. The particles had an isotropic angular distribution but in the future
work the angular dependencies between the conversion electron and photon could also
be studied.

Another outlook from this thesis could be to improve the code. For the simulations in
this thesis, the code works fine. However due to how the sum of the energy deposit
is computed the code only works when maximum one gamma and two electrons are
generated. Protons and neutrons probably work too, but haven’t been tested. In order
to generate two photons in the same event or to generate more than four particles, the
code would need to be modified.
Acknowledgements                                                                       31

Acknowledgements

I would firstly like to express my thanks to my supervisor, Peter Jansson, for his contin-
uous help and feedback.
I’d also like to thank my examiner, Cecilia Gustavsson for her valuable comments and
feedback on the text on this thesis.
This work would not have been possible without Tomas Fritioff at FOI, who graciously
provided the necessary data for building the detectors as accurately as possible.

Lastly I would like to thank my partner Hadrien who read this text more times than I
could count, thank you for all your input.
References                                                                                   32

References

 [1] World overview: CTBTO Preparatory Commission. https://www.ctbto.org/nuclear-
       testing/history-of-nuclear-testing/world-overview/, accessed Jun. 9, 2021.

 [2] Nuclear weapons testing, en, Page Version ID: 1024440862, May 2021.
       https://en.wikipedia.org/w/index.php?title=Nuclear_weapons_testing&
       oldid=1024440862, accessed Jun. 9, 2021.

 [3] General overview of the effects of nuclear testing: CTBTO Preparatory Commission.
       https://www.ctbto.org/nuclear-testing/the-effects-of-nuclear-testing/general-
       overview-of-theeffects-of-nuclear-testing/, accessed Jun. 9, 2021.

 [4] By worldwide nuclear testing.svg: Hairy dudethis file furfurdata source: Oklahoma
       geological survey nuclear explosion catalog - this file was derived from: worldwide
       nuclear testing.svg, cc by-sa 2.5.
       https://commons.wikimedia.org/w/index.php?curid=65809060, accessed Jun. 9,
       2021.

 [5] Nuclear Testing: North Korea Breaking Ban - knoema.com, en-US.
       https://knoema.com//infographics/fogdpv/nuclear-testing-north-korea-
       breaking-ban, accessed Jun. 9, 2021.

 [6] Comprehensive Nuclear-Test-Ban Treaty, en, Page Version ID: 1027699666, Jun. 2021.
       https://en.wikipedia.org/w/index.php?title=Comprehensive_Nuclear-Test-
       Ban_Treaty&oldid=1027699666, accessed Jun. 10, 2021.

 [7] 1977-94: Renewed test-ban commitments: CTBTO Preparatory Commission.
       https://www.ctbto.org/the-treaty/history-1945-1993/1977-94-renewed-test-
       ban-commitments/, accessed Jun. 10, 2021.

 [8] Overview of the verification regime: CTBTO Preparatory Commission.
       https://www.ctbto.org/verification-regime/background/overview-of-the-
       verification-regime/, accessed Jun. 9, 2021.

 [9] Atmospheric transport modelling and data fusion: CTBTO Preparatory Commission.
       https://www.ctbto.org/?id=1294, accessed Jun. 9, 2021.

[10]   G. Le Petit, A. Cagniant, M. Morelle, P. Gross, P. Achim, G. Douysset, T. Taffary,
       and C. Moulin, “Innovative concept for a major breakthrough in atmospheric
       radioactive xenon detection for nuclear explosion monitoring,” en, Journal of
References 33
Radioanalytical and Nuclear Chemistry, vol. 298, no. 2, pp. 1159–1169, November
2013. https://doi.org/10.1007/s10967-013-2525-8, accessed January 29, 2021.
[11] R. Perkins and L. Casey, “Radioxenons: Their role in monitoring a
Comprehensive Test Ban Treaty,” en, Tech. Rep. DOE/RL–96-51,
PNNL-SA–27750, 266641, Jun. 1996, DOE/RL–96–51, PNNL–SA–27 750, 266 641.
http://www.osti.gov/servlets/purl/266641/, accessed December 14, 2020.
[12] A. Ringbom, T. Larson, A. Axelsson, K. Elmgren, and C. Johansson, “SAUNA—a
system for automatic sampling, processing, and analysis of radioactive xenon,”
en, Nuclear Instruments and Methods in Physics Research Section A: Accelerators,
Spectrometers, Detectors and Associated Equipment, vol. 508, no. 3, pp. 542–553,
August 2003. https://linkinghub.elsevier.com/retrieve/pii/S0168900203016577,
accessed December 14, 2020.
[13] Världsledande teknik för detektion av kärnvapenprov, sv, text.
https://www.foi.se/nyheter-och-press/nyheter/2017-02-16-varldsledande-
teknik-for-detektion-av-karnvapenprov.html?openExpanderWith=SAUNA,
accessed Jun. 9, 2021.
[14] E. Dietz-Laursonn, T. Hebbeker, and O. Pooth, “Detailed studies of light transport
in optical components of particle detectors,” Fachgruppe Physik, Tech. Rep., 2016.
[15] T. Fritioff, E-mail, , May 2021.
[16] A. Ringbom, T. Larson, A. Axelsson, K. Elmgren, and C. Johansson, “SAUNA—a
system for automatic sampling, processing, and analysis of radioactive xenon,”
en, Nuclear Instruments and Methods in Physics Research Section A: Accelerators,
Spectrometers, Detectors and Associated Equipment, vol. 508, no. 3, pp. 542–553,
August 2003. https://linkinghub.elsevier.com/retrieve/pii/S0168900203016577,
accessed December 14, 2020.
[17] Gamma-Ray Coincidence Counting Techniques.
https://www.mirion.com/learning-center/lab-experiments/gamma-ray-
coincidence-counting-techniques-lab-experiment, accessed Jun. 9, 2021.
[18] M. W. Cooper, J. H. Ely, J. C. Hayes, J. I. McIntyre, and J. Slack, “- Absolute
Calibration Rev. 1,” English, Pacific Northwest National Laboratory, Tech. Rep.
PNNL-27572 Rev. 1, January 2019, p. 44.
https://www.pnnl.gov/main/publications/external/technical_reports/PNNL-
27572Rev1.pdf, accessed January 25, 2021.
[19] J. McIntyre, C. Aalseth, T. Bowyer, J. Hayes, T. Heimbigner, S. Morris, and
P. Reeder, “Triple coincidence radioxenon detector,” Proceedings of the 26th Seismic
Research Review: Trends in Nuclear Explosion Monitoring, pp. 581–587, 2004. https:References 34
//www.ldeo.columbia.edu/res/pi/Monitoring/Doc/Srr_2004/PAPERS/06-
01.pdf, accessed February 19, 2021.
[20] C. Johansson, “High-sensitivity Radioactive Xenon Monitoring and
High-accuracy Neutron-proton Scattering Measurements,” eng, ISBN:
91-554-5979-X (ISBN) Number Of Volumes: 984 Publication Title: Comprehensive
Summaries of Uppsala Dissertations from the Faculty of Science and Technology
984, Doctoral thesis, comprehensive summary, Acta Universitatis Upsaliensis,
Uppsala, 2004. http://urn.kb.se/resolve?urn=urn:nbn:se:uu:diva-4279, accessed
May 11, 2004.
[21] S. Agostinelli, J. Allison, K. Amako, et al., “Geant4—a simulation toolkit,” en,
Nuclear Instruments and Methods in Physics Research Section A: Accelerators,
Spectrometers, Detectors and Associated Equipment, vol. 506, no. 3, pp. 250–303, Jul.
2003. https://www.sciencedirect.com/science/article/pii/S0168900203013688,
accessed February 5, 2021.
[22] P. Jansson, Peter-jansson/appnuc, original-date: 2020-07-27T19:43:02Z, Jun. 2021.
https://github.com/peter-jansson/appnuc, accessed Jun. 15, 2021.
[23] Beta decay, en, Page Version ID: 1025218164, May 2021.
https://en.wikipedia.org/w/index.php?title=Beta_decay&oldid=1025218164,
accessed Jun. 9, 2021.
[24] Radioactivity : Beta spectrum.
https://www.radioactivity.eu.com/site/pages/Beta_Spectrum.htm, accessed
Jun. 9, 2021.
[25] G. Zangakis, Gzangakis/beta-spectrum, original-date: 2017-09-12T01:13:34Z, Sep.
2017. https://github.com/gzangakis/beta-spectrum, accessed Jun. 15, 2021.
[26] Caesium-137, en, Page Version ID: 1027376204, Jun. 2021.
https://en.wikipedia.org/w/index.php?title=Caesium-137&oldid=1027376204,
accessed Jun. 9, 2021.
[27] Table of Isotopes decay data.
http://nucleardata.nuclear.lu.se/toi/nuclide.asp?iZA=550137, accessed Jun. 9,
2021.You can also read