Determinants of Under-Five Children Body Mass Index in Su- dan; Application of Quantile Regression: A Systematic Review
←
→
Page content transcription
If your browser does not render page correctly, please read the page content below
Iran J Public Health, Vol. 50, No.1, Jan 2021, pp.1-10 Review Article

 Determinants of Under-Five Children Body Mass Index in Su-
 dan; Application of Quantile Regression: A Systematic Review
 *Dawit Getnet AYELE 1, Ahmed Saied Rahama ABDALLAH 2, Mohammed Omar Musa
 MOHAMMED 2
 1. Institute of Human Virology, School of Medicine, University of Maryland Baltimore, Baltimore, USA
2. College of Business Administration in Hotat bani Tamim, Prince Sattam Bin Abdulaziz University, Alkharj, Saudi Arabia
 *Corresponding Author: Email: ejigmul@yahoo.com

 (Received 10 Jul 2020; accepted 23 Sep 2020)

 Abstract
 Background: One of the health challenges in Sub-Saharan countries is child malnutrition. Body Mass Index (BMI)
 can be defined as a measure of nutritional status. Examining the determinants of under-five children’s BMI is a
 significant subject that needs to be studied. For this study, quantile regression was used to identify the determinants
 of under-five children's BMI in Sudan.
 Methods: We used the 2014 Sudan Multiple Indicator Cluster Survey (MICS) conducted by the Central Bureau
 of Statistics. Quantile regression was used.
 Results: Place of residence, state, mother’s educational level, gender, age of the child, and wealth index were an
 important effect significantly affecting under-five children’s BMI at different quantile levels.
 Conclusion: Taking measures on the nutritional status of mothers will accordingly resolve the nutritional status
 of their children. Therefore, the focus of policymakers should be on the influential significant factors which were
 found across all quantile levels to plan and develop strategies to enhance the normal or healthy weight status of
 under-five children in Sudan.

 Keywords: Body mass index; Under-five; Multiple indicator cluster survey

Introduction
Body Mass Index (BMI) is a measure of weight ac- amount of body fat in individuals or children may
commodate for height, computed as weight in kil- point to weight associated illness and other health
ograms divided by the square of height in meters matters and being underweight may also put a per-
(kg/m2). Furthermore, BMI is adopted as a check- son at exposure for health problems (1, 2).
ing mechanism to determine whether an individual The burdens related to using BMI for adults also
is a healthy weight, underweight, overweight, or apply to children and adolescents. Other factors,
obese for their height. But, body fatness is not including height and level of sexual maturation,
measured directly by BMI. In case that individual’s have influenced the association between BMI and
BMI is away from the normal BMI area the possi- body fat amid children too. Furthermore, the ac-
bility of sickness or death can enhance unques- curacy of BMI varies substantially according to the
tionably. Children's BMI depends on age and gen- person's child’s degree of body fatness. Among
der, also is usually specified as BMI for age. A large obese children, BMI was a good signal of excess

1 Available at: http://ijph.tums.ac.ir
Ayele et al.: Determinants of Under-Five Children Body Mass Index in …

body fat. However, among overweight children, growth and development of the society under con-
elevated BMI levels could be a result of expanded sideration. Children’s BMI under the age of five at
levels of either fat or fat-free mass. Similarly, or above the 95th percentile, between the 85th and
among approximately slim children, differences in 95th percentile, and between the 5th and 85th per-
BMI are often due to differences in fat-free mass centile was classified as obese, overweight, and
(3-5). normal (healthy weight) respectively (10). The cut-
Sudan has been committed to the 2015 Millen- off point for underweight of less than the 5th per-
nium Development Goals (MDG) targeting to centile is based on recommendations by the WHO
eliminate, intense famine, and malnutrition (6). Expert Committee on Physical Status. The per-
The reduction of child malnutrition was one of the centiles are age-specific for children but not for
objectives of Sudan’s National Health Sector Stra- adults (3).
tegic Plan (NHSSP) 2012-2016, which is expected Many studies related to malnutrition have been
to curtail the prevalence of reducing malnutrition conducted globally. These studies have shown an
(underweight) from 32% to 16%. According to the increase in malnutrition with an increase in the age
Ministry of Health’s annual statistical reports ma- of the child and other demographic factors (11-
laria, diarrhea, and malnutrition are the major 13). Therefore, the main objective of this study
causes of under-five illnesses and hospital admis- was to use the quantile regression model to iden-
sion. Multiple Indicator Cluster Survey (MICS) tify the factors affecting the under-five children’s
2014 offers an opportunity to assess the status of BMI.
child malnutrition in Sudan face to face MDG
2015 and the NHSSP 2012-2016 targets. Besides, Materials and Methods
it sets to provide baseline evidence-based prioriti-
zation of child malnutrition within the full Poverty The 2014 Sudan MICS was used. The survey was
Reduction Strategic plan and the development of carried out by the Central Bureau of Statistics in
a national multi-sector nutrition strategy. The pur- collaboration with several national institutions.
pose was to focus on targeting to reduce child For the survey, the data were collected using com-
acute malnutrition. According to the 2014 MICS pleted interviews for 15,801 households taken
report, 16.3% of children were weighed at birth. from a sample size of 18,000 households from all
Relatively 32.3% of children born in the last two states of Sudan. The response rate was found to
years, were predicted to weigh less than 2,500 g at be 98 percent. A total of 20,327 women ranging
birth. The prevalence of low birth weight differs between 15–49 yr of age and 14,751 children un-
by urban 27.9% and rural areas 33.9% (7). der five yr of age were included in the survey. This
Globally, an estimated 101 million under-five chil- survey has basic information to track the progress
dren were underweight (i.e. weight for age below - of MDGs related to health and mortality. In gen-
2SD) in 2011, a 36 percent decrease from an esti- eral, 18,302 women aged 15–49 were interviewed
mated 159 million in 1990. Although the preva- from a sample of 16,801 households, and 14,081
lence of stunting and underweight among under- questionnaires were completed for children under-
five years of age has decreased worldwide since five yr of age.
1990, overall progress is insufficient, and millions
of children remain at risk (8, 9). Therefore, malnu- Study Variables
trition is a considerable health problem that needs The response variable for this study is BMI for the
due attention because reducing malnutrition in under-five child in Sudan. The explanatory varia-
children is equivalent to improving the health sta- bles used in this study are the place of residence,
tus of these children. This is equivalent to improv- state, mother’s education, gender, age of the child,
ing the health status of future generations of that the child still breastfeeding, and wealth index. The
society and is indispensable for the economic socioeconomic and demographic factors used in

Available at: http://ijph.tums.ac.ir 2
Iran J Public Health, Vol. 50, No.1, Jan 2021, pp.1-10

this study were suggested by different researchers Furthermore, the general τth sample quantile
(11, 13-16). ( ) which is the analog of ( ), can be formu-
 lated for the optimization solution
Statistical model 5) ∈ ∑ =1 | − |
Quantile Regression (QR) which was proposed by
 Where ( ) = ( − ( < 0)), 0 < < 1.
Koenker and Bassett, is an extension of linear re-
 Here (0) represents the indicator function. Like
gression used to model the conditional quantiles
 the sample mean which minimizes the sum of the
of the dependent variable like 25th percentiles, square residuals.
50th percentiles, and 90th percentiles or 0.90 6) ̂ = ∈ ∑ =1( − )2
quantiles. QR is especially appropriate when the Could be expanded to the linear conditional mean
amount of variation in the conditional quantile, as- ́
serted by the regression coefficients, relies on the function ( \ = ) =
quantile. Median regression is a special case of 7) ̂ = ∈ ∑ =1( − ́ )2
quantile regression when the quantile is 0.50 (17). Similarly, linear conditional quantile function,
The basic superiority of QR compared to MLR is ( \ = ) = ( ) ́ can be estimated via solv-
its resiliency for studying data with heterogeneous ing the following equation
conditional distributions. Data of this type ap- 8) ̂ ( )= ∈ ∑ =1 ( −
peared in various fields, such as econometrics, sur- ́ )
vival analysis, and ecology. QR brings accomplish For any quantiles 0 < < 1. The portion ̂ ( ) is
illustrate of the effect of the variable when a group
 recognized as τth regression quantile, when =
of percentiles is studied, and it assumes no distri-
butional assumption about the error term in the 0.5 which minimizes the sum absolute residuals,
model (18). coincides with median regression. The estimated
Let be a random variable with a distribution model of the conditional quantile is given by
function 9) ̂ ( / )= ́ ̂
 1) ( ) =prob( ≤ ) The interpretation of the estimated parameters in
 ℎ QR has the same way of interpretation as those of
The quantile of is defined as the inverse
 OLS as rates of changes (19). More details about
function
 QR can be found in different works of literature
 2) ( ) = { : ( ) ≥ }
 such as (20-23).
Where 0 < < 1, we consider the Median as a The quantile regression goodness of fit to the
special case (0.5). Also, equation 2) can be ex- given data at each quantile was assessed using
tended as follows: pseudo-R-square as described by Koenker and
 3) ( \ Machao (24). Because the 2014 Sudan MICS was
 ( )
 1 , 2 , . . . . . , ) = 0 + collected using multi-stage sampling, including the
 ( )
 1 1 +. . . . . . . +
 ( ) design effect is important. As a result, the sam-
 pling weights were included in the analysis to ac-
Where 0
Ayele et al.: Determinants of Under-Five Children Body Mass Index in … and Machado. The use of the Wald test was ap- Results plied to test the hypothesis for a pure location shift that fitted for the quantile regression model. The proposed Quantile model was applied to the 2014 Sudan MICS. Table 1 gives the BMI result Ethical approval for different quantile levels. As can be seen from Ethical approval for the study was granted by the the table, the median BMI has the same value as Population Council’s Institutional Review Board the 50th percentile or the second quantile (15.05) and the Ahfad University for Women’s Research values. The 5th percentiles have children with BMI Committee. A written consent was obtained from less than 12.37. This value is considered under- all participants prior to the interviews and discus- weight. Furthermore, children with a BMI from sions and verbal ones were taken from illiterate re- 13.98 to 16.45 (25th to 75th percentile) are consid- spondents after approval from the research com- ered as normal (healthy weight). But, children with mittee. BMI is 20.91 and considered overweight. Table 1: Study result of under-five children BMI Level BMI Median 15.05 5th Percentile 12.37 25th percentile, the first quantile (Q1 ) 13.98 50th percentile, the first quantile (Q2 ) 15.05 75th percentile, the third quantile (Q3 ) 16.45 90th percentile 20.91 Table 2 shows that 27.1% of the children were children's BMI is positively related to the place of from Urban and 72.9% were from rural areas. residence. The under-five BMI increases by 1.6 for Other data are presented in Table 2. rural areas compared to urban areas by holding the The combined test for equivalence of coefficients other factors constant. On the other hand, child of the slop for the household data for the fitted BMI is negatively related to State (Blue Nile, East quantiles 0.25, 0.50, 0.75, and 0.90 was significant Darfor, Gadafir, Gezira, Khartoum, Red Sea, (P-value
Iran J Public Health, Vol. 50, No.1, Jan 2021, pp.1-10

 Table 2: Distribution of covariates

 Variable Number Percentage 95% CI
 Lower Upper
 Place of residence
 Urban 3998 27.10 26.40 27.80
 Rural 10753 72.90 72.20 73.60
 State
 Northern 559 3.80 3.50 4.10
 River Nile 600 4.10 3.80 4.40
 Red Sea 443 3.00 2.70 3.30
 Kassala 681 4.60 4.30 5.00
 Gadarif 881 6.00 5.60 6.40
 Khartoum 717 4.90 4.50 5.20
 Gezira 822 5.60 5.20 6.00
 White Nile 785 5.30 5.00 5.70
 Sinnar 859 5.80 5.50 6.20
 Blue Nile 1052 7.10 6.70 7.60
 North Kordofan 799 5.40 5.10 5.80
 South Kordofan 1120 7.60 7.20 8.00
 West Kordofan 763 5.20 4.80 5.50
 North Darfor 976 6.60 6.20 7.00
 West Darfor 860 5.80 5.50 6.20
 South Darfor 1017 6.90 6.50 7.30
 Central Darfor 875 5.90 5.60 6.30
 East Darfor 942 6.40 6.00 6.80
 Gender
 Male 7506 50.90 50.10 51.70
 Female 7245 49.10 48.30 49.90
 Mother's education
 None 6885 46.70 45.90 47.50
 Primary 4893 33.20 32.50 34.00
 Secondary 2117 14.40 13.80 14.90
 Higher 837 5.70 5.30 6.10
 Age of child(yr)
 Under one 2983 21.20 20.50 21.90
 One 2642 18.80 18.10 19.40
 Two 2639 18.70 18.10 19.40
 Three 3233 23.00 22.30 23.70
 Four 2584 18.40 17.70 19.00
 Child ever been breastfed
 Yes 7941 97.60 97.30 97.90
 No 194 2.40 2.10 2.70
 Child still being breastfed
 Yes 5173 65.20 64.10 66.20
 No 2761 34.80 33.80 35.90
 Wealth Index
 Poor 7313 49.60 48.80 50.40
 Middle 3289 22.30 21.60 23.00
 Higher 4149 28.10 27.40 28.90

Furthermore, the gender of the child (female) is BMI of the child. The result showed that for a unit
negatively related to the BMI of the under-five change of age, BMI will increase by 0.01 by keep-
child as compared to a male child’s. In addition, ing the other factors constant.
the age of the child was negatively related to the

5 Available at: http://ijph.tums.ac.ir
Ayele et al.: Determinants of Under-Five Children Body Mass Index in …

Similarly, for 0.5 quantile result, state, mother’s ed- under-five child. In a closer look at the results,
ucational level, gender, age of the child, and wealth BMI is negatively related to some states.
index has a significant effect on the BMI of the

 Table 3: Parameter estimates using quantile regression

 Covariates EST P- EST P- EST P- EST P- EST P-value
 value value value value
 OLS 0.25 0.50 0.75 0.90
 Intercept 25.29
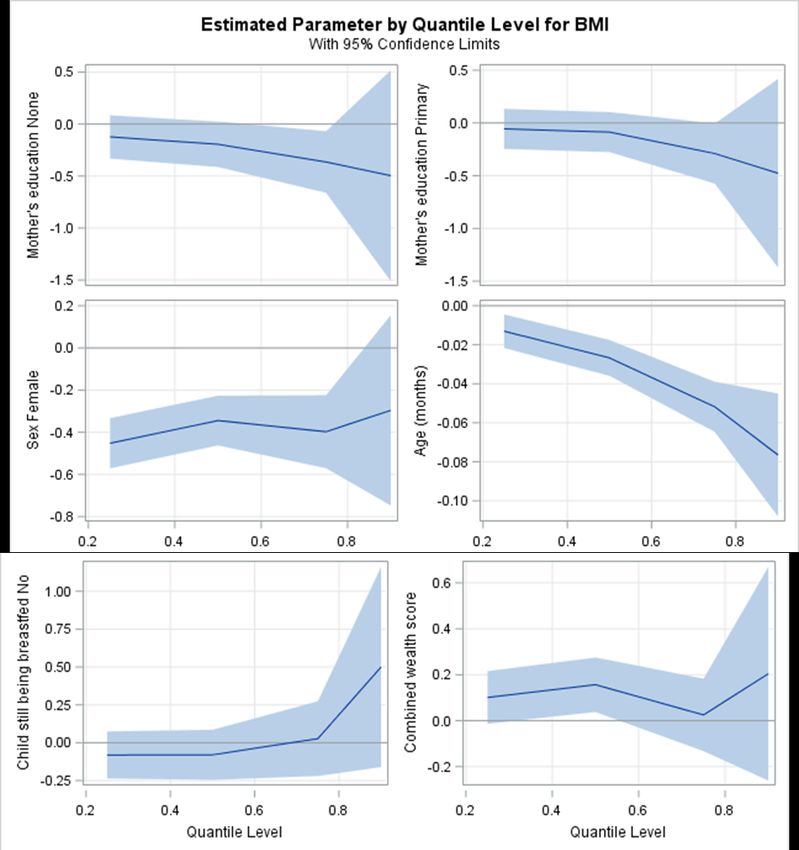
Iran J Public Health, Vol. 50, No.1, Jan 2021, pp.1-10

that BMI is negatively related to some states. the 90th quantile level has the highest number of
These states are Khartoum, North Darfor, North- significant states on BMI of the under-five child.
ern, River Nile, Sinnar and South Darfor. The As given in Table 3, the significant effects are the
other significant effect of BMI is the educational state and age of the child. Both effects are nega-
level of the mother. As the result indicates, the ed- tively related to the BMI of the under-five child.
ucational level is negatively related to BMI. Simi- Fig. 1 and 2 present a summary of the quantile re-
larly, the gender and age of the child have a nega- gression findings of the study variables. Each plot
tive effect on the BMI of the under-five child. shows one coefficient in the quantile regression
The other quantile level of the analysis is the 90th model, 95% confidence intervals represented in
quantile. Compared to the other quantile levels, the shaded regions.

 Fig. 1: Quantile processes with 95% confidence bands for state

7 Available at: http://ijph.tums.ac.ir
Ayele et al.: Determinants of Under-Five Children Body Mass Index in …

The intercept of the model is represented in the Figure 2 shows quantile processes for mother’s ed-
first part of Fig. 1 and can be interpreted as the ucation, gender, age, child breastfeeding, and
estimated conditional quantile function of the un- wealth index. The first plot in the figure shows the
der-five children BMI for all possible quantile lev- mother's education. The effect of the mother’s
els. The figure has a positive effect in the upper BMI in the model has a negative effect in the up-
quantiles when compared to the lower quantiles. per quantiles; the graph indicates a negatively de-
Besides, the graph indicates a positively upward scending sloped line across the quantiles. The
sloped line across the quantiles. The second plot other plots represent the gender of the under-five
shows the effect of place of residence on under- child. The figure shows an increasing pattern for
five children’s BMI has a positive effect, especially upper quantiles. The next plot in the figure is the
in the upper quantile’s levels. The third plot shows age of the child in a month. In contrast, this plot
the effect of the state in the model. The plot shows shows a negative relationship between age and
a negative effect across quantile levels except for BMI of under-five children. On the other hand,
Kassala state. the wealth index of the household has a decreasing
 pattern.

Fig. 2: Quantile processes with 95% confidence bands for mother’s education, gender, age, child breastfeeding, and
 wealth index

Available at: http://ijph.tums.ac.ir 8
Iran J Public Health, Vol. 50, No.1, Jan 2021, pp.1-10

Discussion the focus of policymakers should be on the influ-
 ential significant factors which were found across
In the area of under-five malnutrition, different re- all quantile levels to plan and develop strategies to
searchers have presented their findings. From enhance the normal or healthy weight status of un-
these studies, it was observed that poor attitude der-five children in Sudan.
and practice by parents and the poor environment
surrounding them was one of the reasons (25). Ethical considerations
Moreover, in Ethiopia for children under the age
of five, the current age of mother, mother’s region, Ethical issues (Including plagiarism, informed
and weight of the child at birth were significantly consent, misconduct, data fabrication and/or fal-
affecting under-five children’s BMI across quan- sification, double publication and/or submission,
tile levels (16). From similar studies, age, gender, redundancy, etc.) have been completely observed
learning in classes, playing in the open air, reading by the authors.
books or use of the internet, current maternal
smoking, television viewing (both with higher Acknowledgements
BMI), and frequent nut consumption (11-13).
For this study, the quantile regression was used for We thank UNICEF for giving us access to the data
the analysis of under-five children’s BMI using the file.
2014 MICS. The point estimates of quantile levels
allowed us to identify the effects of predictors on Conflict of interest
various quantiles of the under-five BMI. There-
fore, the result gave a full situation of the associa- The authors declare that there is no conflict of in-
tion between the outcome and explanatory varia- terest.
bles. The evaluations across the different quantile
levels gave us to study the influence of predictors
 References
on different quantile levels of the response varia-
ble (BMI of under-five children) and thus make 1. Hammer LD, Kraemer HC, Wilson DM, Ritter
available a complete picture of the association be- PL, Dornbusch SM (1991). Standardized
tween the response and different covariates. percentile curves of body-mass index for
This study revealed that children under the place children and adolescents. Am J Dis Child,
of residence, state, mother’s education level, gen- 145)3):259-263.
der, age of the child, and wealth index were found 2. Pietrobelli A, Faith MS, Allison DB, Gallagher D,
to be an important effect significantly affecting Chiumello G, Heymsfield SB (1998). Body
under-five children’s BMI at different quantile lev- mass index as a measure of adiposity among
els. Therefore, our findings supported the findings children and adolescents: a validation study. J
of previous studies. Pediatr, 132(2):204-210.
 3. Barlow SE (2007). Expert committee
 recommendations regarding the prevention,
Conclusion assessment, and treatment of child and
 adolescent overweight and obesity: summary
Investigating BMI is an important public health is- report. Pediatrics, 120 Suppl 4:S164-S192.
sue among children under five yr of age in Sudan. 4. Centers for Disease Control and Prevention
Besides, not only education but also socioeco- (2009). About Adult BMI.
nomic factors affect the under-five children’s http://www.cdc.gov/healthyweight/assessin
BMI. Therefore, taking measures on the nutri- g/bmi/adult_bmi/index.html
tional status of mothers will accordingly resolve 5. Centers for Disease Control and Prevention
the nutritional status of their children. Therefore, (2009) BMI for children and teens.
 http://www.cdc.gov/healthyweight/assessin

9 Available at: http://ijph.tums.ac.ir
Ayele et al.: Determinants of Under-Five Children Body Mass Index in …

 g/bmi/childrens_bmi/about_childrens_bmi. 14. Jabakhanji SB, Boland F, Ward M, Biesma R
 html (2018). Body mass index changes in early
 6. United Nations (2020) Millennium Development childhood. J Pediatri, 202:106-114.
 Goals: Sudan: 15. Taal HR, vd Heijden AJ, Steegers EA, Hofman A,
 https://www.indexmundi.com/sudan/millen Jaddoe VW (2013). Small and large size for
 nium-development-goals.html. Accessed gestational age at birth, infant growth, and
 09/15/2020. childhood overweight. Obesity (Silver Spring),
 7. Central Bureau of Statistics, UNICEF Sudan 21(6):1261-1268.
 (2016) Multiple Indicator Cluster Survey 2014 16. Yirga AA, Ayele DG, Melesse SF (2018).
 of Sudan, Final Report. UNICEF and Central Application of Quantile Regression: Modeling
 Bureau of Statistics (CBS), Khartoum, Sudan Body Mass Index in Ethiopia. The Open Public
 8. De Onis M, Brown D, Blossner M, E. B (2012). Health Journal, 11.
 Levels and trends in child malnutrition. 17. Koenker R, Bassett Jr G (1978). Regression
 UNICEF-WHO-The World Bank Joint Child quantiles. Econometrica, 46(1): 33-50.
 Malnutrition Estimates. 18. Koenker R, Hallock KF (2001). Quantile
 9. Habyarimana F, Zewotir T, Ramroop S, Ayele D regression. J Econ Perspect, 15:143-156.
 (2016). Spatial Distribution of Determinants 19. Bushinsky M (1998). Recent advances in quantile
 of Malnutrition of Children under Five Years regression models. J Hum Resour, 33:88-126.
 in Rwanda: SimultaneousMeasurement of 20. Davino C, Furno M, Vistocco D (2013). Quantile
 Three Anthropometric Indices. Journal of regression: theory and applications. 1st ed. John Wiley
 Human Ecology, 54:138-149. & Sons.
 10. Himes JH, Dietz WH (1994). Guidelines for 21. Koenker R (2005). Econometric Society Monographs:
 overweight in adolescent preventive services: Quantile Regression. New York: Cambridge
 recommendations from an expert committee. University.
 Am J Clin Nutr, 59(2):307-316. 22. Neter J, Kutner MH, Nachtsheim CJ, Wasserman
 11. de Moraes Ferrari GL, Matsudo V, Katzmarzyk W (1996). Applied linear statistical models.4th ed.
 PT, Fisberg M (2017). Prevalence and factors 23. Sen A, Srivastava M (2012). Regression analysis:
 associated with body mass index in children theory, methods, and applications. ed. Springer
 aged 9–11 years. J Pediat (Rio J), 93(6):601-609. Science & Business Media.
 12. Guiné RP, Fernandes SR, Abrantes JL, Cardoso 24. Koenker R, Machado JA(1999). Goodness of fit
 AP, Ferreira M (2016). Factors affecting the and related inference processes for quantile
 body mass index in adolescents in Portuguese regression. Journal of the American Statistical
 schools. Hrvatski časopis za prehrambenu Association,94(448):1296-1310.
 tehnologiju, biotehnologiju i nutricionizam, 11:58-64. 25. Nordin R, Said N, Nordin FF, Adnan NF (2018).
 13. Kumar R, Abbas F, Mahmood T, Somrongthong Factors Influence on Body Mass Index (BMI)
 R (2019). Prevalence and factors associated among Overweight and Obese School
 with underweight children: a population-based Children. Journal of ASIAN Behavioural Studies,
 subnational analysis from Pakistan. BMJ Open, 3:11-21.
 9:e028972.

Available at: http://ijph.tums.ac.ir 10
You can also read