DETERMINATION OF OPTIMUM MANAGEMENT STRATEGY FOR HONEY PRODUCTION FOREST LANDS USING A'WOT AND CONJOINT ANALYSIS: A CASE STUDY IN TURKEY
←
→
Page content transcription
If your browser does not render page correctly, please read the page content below
Güngör: Determination of optimum management strategy of honey production forest using A'WOT and conjoint analysis: a case
study in Turkey
- 3437 -
DETERMINATION OF OPTIMUM MANAGEMENT STRATEGY
FOR HONEY PRODUCTION FOREST LANDS USING A'WOT
AND CONJOINT ANALYSIS: A CASE STUDY IN TURKEY
GÜNGÖR, E.
Bartın University, Faculty of Forestry, 74100 Bartın, Turkey
e-mail: egungor@bartin.edu.tr; phone: +90-5-326-283-318; fax: +90-3-782-235-069
(Received 11th Mar 2018; accepted 21st May 2018)
Abstract. In this study, it was aimed to develop alternative management strategies for Honey Production
Forest (HPF) lands, which are planned to be set up in Bartin, and to select the optimum one. For this, a
model (A'WOT-CJA), in which A'WOT (SWOT-Analytical Hierarchy Process) and Conjoint Analysis
(CJA) are used together, was developed within the framework of ecological, social and economic criteria
based on the participation principle. Within the scope of A'WOT-CJA, the honey status of Bartin was
determined by SWOT in the first step and it was prioritized using AHP by digitizing in the second step.
The highest SWOT values found as a result of AHP are "honey type" with 0.245 in terms of strength,
"honey production season length" with 0.202 in terms of weakness, "bee product type" with 0.224 in
terms of opportunity and "beekeeping type" with 0.147 in terms of threat. However, in order to improve
the effectiveness and comprehensiveness of the strategies, 81 strategies with four factors, each consisting
of three levels, were developed and evaluated by CJA in the third step. However, since it was difficult and
time consuming to prioritise these 81 strategies, these strategies were reduced to 9 through orthogonal
rotation and were arranged to be 110 participants among those related to the subject (50 people from the
local population, 10 people from public institutions, and 50 people from NGOs). According to the
A'WOT-C results, HPF optimum management strategy of Bartin Province was formed as follows; "In the
establishment of honey forests, giving priority to the chestnut species with high economic return, putting
the lands, where the honey production season will last at least six months, forward in land selection,
preparing the lands especially to increase the honey and royal jelly yield and the lands being in such
form to support migratory beekeeping.”
Keywords: forest management, beekeeping, participation, multi-criteria decision-makings, rural
development
Introduction
The necessity of using the natural resources effectively and efficiently in
consideration of increasing population, needs and expectations refers to a precise
equation in today's world and human being is the basis of this equation. Planners and
implementers endeavour to meet the ever-changing and evolving needs. This process
also increases the expectations for natural resources.
Although the fuel wood and timber are the most known among the resources
obtained from the forests, the non-wood forest products (NWFP) are the most common
products obtained from forest resources. Within the scope of plant-derived non-wood
forest products in Turkey, apicultural products and honey have important roles as well
as wild food plants, medical and aromatic plants, bulbous plants, dye plants and
mushrooms (HFAP, 2013). Forest resources also provide an important input to
apicultural products with their rich biodiversity and gene resources.
Forests are important resources for the production of quality honey (HFAP, 2013).
Furthermore, while forests provide a low investment environment for beekeeping
activities, they create high income opportunity with the labour force input and constitute
an important source of income for forest villagers (Yilmaz, 2006; Gungor and Ayhan,
APPLIED ECOLOGY AND ENVIRONMENTAL RESEARCH 16(3):3437-3459.
http://www.aloki.hu ● ISSN 1589 1623 (Print) ● ISSN 1785 0037 (Online)
DOI: http://dx.doi.org/10.15666/aeer/1603_34373459
2018, ALÖKI Kft., Budapest, Hungary
Güngör: Determination of optimum management strategy of honey production forest using A'WOT and conjoint analysis: a case
study in Turkey
- 3438 -
2016). In addition, they make significant contributions to reduce the rural-urban
migration and ensure community stability with the influence of income (Yilmaz, 2006).
When viewed from this aspect, it can be stated that beekeeping is one of the most
important rural development instruments (Korkmaz et al., 2015). On the other hand,
while forests contribute to honey production, they also help pollination and soil
conservation and they fulfill an important function at the point of conservation and
development of biodiversity (HFAP, 2013).
Honey and apicultural products produced together with honey such as propolis, royal
jelly, pollen and beeswax have an important place in world trade. Today, there are
around 59 million bee hives in the world and around 1 million 250 thousand tonnes of
honey is produced from them. India is the country with the highest number of hive
assets in the world (12 million hives). Nevertheless, China, which has 9 million hives, is
the country that produces the biggest amount of honey (466.6 thousand tonnes) in the
world. After China, Turkey (94.7 thousand tonnes), Iran (74.6 thousand tonnes),
Ukraine (73.7 thousand tonnes) and Russian Federation (68.4 thousand tonnes) come
respectively in terms of honey production (Figure 1) (FAO, 2018). As can be
understood from these statistics, Turkey is the second most important honey producer of
the world.
Production (thousand tonnes)
Figure 1.World’s 10 largest honey producers (FAO, 2003)
The average honey production per hive is around 22 kg in the world. Canada (56
kg/hive), China (52 kg/hive), Mexico (39 kg/hive), Argentina (27 kg/hive) and the USA
(26 kg/hive) are the countries that carry out honey production above the world average.
Turkey is considerably lower than the world average with the production value of 15
kg/hive (ranks number 12) (FAO, 2009, 2018). Although 75% of honey plant species
and varieties, which are available in the world, are available in Turkey (HFAP, 2013),
Turkey does not yet have a sufficient role in the world honey trade, as the honey yield
per hive is below the world average (OCEP, 2013).
On the other hand, forest areas in Turkey cover the 27.6% (21.678.134 ha) of the
area of the country (Table 1). The areas, where there are forest trees and shrubs such as
chestnut, tilia, acacia and rhododendron, which can be used as honey forests, form about
4% of the forest areas (GDF, 2015). When forest gap inside the forests are added to
these areas, it is understood that Turkish forest areas have sufficient potential for Honey
Production Forests (HPF).
APPLIED ECOLOGY AND ENVIRONMENTAL RESEARCH 16(3):3437-3459.
http://www.aloki.hu ● ISSN 1589 1623 (Print) ● ISSN 1785 0037 (Online)
DOI: http://dx.doi.org/10.15666/aeer/1603_34373459
2018, ALÖKI Kft., Budapest, HungaryGüngör: Determination of optimum management strategy of honey production forest using A'WOT and conjoint analysis: a case
study in Turkey
- 3439 -
In order to increase honey production yield and to establish sustainable honey
forests, the areas, where forests are to be established, should be determined with a
participatory approach by taking the social demands and resource constraints into
consideration. For this reason, interest groups should be included in the planning
process during the process of determining the optimal management strategy of HPF.
Through the HPFs to be planned in this way, the forests will be capable of providing
many ecological-environmental, economic and socio-cultural benefits as well as the
yield increase.
Effective strategies should be developed and implemented at the determination,
management and planning stages of HPF lands in forests due to the contributions of
beekeeping and apicultural products. There are number of examples of forest products
and services in the world that are integrated into management strategies (Leuschner,
1992; Clutter et al., 1992; Duerr, 1993; Klempeer, 1996; Martell et al., 1998; Carsjeans
and Vanderknaap, 2002; Eastman et al., 1998; Yilmaz, 2004; Gungor, 2005; Sen and
Gungor, 2018).
Food safety, which has become even more important with the increase in world
population, and the production of honey and other apicultural products within this
context (FAO, 2009), have become one of the ultimate goals that should be achieved for
Turkish forestry (GDF, 2015). However, the studies conducted to increase honey
production are not carried out by scientific methods but by the initiatives of decision
makers. Within this scope, it was aimed to develop alternative management strategies
for the planning of HPF sites using multi-criteria decision making methods and to select
the most suitable HPF site by prioritising the alternatives.
Study area
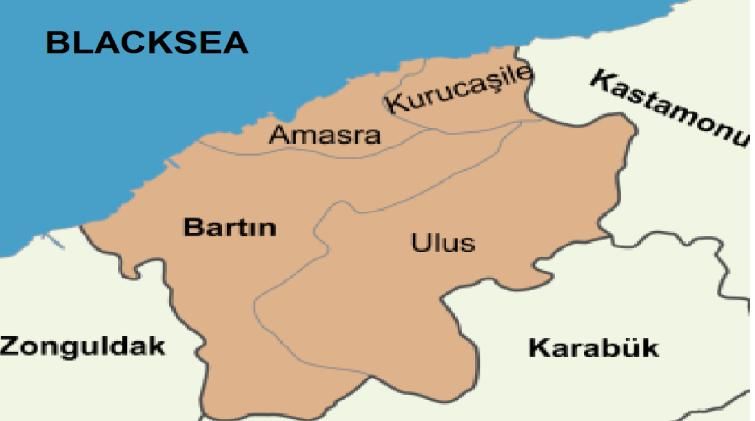
Bartin Province, which is the study area, is located in the Western Black Sea region
of Turkey between 41°53' northern latitude and 32°45' eastern longitude (Figure 2). Its
surface area is 2,143 km2. In Bartin, mild marine climate (Black Sea Climate) with
warm (26 °C and over) summers and cooler winters (-2 °C and below) prevail (BMST,
2017). The fact that it is close to the sea and that the mountain ranges, which are not
very high, are parallel to the shore causes the temperature differences on the coastline to
decrease and humidity to increase (BG, 2017). For this reason, Bartin Province has an
important potential of honey production in terms of its geographic location and climate.
The general area of Bartin Province is 228,576 ha. The forest area is 135,437 ha and the
forest area ratio of the province is 59.3%. This value is above the average of Western
Black Sea (50%) and the country (28%) (GDF, 2015). Bartin Province has an important
potential of honey production in terms of its forest area values.
Bartin is one of the significant regions in terms of potential honey production areas
due to its rich biodiversity in the Black Sea region, its edaphic and climatic conditions,
for having tree species with high nectar yield such as chestnut, tilia and false locust etc.
(GDF, 2011; WWF, 2003, 2010; Gungor and Ayhan, 2016).
On the other hand, in terms of honey production, forest area, general area, number of
forest villages, population, general population and number of hives of Bartin Province
and region and country values are given in Table 1 (Gungor and Ayhan, 2016).
APPLIED ECOLOGY AND ENVIRONMENTAL RESEARCH 16(3):3437-3459.
http://www.aloki.hu ● ISSN 1589 1623 (Print) ● ISSN 1785 0037 (Online)
DOI: http://dx.doi.org/10.15666/aeer/1603_34373459
2018, ALÖKI Kft., Budapest, HungaryGüngör: Determination of optimum management strategy of honey production forest using A'WOT and conjoint analysis: a case
study in Turkey
- 3440 -
Figure 2. Geographical location of Bartin Province
.
Bartin Province, which has a high portion of forest assets, is also well above the
country average in terms of forest villager density. Therefore, Bartin Province, which
has an important potential for honey production, is well below the country and the
region average in terms of honey yield level (Table 1). As can be understood from these
statistics, Bartin Province could not tip the scales in its own favour in honey production.
Table 1. Comparison of forest area, general area, number of forest villages, population,
general population and number of hives of Bartin Province with region and country values
Area Information(1) Population Information(2) Honey Production Values
Forest Forest
General Area/ Forest Total Villagers/ Number of Honey
Region Provinces Forest Area Honey Yield
Area General Villagers Population General Hives(3) Production(4)
(Ha) (Kg/Hive)
(Ha) Area (Person) (Person) Population (Piece) (Tonnes)
(%) (%)
Bolu 514295 806204 64 78849 271208 29 22645 260 11
Duzce 119420 243411 49 85728 338188 25 36164 518 14
Western Zonguldak 156586 385604 41 199013 619703 32 38892 124 3
Black Sea Bartin 110227 199491 55 72260 187758 38 25587 352 14
Karabuk 116804 129980 90 43466 227610 19 19222 248 13
Kastamonu 477316 1250775 38 160724 361222 44 59419 418 7
Western Black Sea
1494648 3015465 640040 2005689 201929 1920
Sum
Western Black Sea
249108 502578 50 106673 334282 32 33655 320 10
Mean
Black Sea General
6727514 11483861 1830241 7539694 1318876 22313
Sum
Black Sea General
373751 637992 59 101680 418872 24 73271 1240 17
Mean
TURKEY Sum 21678134 78534470 7073020 76667864 6348009 94694
TURKEY Mean 267631 969561 28 87321 946517 9 78370 1169 15
(1) GDF, 2014, (2) TBMM, 2010, (3) OCEP, 2013, (4) TUIK, 2017.
APPLIED ECOLOGY AND ENVIRONMENTAL RESEARCH 16(3):3437-3459.
http://www.aloki.hu ● ISSN 1589 1623 (Print) ● ISSN 1785 0037 (Online)
DOI: http://dx.doi.org/10.15666/aeer/1603_34373459
2018, ALÖKI Kft., Budapest, HungaryGüngör: Determination of optimum management strategy of honey production forest using A'WOT and conjoint analysis: a case
study in Turkey
- 3441 -
Materials
Data necessary to realize the study aim is obtained from various public institutions,
non-profit organizations and literature. Within this scope, Management Plans by the
Forestry Operation Directorate of Bartin (FODB) (FODB, 2005), Honey Forest Action
Plan (HFAP) by the General Directorate of Forestry (GDF) (HFAP, 2013) and Bartin
Honey Forest Project (BHFP) (BHFP, 2013) were utilized. Moreover, the statistical data
of the state institutions and organizations (TBMM, 2010; BAKKA, 2011, FAO, 2018,
TUIK, 2017) and the Honey Forest Projects (GDF, 2012a; 2012b; 2014) conducted in
various provinces and scientific research studies conducted in the region (Genc, 2003;
Tutkun, and Bosgelmez, 2003; Misir, 2011; Dogaroglu, 2017; Bekar and Acar, 2017;
Gungor and Sen, 2018; Sen and Gungor, 2018) were also utilized within the scope of
this study. In addition, the records of Turkish Association of Beekeepers (TAB) (TAB,
2017) and Beekeepers Association of Bartin (BAB) (BAB, 2017), which is connected to
this centre, were also used within the scope of the study together with the employers of
association and the local public talks.
Methods
In the development of alternative management strategies for HPF sites and in the
selection of the optimum one, the evaluation of the ecological, social and economic
criteria together and the opinion of the interest groups (local community, public
institution representatives, NGO representatives) will also increase the likelihood of
making the right selection. There are many pure and hybrid Multi-Criteria Decision-
Making (MCDM) techniques that can be used for this purpose in the literature such as
AHP (Analytic Hierarchy Process), ANP (Analytic Network Process), A’WOT (SWOT-
AHP), CJA (Conjoint Analysis), TOPSIS (Technique for Order of Preference by
Similarity to Ideal Solution), TOPSIS-G (Technique for Order of Preference by
Similarity to Ideal Solution with grey numbers), VIKOR (Multi-Criteria Optimization
and Compromise Solution), ELECTRE (Elimination and Choice Expressing Reality),
PROMETHEE (Preference Ranking Organization Method for Enrichment of
Evaluations), SAW (Simple Additive Weighting), DEMATEL (Decision-Making Trial
and Evaluation Laboratory) and DANP (DEMATEL-based ANP).
Considering the aim of the research, the most appropriate MCDM hybridization was
decided to be A'WOT (SWOT-Analytic Hierarchy Process) and Conjoint Analysis
(CJA) combination (A’WOT-CJA). Because within the scope of A'WOT-CJA, the
honey status of Bartin Province was determined by SWOT and the obtained SWOT
criteria were prioritized by digitizing by AHP. Thus, the factors standing out in each
SWOT group formed the basis of HPF management strategies. Sub-levels should also
be defined for the factors developed for more comprehensive strategies. In this way, the
participants can better interpret and analyse the strategies. In this direction, a total of 81
strategies were developed by adding sub-levels to each SWOT factor. However, the
strategies were reduced to 9 through orthogonal rotation in CJA, since it was difficult
and time consuming to prioritise these 81 strategies. By this means, more consistent
results were obtained. These 9 strategies were ranked by the 110 participants in the
direction of CJA, and thus HPF optimum management strategy for Bartin Province was
determined. The MCDM techniques used within the scope of the study are explained
below.
APPLIED ECOLOGY AND ENVIRONMENTAL RESEARCH 16(3):3437-3459.
http://www.aloki.hu ● ISSN 1589 1623 (Print) ● ISSN 1785 0037 (Online)
DOI: http://dx.doi.org/10.15666/aeer/1603_34373459
2018, ALÖKI Kft., Budapest, HungaryGüngör: Determination of optimum management strategy of honey production forest using A'WOT and conjoint analysis: a case
study in Turkey
- 3442 -
A’WOT technique
In the study, a hybrid technique A'WOT (SWOT Analysis and Analytical Hierarchy
Process (AHP) combination) was used. A’WOT is a hybrid method developed by
Kurttila et al. (2000) and Pesonen et al. (2001a). This method provides a structure
combining the AHP method of Saaty (1980) with SWOT. The purpose of utilizing AHP
in SWOT analysis is to evaluate the SWOT factors systematically. While SWOT
analysis provides a frame for the decision status analysis, AHP supports more analytical
application of SWOT (Kurttila et al., 2000; Kangas et al., 2001; Kajanus et al., 2004).
SWOT (Strengths, Weaknesses, Opportunities and Threats) is a commonly applied
tool in the analysis of internal and external environment in order to provide a systematic
approach and support to the cases of strategic decision making (Wheelen and Hunger,
1995, Hill and Westbrook, 1997). The purpose of SWOT implementation in the process
of strategic planning is to develop and adopt a strategy that is generally adaptable
between internal and external factors. SWOT can also be used, when alternative
strategies emerge (McDonald, 1993). SWOT analysis is not capable of assessing the
case of strategic decision making in a comprehensive way. It remains at the level of
detecting the factors only. In addition to this, the expression of individual factors is
often very general and short. Moreover, SWOT does not include tools for determining
the significance of factors analytically or evaluating decision alternatives according to
the factors. Therefore, the more use of SWOT is mainly based on the qualitative
analysis carried out during the planning process and the skills and expertise of the
people involved in the process. In summary, SWOT analysis is a list of internal and
external factors or an incomplete qualitative examination. For this reason, it is
sometimes called as "SoWOT" (Hill and Westbrook, 1997). General structure of SWOT
Analysis realized within the scope of A’WOT is given in Table 2.
Table 2. Structure of SWOT analysis
SWOT ANALYSIS
POSITIVE FACTORS NEGATIVE FACTORS
Internal STRENGTH WEAKNESS
factors (How can we utilize the Strength) How can we convert these to Strength
External OPPORTUNITY THREAT
factors (How can we convert these to Strength) (How can we convert these to Opportunity)
When the operation strategy is required to be determined by using SWOT analysis
only, the internal and external factors, which are effective on the strategy, are listed
roughly, indefinitely and superficially and evaluated as qualitatively insufficient (Hill
and Westbrook, 1997). That is to say, in the traditional SWOT analysis, effect of each
factor on the proposed plan or strategy is not determined. This problem is overcome by
using AHP. In the AHP, each factor is assigned relative priorities in the direction of
binary comparisons (Masozera et al., 2006). Therefore, the missing aspects of the
SWOT analysis in terms of measurement and evaluation are eliminated by AHP. Thus,
SWOT groups and their factors become measurable and their priorities are quantified.
The idea of using AHP within the framework of a SWOT is to assess the SWOT
factors systematically and to balance them according to their intensity (Saaty, 1980;
APPLIED ECOLOGY AND ENVIRONMENTAL RESEARCH 16(3):3437-3459.
http://www.aloki.hu ● ISSN 1589 1623 (Print) ● ISSN 1785 0037 (Online)
DOI: http://dx.doi.org/10.15666/aeer/1603_34373459
2018, ALÖKI Kft., Budapest, HungaryGüngör: Determination of optimum management strategy of honey production forest using A'WOT and conjoint analysis: a case
study in Turkey
- 3443 -
Kurttila et al., 2000). When AHP is included in the SWOT analysis, it analyses the
factors of SWOT analysis by comparing them with each other. AHP helps to conduct
SWOT in a more analytical way and the AHP – SWOT combination is a hybrid model
that is referred to as A'WOT. The range of application of A'WOT technique is quite
extensive and there are many studies available since it is mostly used in the field of
forestry (Leskinen and Kangas, 1998, Kurttilla et al., 2000, Leskinen 2000, Pesonen et
al., 2000, Pesonen et al., 2001b, Kajanus et al., 2004; Yilmaz, 2007; Leskinen et al.,
2008; Gungor, 2011; Gungor and Sen, 2018). A’WOT decision hierarchy benefiting
from the AHP is given in Figure 3.
OPERATIONAL
ENVIRONMENT
SWOT STRENGTH WEAKNESS OPPORTUNITY THREAT
Group (S) (W) (O) (T)
SWOT
Faktors
Strategy S1 S2 ….. Sn
alternatives
Figure 3. Hierarchical representation of A’WOT analysis (Kangas et al., 2001)
In the first step of the A'WOT technique, SWOT analyses are carried out. For this,
firstly SWOT groups consisting of Strengths, Weaknesses, Opportunities and Threats
are formed (Figure 3). Subsequently, the SWOT factors for each SWOT group are
ranked as neutrally as possible. Thus, the internal and external equity factors obtained
are included in the SWOT analysis. However, considering the fact that the human brain
can compare up to 7 ± 2 elements at the same time (Schomoldt et al., 1995), the number
of factors in each SWOT group should not be more than nine.
Later in the A'WOT technique, binary comparison operations are performed between
the SWOT factors in each SWOT group. While these binary comparisons are being
made, the one, who is performing the comparison is asked to state ordinance by asking
questions such as "which factor is more preferred (important) when factor 1 is compared
to factor 2?” and “how much more the factor, which is preferred more after that, is
preferred than the other factor?" According to the information obtained from these
comparisons, the relative significance (priorities) of the SWOT factors are calculated
using the eigenvalue approach within the AHP technique. Then, the binary comparisons
are made between the four SWOT groups. For this, a SWOT factor with the highest
priority value is selected from each group to represent the group. Thus, by using these
four SWOT factors selected from each group, the priority values of the SWOT groups
are calculated using binary comparisons and eigenvalue approach, as in the previous
step. In the next stage, the relative priority value of each SWOT group and the relative
priority value of each of the SWOT factors in this group are multiplied separately. Thus,
the overall priority value of each SWOT factor included in the relevant SWOT group is
obtained. This operation is carried out separately for each of the four SWOT groups. As
APPLIED ECOLOGY AND ENVIRONMENTAL RESEARCH 16(3):3437-3459.
http://www.aloki.hu ● ISSN 1589 1623 (Print) ● ISSN 1785 0037 (Online)
DOI: http://dx.doi.org/10.15666/aeer/1603_34373459
2018, ALÖKI Kft., Budapest, HungaryGüngör: Determination of optimum management strategy of honey production forest using A'WOT and conjoint analysis: a case
study in Turkey
- 3444 -
a result, the overall priority values of all SWOT factors, of which the total value is equal
to one, are obtained (Kurttila et al., 2000; Pesonen et al., 2001a).
After making the comparisons in A'WOT, useful quantitative information about
decision-making can be obtained (Kurttila et al., 2000). In addition, the use of A'WOT
ensures the selection of alternatives according to each SWOT factor and each SWOT
group (Pesonen et al., 2000). When the significance of different SWOT groups are
identified, the selection alternatives can be prioritized as a whole in terms of strategic
selection.
By including the AHP technique in SWOT analyses, SWOT groups and their factors
become measurable and their priorities are set forth numerically. The weights of each
calculated SWOT group and factors constitutes the basis of the strategies to be
developed in the next step.
After the hierarchical structure model is created, matrices are created by making
binary comparisons. Binary comparison is the comparison of two factors or criteria and
is based on the judgment of the decision maker. By binary comparison, it is aimed to
determine the relative significance of the elements in the hierarchy comparing to the
element at the top level (Kurttila et al., 2000). In order to determine the significance
levels of SWOT groups and factors among themselves in the AHS, (n×n) binary
comparison matrices, which are shown in the formula given in equation 1, are created
(Saaty, 1995) and the criteria or alternatives are compared binarily.
A= (Eq. 1)
nxn
The relative significance of contribution to the purpose of each criteria given in
Equation 1 and the superiority of each target are determined in a binary comparison of
judgments (Saaty, 1980). The 1-9 significance scale developed by Saaty (1980) is used
in order to assign value in the comparisons. The meanings expressed by the significance
levels are shown in Table 3.
Table 3. Scale of relative significance (according to Saaty, 1980)
Intensity of
Definition Explanation
importance
1 Equal importance Two factors contribute equally to the objective.
Weak importance of one over
3 Experience and judgement slightly favor one over the other.
another
5 Essential or strong importance Experience and judgement strongly favor one over the another
Very strong or demonstrated
7 Experience and judgement very strongly favor one over the other.
importance
The evidence favoring one over the other is of the highest
9 Absolute importance
possible validity
2,4,6,8 Intermediate values When compromise is needed.
APPLIED ECOLOGY AND ENVIRONMENTAL RESEARCH 16(3):3437-3459.
http://www.aloki.hu ● ISSN 1589 1623 (Print) ● ISSN 1785 0037 (Online)
DOI: http://dx.doi.org/10.15666/aeer/1603_34373459
2018, ALÖKI Kft., Budapest, HungaryGüngör: Determination of optimum management strategy of honey production forest using A'WOT and conjoint analysis: a case
study in Turkey
- 3445 -
Following the formation of the binary comparison matrices the eigenvector of each
item is calculated showing that an item is more important than the other items (Kurttila
et al., 2000). The eigenvector of the matrix in dimension of n×1 is determined as
follows (equation 2):
(Eq. 2)
In order to determine the significance distributions of the criteria, it is necessary to
calculate the W = [wi] nx1 column vectors. W column vector is obtained from the
arithmetic mean of the row elements of the matrix, which is the value of the b y values
given in the formula given in Equation 2.
The consistency ratio (CR) for each of the binary comparison matrices is calculated
(equation 3). For this ratio, an upper limit of 0.10 is required. The ratio being over 0.10,
means that there is inconsistency in decision making. In this case, improvement is
necessary in judgement. The largest eigenvector of the matrix A (λ_max) is calculated
and the CR value is obtained (equation 4).
(Eq. 3)
(Eq. 4)
The randomness index (RI) is another value needed for calculating the consistency
ratio. Table 4 contains the RI values which are determined from constant numbers and
determined according to n value (Kurttila et al., 2000). The CR value is calculated
according to the formula given in Equation 5.
(Eq. 5)
Table 4. Randomness index
n 1 2 3 4 5 6 7 8 9 10
RI 0.00 0.00 0.58 0.90 1.12 1.24 1.32 1.41 1.45 1.49
Later, the factors taking the highest values as a result of A'WOT calculations are
detailed to make the strategies more effective. In this stage, Conjoint Analyses were
utilized and more detailed strategies were developed in this way by adding criteria to
the factors found in A'WOT results in the Conjoint Analysis.
APPLIED ECOLOGY AND ENVIRONMENTAL RESEARCH 16(3):3437-3459.
http://www.aloki.hu ● ISSN 1589 1623 (Print) ● ISSN 1785 0037 (Online)
DOI: http://dx.doi.org/10.15666/aeer/1603_34373459
2018, ALÖKI Kft., Budapest, HungaryGüngör: Determination of optimum management strategy of honey production forest using A'WOT and conjoint analysis: a case
study in Turkey
- 3446 -
Conjoint analysis
The word Conjoint is a combination of the words CONside and JOINT. Conjoint
Analysis (CJA) was developed in the 1970s (Orme, 2009). CJA is a market research
method determining the consumer preferences of multi-featured goods or services that
are effective in demand determination. By using this analysis, it is assumed that the
value given to any product by a person corresponds to the total utility deriving from all
of the determined qualities of that product and then, the likelihood of purchasing that
product is in proportion to the benefit they obtain from that product. CJA determines the
most customer satisfactory combination of the factors related to the product or service
that they consider during the purchasing stage and at the same time ensures the
determination of the most preferred factor levels for that product or service.
The measurement of tools is one of the most basic concepts in CJA which is
designed as factors and sub-levels. A utility gives a subjective decision of preference of
each participant. It also forms the conceptual basis for the measurement value which is a
very important concept for this research (Anderson et al., 2010).
In case the number of factors and their levels are high in CJA, an extra burden will
be added on the participants and the time speared for the research by participants will
increase. Many participants may not want to participate in the survey since it will take
too much time or even they do participate, they may give up they may quibble in order
to save time (Louviere, 1988; Marshall and Bradlow, 2002). For this reason, there is no
need to include a factor, which does not make any difference in the study to be carried
out (Hair et. al, 1995). The number of factors to be used in CJA is usually between 4
and 7 and this number can increase up to 10 to 15. The number of levels is determined
to be between 2 and 5 (Scholl et. al, 2005).
A simple model of CJA, which is generally used to understand consumers' reactions
or preferences to a product or service, is given in equation 6 (Malhotra, 1996;
Raghavarao et. al, 2010):
J Mi
yk ∑∑ jm x jm (Eq. 6)
j 1 m1
Here:
yk : Total utility of an alternative,
βjm : Utility value of factor j at level m,
xjm : The dummy variable, which takes the value of 1 for level m of the factor j and
0 for the other cases, 1 if incentive k has value m of factor j 0 else.
CJA, which includes statistical analysis such as correlation and regression and uses
qualitative and quantitative data, analyses the effects of many independent variables by
using the (utility) function as a dependent variable. In this way, the effect of each
variable on consumer preference is determined.
CJA was used in many researches such as Irish consumer preferences for honey
(Murphy et al., 2000), in the preference of local food producers (Darby et. al, 2008): in
the preference stage of honey consumers in Czech Republic (Sanova et. al, 2017).
In this research, the strategies found as a result of A'WOT were ranked by CJA. For
this, the significance of each factor and sub-level influencing the preferences were
APPLIED ECOLOGY AND ENVIRONMENTAL RESEARCH 16(3):3437-3459.
http://www.aloki.hu ● ISSN 1589 1623 (Print) ● ISSN 1785 0037 (Online)
DOI: http://dx.doi.org/10.15666/aeer/1603_34373459
2018, ALÖKI Kft., Budapest, HungaryGüngör: Determination of optimum management strategy of honey production forest using A'WOT and conjoint analysis: a case
study in Turkey
- 3447 -
determined by CJA (utility, weight) and their combinations were presented to the
participants. By this means, the optimum management strategy of HPF was determined.
Preparation and implementation of survey forms
SPSS (Statistical Package for Social Science) 21.0 package program was used for
A'WOT and CJA. Surveys conducted under the context of A'WOT and CJA were
implemented through face-to-face interviewing method in place. The surveys were
made in the Central District, Amasra District and Kozcagiz District of Bartin.
The number of participants was determined according to the simple random sampling
method. In this method, the sub-groups/layers are represented in the sample at the
proportion of their weights in an environment of which the boundaries are set. In order
to be able to make the sampling, the number of units to be selected from each sub-
population is determined by the share of that sub-population within the entire
population (Kurant et al., 2011). Thus, the sample to be formed is guaranteed to
represent the population with all its sub-units (Fuller, 2009). Participants in the study
were assessed in three interest groups (in the sub-layer) as local residents, public
institutions and NGOs in order to increase the precision of A'WOT and CJA analyses.
Later, the number of participants, who were subject to the survey in each interest group,
was calculated using the formula given in equation 7 (Daniel, 1999):
NZ 2 pq
n (Eq. 7)
d 2 ( N 1) Z 2 pq
Where:
N : Population size (102 people from the local population, 20 people from public
institutions, and 98 people from NGOs),
n : Sample size (50 people from the local population, 10 people from public
institutions, and 50 people from NGOs),
Z : Z statistic for a level of confidence. Confidence level 95% (1.96),
p : Probability of the presence of the aspect aimed to be measured within the main
group (taken 50% due to the multi-purpose nature of this study),
q : 1-p,
d : Sampling error considered 10% (0.1).
As a result of the calculations made, surveys were made within the context of both
A'WOT and CJA with a total of 110 people, 50 from local residents, 10 from public
institutions and 50 from NGOs.
Results and Discussion
SWOT findings and A’WOT calculations
Evaluation of Bartin Province in terms of honey production is given in Table 5.
SWOT outputs were evaluated by AHP under the scope of A'WOT and the values of
SWOT groups and factors, which were considered to be effective in the development of
HPF management strategies in Bartin, were obtained.
APPLIED ECOLOGY AND ENVIRONMENTAL RESEARCH 16(3):3437-3459.
http://www.aloki.hu ● ISSN 1589 1623 (Print) ● ISSN 1785 0037 (Online)
DOI: http://dx.doi.org/10.15666/aeer/1603_34373459
2018, ALÖKI Kft., Budapest, HungaryGüngör: Determination of optimum management strategy of honey production forest using A'WOT and conjoint analysis: a case
study in Turkey
- 3448 -
Table 5. Consistency rates1 and priorities of SWOT groups and factors according to A'WOT
results
Priority of
Overall
SWOT Group SWOT Consist- factor
priority of
group priority factors ratio within
factor
group
S1. Natural forests increasing the honey yield 0.109 0.038
S2. Old growth with organic honey production capability 0.171 0.060
S3. Nectar plants contributing in pollen quality 0.178 0.063
S4. Potential of producing chestnut, tilia, false locust and
0.104 0.245 0.086
rhododendron honey that are sold in high prices
Strengths 0.352
S5. Proximity to major markets such as Istanbul and Ankara 0.094 0.033
S6. Scientists with experience in beekeeping 0.050 0.018
S7. Bee races resistant to disease 0.032 0.011
S8. Climatic and ecological structure that is suitable for
0.120 0.042
beekeeping
W1. Honey yield below the average of Turkey, 0.178 0.031
W2. Low-yield stationary beekeeping activities instead of
0.202 0.035
high-yield migratory beekeeping,
W3. The understanding of seeing beekeeping as a hobby, 0.170 0.029
W4. Restricted capital transfers to beekeeping, 0.161 0.028
Weaknesses 0.172
W5. Lack of information on food safety, 0.101 0.080 0.014
W6. Lack of registered beekeeper and uncontrolled
0.042 0.007
beekeeping,
W7. Inadequate and untended beekeeping education, 0.103 0.018
W8. High migration rate. 0.063 0.011
O1. High rate of increase in demand for apicultural products, 0.141 0.046
O2. The rural population capable of beekeeping, 0.039 0.013
O3. Flora's potential to produce high-yield apicultural
0.224 0.073
products (such as royal jelly, propolis, beeswax)
O4. Ever-growing market for organic products, 0.109 0.221 0.072
Opportunities 0.324
O5. National and international supports in financing
0.060 0.019
beekeeping,
O6. The key role of beekeeping in reducing migration, 0.088 0.029
O7. New international markets with export potential, 0.153 0.050
O8. Positive developments in OGM policies. 0.073 0.024
T1. Social insecurity due to fake honey production, 0.121 0.018
T2. Bottlenecks in the marketing channels for the apicultural
0.112 0.017
products in Turkey,
T3. Lack of corporate company in honey production, 0.123 0.019
T4. Lack of understanding the importance of beekeeping in
0.079 0.118 0.018
rural development,
Threats 0.151 T5. In spite of favourable season for long-term honey
production, the short-term honey production season in 0.147 0.022
practice,
T6. Financial bottlenecks experienced in beekeeping, 0.098 0.015
T7. Shadow economy in honey production and sales, 0.110 0.017
T8. Lack of scientific knowledge on bee breeding and honey
0.170 0.026
production.
1
The consistency ratio of the comparisons between four SWOT groups was 0.093
APPLIED ECOLOGY AND ENVIRONMENTAL RESEARCH 16(3):3437-3459.
http://www.aloki.hu ● ISSN 1589 1623 (Print) ● ISSN 1785 0037 (Online)
DOI: http://dx.doi.org/10.15666/aeer/1603_34373459
2018, ALÖKI Kft., Budapest, HungaryGüngör: Determination of optimum management strategy of honey production forest using A'WOT and conjoint analysis: a case
study in Turkey
- 3449 -
When Table 5 is examined, Strengths group has the highest score in the SWOT
group with 0.352. This is followed by Opportunities with 0.324. Weaknesses with 0.172
ranks third and Threats with 0.151 is the last. According to these results, it is understood
that in the development of the HPF management strategies for Bartin Province, a
structure, which emphasizes Strengths and Opportunities and dismisses Weaknesses and
Threats, should be adopted. Moreover, "S4" in the Strengths group has the highest score
among the SWOT factors with 0.245 (0.086 in the total average). "O3" with 0.224
(0.,073 in the total average) from Opportunities group ranks second. "W2" with 0.202
(0.035 in the total average) from the Weaknesses group ranks third and "T5" with 0.147
(0.022 in the total average) from the Threats group is the last one. In addition, showing
the values obtained on the figure is given in Figure 4.
Figure 4. An illustration of the relative significance of SWOT factors in an A'WOT application
to HPF optimum management strategy
CJA calculations
CJA was used in determining the sub-criteria of the factors determined by A'WOT. In
the CJA calculations made according to the formula given in Equation 1, "preference
score and order of priority for alternative HPF management strategies" was taken as the
APPLIED ECOLOGY AND ENVIRONMENTAL RESEARCH 16(3):3437-3459.
http://www.aloki.hu ● ISSN 1589 1623 (Print) ● ISSN 1785 0037 (Online)
DOI: http://dx.doi.org/10.15666/aeer/1603_34373459
2018, ALÖKI Kft., Budapest, HungaryGüngör: Determination of optimum management strategy of honey production forest using A'WOT and conjoint analysis: a case
study in Turkey
- 3450 -
dependent variable. Dependent variable was measured by ordering and 9 strategies were
used in ordering. In the development of the strategies, there were four independent factors
(variables) determined by A'WOT and three levels developed under CJA (Table 6).
Table 6. A'WOT factors and CJA levels
1st Step: Factors determined under
2nd Step: Levels developed under CJA
A’WOT
SWOT SWOT
Factor Name Factor Level
groups factors
1. Tilia + False Locust Honey
Strengths S4 Honey Type 2. Chestnut Honey
3. Rhododendron Honey
1. Stationary beekeeping on the same land
Weaknesses W2 Beekeeping Type 2. Migratory beekeeping on the same land
3. Migratory beekeeping on different lands
1. Honey + Royal Jelly
Opportunities O3 Apicultural Product 2. Propolis + Bee Venom
3. Pollen + Beeswax
1. Maximum 3 months
Honey Production
Threats T5 2. Approximately 6 months
Season
3. 9 months and longer
By taking the factors and sub-levels in Table 4, it is possible to develop a total of
34=81 combinations (strategies) on the basis of full design (full profile) (Green and
Sirinavasan, 1978; Malhotra, 1996, Gungor, 2005). However, in this case it is difficult
and time consuming for participants to prioritise 81 strategies. For this reason,
management strategies have been developed in which each factor and sub-levels are
independent (as an orthogonal design) (Hair et al., 1995; Smith, 1999). In the
development of these strategies, in accordance with the CJA and for the purpose, the
most negative level of each factor was taken as a reference (rhododendron honey for the
factor of honey type, pollen+beeswax for apicultural product factor, maximum 3 months
for honey production season, for the type of beekeeping stationary on the same land).
For the remaining levels, 8 dummy variables with the values of 0 or 1 were defined.
Based on this dummy variable defined, 9 alternative management strategies were
developed based on orthogonal design (Table 7).
Table 7. HPF management strategies formed on the basis of orthogonal design in CJA
Factors and Levels
Strategy Honey
No Apicultural
Honey Type Production Beekeeping Type
Product
Season
Approximately Stationary beekeeping on
1 Tilia + False Locust Honey Pollen + Beeswax
6 months the same land
Propolis + Bee Maximum 3 Migratory beekeeping on
2 Tilia + False Locust Honey
Venom months the same land
Honey + Royal Approximately Migratory beekeeping on
3 Chestnut Honey
Jelly 6 months the same land
Honey + Royal 9 months and Migratory beekeeping on
4 Tilia + False Locust Honey
Jelly longer different lands
APPLIED ECOLOGY AND ENVIRONMENTAL RESEARCH 16(3):3437-3459.
http://www.aloki.hu ● ISSN 1589 1623 (Print) ● ISSN 1785 0037 (Online)
DOI: http://dx.doi.org/10.15666/aeer/1603_34373459
2018, ALÖKI Kft., Budapest, HungaryGüngör: Determination of optimum management strategy of honey production forest using A'WOT and conjoint analysis: a case
study in Turkey
- 3451 -
9 months and Migratory beekeeping on
5 Rhododendron Honey Pollen + Beeswax
longer the same land
Propolis + Bee Approximately Migratory beekeeping on
6 Rhododendron Honey
Venom 6 months different lands
Propolis + Bee 9 months and Stationary beekeeping on
7 Chestnut Honey
Venom longer the same land
Maximum 3 Migratory beekeeping on
8 Chestnut Honey Pollen + Beeswax
months different lands
Honey + Royal Maximum 3 Stationary beekeeping on
9 Rhododendron Honey
Jelly months the same land
Later on, special cards were prepared for the strategies in Table 7 and presented through
personal interviews. The interviews were held in Bartin in 2016 with representatives of
local residents and state institutions and non-governmental organizations. The number
of persons interviewed was found using the formula (Equation 7) that gives sample size
in limited communities.
Determination of optimum management strategy
As required by CJA, the participants were asked to rank the strategies, which are
formed according to Table 7, from the best to the worst. The optimum management
strategy for the HPF in Bartin was determined as the result of the analysis of the linear
regression model, in which the average of the priorities given by 110 participant to each
strategy is considered the dependent variable and the dummy variable levels of the
factors as independent variable, using CJA.
According to the CJA results, in the strategies developed during the establishment
process of honey forest, “Honey Production Season "with 34.44% ranks first,
"Beekeeping Type" with 28.15% ranks second, "Honey Season" with 22.66% ranks third
and "Apicultural Product" factor with 14.75% ranks last (Table 8).
Table 8. CJA results
Utility Significance
Factor Name Factor Levels
Coefficient Level (%)
1.1. Tilia + False Locust Honey
-0.151
1. Honey Type 1.2. Chestnut Honey 22.66
0.572
1.3. Rhododendron Honey
-0.421
2.1. Honey + Royal Jelly
0.507
2. Apicultural Product 2.2. Propolis + Bee Venom 14.75
-0.363
2.3. Pollen + Beeswax
-0.144
3.1. Maximum 3 months -0.748
3. Honey Production Season 3.2. Approximately 6 months 0.421 34.44
3.3. 9 months and longer 0.327
4.1. Stationary beekeeping on the same land -0.993
4. Beekeeping Type 4.2. Migratory beekeeping on the same land 0.565 28.15
4.3. Migratory beekeeping on different lands 0.428
APPLIED ECOLOGY AND ENVIRONMENTAL RESEARCH 16(3):3437-3459.
http://www.aloki.hu ● ISSN 1589 1623 (Print) ● ISSN 1785 0037 (Online)
DOI: http://dx.doi.org/10.15666/aeer/1603_34373459
2018, ALÖKI Kft., Budapest, HungaryGüngör: Determination of optimum management strategy of honey production forest using A'WOT and conjoint analysis: a case
study in Turkey
- 3452 -
For the most preferred and most important "Honey Production Season" factor, the
"Honey production season being approximately 6 months" level with a utility
coefficient of 0.421 ranked first, the "Honey production season being 9 months and
longer" level with the utility coefficient of 0.327 ranked second, the “Honey production
season being maximum of 3 months” level with the utility coefficient of -0.748 ranked
third.
According to these results, participants want the honey production season to be
approximately 6 months. Bartin Province (770 mm), which in fact has a rainfall average
above the Turkey’s rainfall average (573 mm), (BMST, 2017) is also above the country
average (17%) in terms of honey plant rate (the average of Bartin Province is 23%)
(GDF, 2011). This situation provides an advantage to Bartin Province in terms of honey
production. However, when the yield level statistics per hive are examined (Table 1), it
is understood that the hive yield is below the country average.
The honey production season shorter than three months means a low income for the
beekeeper and it causes them to spend the rest of the year actively and makes it
necessary for them to deal with other works. This prevents the desired specialization in
beekeeping and causes people to consider beekeeping as a hobby (Korkmaz at all,
2015). It is possible to find the same result in other countries as well. For example,
according to data of 2010, around 76% of beekeepers in Europe see this work as a
hobby. However, around 10% does beekeeping professionally. However, in Kosovo and
Hungary, 20% or less of the beekeepers were hobbyists. In Romania, about half of all
beekeepers were hobbyists. Except for Kosovo, Greece, Romania and Spain,
professional beekeepers represented less than 10% of the total population of beekeepers
(Chauzat et al., 2013).
Although the beekeepers react positively to the fact that the honey production season
is 9 months or longer, the latter statements indicates that this will not be possible in
Bartin and its surrounding regions. Likewise, experienced beekeepers and institutional
officials stated that honey yield has decreased after the extension of season (6 months
and more), especially in the production of chestnut honey (Gungor and Ayhan, 2016).
For the "Beekeeping Type" factor, which has the second important place in the
strategy, the "Migratory beekeeping on the same land" level is the most preferred one
with a utility coefficient of 0.565. This was followed by "Migratory beekeeping on
different lands" with a coefficient of 0.428. The least preferred is the "Stationary
beekeeping on the same land" with the coefficient of -0.993. According to these results,
it is understood that the participants are more interested in migratory beekeeping than
stationary beekeeping. When the literature related to the subject is examined (GDF,
2011, 2012a, 2012b; BAKKA, 2011; BHFP, 2013; HFAP, 2013; Gungor and Ayhan,
2016; Gungor and Sen, 2018) it is understood that for the success of beekeeping, it is a
must to shift from stationary beekeeping to migratory beekeeping.
The point to be considered here is the performance of "migratory beekeeping on the
same land" activity instead of "migratory beekeeping on different lands", which is a
more comprehensive beekeeping activity, due to limited capital and labour in shifting
from stationary beekeeping to migratory beekeeping. Likewise, when considering the
rough structure of the Bartin Province and its surrounding topography (BHFP, 2013),
and the honey plant richness (Genc, 2003; Misir, 2011), different vegetation periods can
be observed even in the case of a single honey forest in the same year. For this reason, a
certain amount of accumulated capital and labour should be ensured in beekeeping first
APPLIED ECOLOGY AND ENVIRONMENTAL RESEARCH 16(3):3437-3459.
http://www.aloki.hu ● ISSN 1589 1623 (Print) ● ISSN 1785 0037 (Online)
DOI: http://dx.doi.org/10.15666/aeer/1603_34373459
2018, ALÖKI Kft., Budapest, HungaryGüngör: Determination of optimum management strategy of honey production forest using A'WOT and conjoint analysis: a case
study in Turkey
- 3453 -
and in the next stage, migratory beekeeping, which is the way of professional
beekeeping that should be adopted.
For the "Honey Type" factor, which has the third important place, the level of
"Chestnut Honey" is the most preferred one with a utility coefficient of 0.572, while the
other levels are less preferred. When looking at the market sales prices of the region for
honey, it is understood that the highest return belongs to chestnut honey (BAKKA,
2011; FAO, 2009, 2018; Gungor and Ayhan, 2016; TUIK, 2017; BAB, 2017; Gungor
and Sen, 2018). This, naturally draws the attention of the beekeepers and the
community to chestnut honey. Just like the honeydew honey in Mugla and Anzer honey
in Rize, the chestnut honey draws the attention of honey consumers and producers in
Bartin. The obtained results of the survey are also corroborative regarding the interest in
chestnut honey in Bartin. The interest for the chestnut honey in Bartin Province was
also observed in another province of Turkey. In other words, it was determined that the
consumers from Izmir knew the chestnut honey with 33.3%, citrus honey with 9.4%,
thyme honey with 21.6%, hayit honey with 11.8% and French Lavender honey with
3.9% (Baki et al., 2017). However, due to climatic conditions, the production values of
chestnut honey in the region change from year to year (TUIK, 2017). Likewise, the
average rainfall of the last 5 years (690 mm) is lower than the average of the last 50
years (770 mm) (BMST, 2017). For this reason, during the last 5 years, there have been
significant decreases in the production of chestnut honey in Bartin Province (TUIK,
2017) and many beekeepers have suffered from this (BAB, 2017). In order to avoid
experiencing this suffering, beekeepers need to enrich the honey variety taking into
account the climatic conditions and to take preventive and protective measures against
fluctuations in honey prices such as the diversity of the portfolio in the economy. Based
on what has been told, it will be appropriate to take other types of honey (linden honey,
false locust honey and rhododendron honey) into consideration in addition to chestnut
honey.
For the “Apicultural Product” factor, which ranks the last meaning the least
important one, the "Honey + Royal Jelly" level was the most preferred one and the
"Propolis + Bee Venom" level was least preferred one with a utility coefficient of 0.507.
The obtained results show that level of interest and knowledge of beekeepers and people
of the region on apicultural products is inadequate.
In another study conducted in this subject (Baki et al., 2017), it was understood that
60% of the consumers consumed pollen, 36% consumed propolis and 4% consumed the
royal jelly. However, it was determined that they did not use cream containing bee
venom for therapeutic purposes. While the consumption of cream honey, organic honey
and royal jelly was not encountered in studies conducted in previous years (Saner et al.,
2011), in this study the consumer, who consumed these products, were encountered
despite the low rate and number. Based on the formation of required consumer
awareness, increased consumption of such apicultural products depends on ensuring
healthy production and accessibility to these products in Turkey (Baki et al., 2017).
When it comes to beekeeping, the most common product coming to mind is honey.
In fact, since honey is the most profitable product among the apicultural products, the
result of this survey can be considered as natural. However, both for the sustainability
of production and in order to increase the income generated from apicultural products
and to reduce the risks, other apicultural products such as propolis and royal jelly should
also be produced and consumed in the region (Baki et al., 2017).
APPLIED ECOLOGY AND ENVIRONMENTAL RESEARCH 16(3):3437-3459.
http://www.aloki.hu ● ISSN 1589 1623 (Print) ● ISSN 1785 0037 (Online)
DOI: http://dx.doi.org/10.15666/aeer/1603_34373459
2018, ALÖKI Kft., Budapest, HungaryGüngör: Determination of optimum management strategy of honey production forest using A'WOT and conjoint analysis: a case
study in Turkey
- 3454 -
In order to ensure diversity in apicultural products, some progress has to be made in
beekeeping as well. For example, the approach of regarding beekeeping as a second
occupation or even as a hobby should be put up, specialized and qualified beekeeping
activities should be performed and the capital allocated by the beekeepers for this work
in this context should be increased (Park ve Youn, 2012). In addition, it is a must to
have extensive knowledge on beekeeping in order to obtain all of the apicultural
products. In a study conducted in Japan and South Korea (Kohsaka et al., 2017) on this
subject, it was emphasized that the combination of traditional methods of beekeeping
with modern methods would be important for beekeepers.
When the honey yield values of the World, Turkey and Bartin Province are
compared, the average annual honey yield of our country (15 kg) is considerably lower
than the world average (22 kg) (FAO, 2018). Bartin’s honey yield value (14 kg), which
is already below the world average, is also lower than the country’s average (TUIK,
2017). Hive presence of Bartin and Turkey, which is in good state when compared in
terms of the hive presence of the world, does not comply with the values obtained in
honey production and honey yield (Gungor and Ayhan, 2016). In a comparison made
for European countries, it was reported that honey yield levels and hive numbers of EU
countries are also below the world average (Chauzat et al., 2013).
On the other hand, it should also be known that the increase in crop yields of plants
provided by bees through pollination is 10-12 times (Yakovleva, 1975), even 20 times
(Crane, 1972; 1975) of the monetary value gained from apicultural products. Also, there
are many studies regarding the benefits of bees on pollination (EFSA, 2013; Goulson,
2013; IUCN, 2013, etc.). When including the economic values to be obtained indirectly
through positive externalities in the light of this information, the honey production
quantities and economic return of the HPF in Bartin Province will rise to higher levels.
Conclusions
In the research, a structure, which takes the ecological, social and economic values
into consideration and acts according to the participation principle, was taken into
consideration and A'WOT-CJA calculations were made within this scope. In the
establishment phase of HPF, the current situation is set forth by SWOT analysis,
prioritized with AHP (according to A'WOT technique) and arranged by CJA. For this
reason, the research is the first forestry study in Turkey where A'WOT-CJA are used
together.
According to the A'WOT findings obtained, Strengths (0.352) ranks first,
Opportunities (0.324) ranks second, Weaknesses (0.172) ranks third, and Threats
(0.151) ranks fourth in SWOT groups. In the development of management strategies in
the direction of A'WOT, a structure, which emphasizes Strengths and Opportunities and
dismisses Weaknesses and Threats, was adopted. According to this, the presence of
natural forests and honey plants increasing the honey yield in A'WOT, the fact that the
chestnut honey, which has a high market price and is in demand, is produced in the
region, the long honey season and the existence of production potential of apicultural
products such as pollen, beeswax and propolis including honey are the factors standing
out.
In the research, sub-levels were added to the factors found in the A'WOT result
(honey type, apicultural product, honey production season, beekeeping type) in CJA
and optimum management strategy was determined to be "In the province of Bartin,
APPLIED ECOLOGY AND ENVIRONMENTAL RESEARCH 16(3):3437-3459.
http://www.aloki.hu ● ISSN 1589 1623 (Print) ● ISSN 1785 0037 (Online)
DOI: http://dx.doi.org/10.15666/aeer/1603_34373459
2018, ALÖKI Kft., Budapest, HungaryYou can also read