DEUTSCHE BANK ACCESS CEEMEA CONFERENCE - Etalon Group
←
→
Page content transcription
If your browser does not render page correctly, please read the page content below
DEUTSCHE BANK
ACCESS CEEMEA
CONFERENCE

JANUARY 2018

                0
DISCLAIMER                                                    IMPORTANT: YOU MUST READ THE FOLLOWING
                                                              BEFORE CONTINUING

The text hereinafter contained applies to the                 of this Presentation or its contents or otherwise arising in   Such forward-looking statements are based on numerous
presentation (the “Presentation”) following this important    connection with the Presentation or undertake any duty         assumptions by management regarding present and
notice, and you are, therefore, advised to consider it        or obligation to supplement, amend, update or revise any       future business strategies and the environment operating
carefully before reading, assessing or making any other       information contained in this Presentation.                    in the future. Although the Company believes that these
use of the Presentation. In assessing the Presentation,                                                                      assumptions were reasonable when made, these
you unconditionally agree to be bound by the following        This Presentation contains certain unaudited half- and         assumptions are inherently subject to significant
terms, conditions and restrictions, including any             full- year financial information which has been prepared       uncertainties and contingencies which are difficult or
modifications to them any time that you receive any           based on the Company’s reviewed management                     impossible to predict and are beyond its control. Neither
information from ETALON GROUP PLC (“Etalon Group” or          accounts (hereinafter - Management accounts). If not           the Company, nor any of its agents, employees or
the “Company”). This Presentation has been prepared by        specifically noted otherwise, this Presentation contains       advisors undertake or have any duty or obligation to
the Company for informational purposes only and does          also certain full- and half- year financial information        supplement, amend, update or revise any of the forward-
not constitute or form part of, and should not be             based on the Company’s audited consolidated IFRS               looking statements contained in this Presentation.
construed as solicitation of any offer to subscribe for or    accounts. It also includes certain non-IFRS financial
purchase any securities of Company in any jurisdiction or     information, such as Earnings before interest, taxes,          You may download Presentation only for your own
an inducement, an offer or invitation to sell or issue, or    depreciation and amortization (“EBITDA”), EBITDA               personal use, provided that all copyright and other
any to enter into investment activity in any jurisdiction     margin, Working capital and free cash flow (“FCF”) which       proprietary notices are kept intact. You may not
and under any applicable legislation, including, but not      has not been audited or reviewed by the Company’s              otherwise copy, reproduce, republish, upload, post,
limited to the United States, the UK, any member state of     auditors.                                                      retransmit, distribute, commercially exploit or otherwise
the European Union, Australia, Canada, South Africa,                                                                         transfer the Presentation or any part of it without
Japan, Hong Kong Special Administrative Region of the         Any „forward-looking statements”, which include all            Company`s prior written consent. The burden of
People`s Republic of China.                                   statements other than statements of historical facts,          determining that use of any Information is permissible
                                                              including, without limitation, forecasts, projections and      rests with you.
This Presentation (i) is not intended to form the basis for   any statements preceded by, followed by or that include
any investment decision and (ii) does not purport to          the words „targets”, „believes”, „expects”, „aims”,            This Presentation is not directed to, or intended for
contain all the information that may be necessary or          „intends”, „will”, „may”, „anticipates”, „would”, „could” or   distribution to or use by, any person or entity that is a
desirable to evaluate the Company fully and accurately,       similar expressions or the negative thereof, involve           citizen or resident located in any locality, state, country
and (iii) is not to be considered as recommendation by        known and unknown risks, uncertainties and other               or other jurisdiction where such distribution, publication,
the Company or any of its affiliates that any person          important factors beyond the Company’s control that            availability or use would be contrary to law or regulation
(including a recipient of this Presentation) participate in   could cause the actual results, performance or                 or which would require registration of licensing within
any transaction involving the Company or its securities.      achievements to be materially different from future            such jurisdiction.
                                                              results, performance or achievements expressed or
The Company has prepared this Presentation based on           implied by such forward-looking statements. Forward-           By receiving and reading this Presentation, you agree to
information available to it as at the date of this            looking statements include statements regarding: our           be bound by the restrictions in this disclaimer, and
Presentation, including information derived from public       construction programme and future construction and             acknowledge that you will be solely responsible for your
sources that have not been independently verified. The        development projects (information concerning which is          own assessment of the market, the market position of
information contained in this document may be updated,        being provided solely on an indicative basis for               the Company and any securities of the Company and
amended or superseded by subsequent disclosures, or           information purposes only and is subject to change             that you will conduct your own analysis and be solely
may become outdated and inaccurate over time and is           without notice); strategies, outlook and growth                responsible for forming your own view of the potential
subject to change without notice. Neither the Company         prospects; future plans and potential for future growth;       future performance of the Company`s business.
nor any of its directors, officers, employees,                liquidity, capital resources and capital expenditures;
shareholders, affiliates, advisors or representatives shall   growth in demand for products; economic outlook and
have any liability whatsoever (in negligence or               industry trends; developments of markets; the impact of
otherwise) for any loss howsoever arising from any use        regulatory initiatives; and the strength of competitors.

                                                                                                                                                              ETALON GROUP             1
CONTENTS

1   AT A GLANCE 03

2   OPERATING RESULTS 10

3   MARKET OVERVIEW 24

4   FINANCIAL RESULTS 30

5   NEW MOTIVATION POLICY 37

6   SELECTED PROJECTS 40

7   APPENDIX 53

AT A GLANCE

ETALON GROUP AT A GLANCE
Etalon Group is one of Russia's largest development and construction corporations. The
Company focuses on residential real estate for the middle class in the Moscow
metropolitan area and St Petersburg.

KEY FACTS

30
YEARS
           of experience in
           construction &
           development
                                          52
                                          CITIES
                                                    in Russia are
                                                    covered by
                                                    the sales
                                                    network

5.8
           commissioned
           since inception                5   THS   employees
MLN SQM

35
           among which 21 are
           under construction or          ETLN       GDRs listed on the
                                                     London Stock
PROJECTS
           ready to launch in near        LSE ticker Exchange since 2011
           future, and a total of
           2.82 mln sqm of NSA

                                                                    AT A GLANCE   ETALON GROUP   4
STRATEGIC VERTICAL                                                                                                    ETALON OPERATES IN EVERY STAGE OF THE
                                                                                                                      PROPERTY DEVELOPMENT PROCESS, WHICH MEANS
INTEGRATION                                                                                                           CONTROL OVER COSTS, QUALITY AND TIMING

                                                                                                                                                   INDEPENDENCE
                                                                                                                                                   FROM SUPPLIERS,
                  LAND ACQUISITION AND                                                                                                             BUT ONLY
                                                                                   CONSTRUCTION MATERIALS                  (1)
                                                                                                                                                   IN CRUCIAL AREAS
                  PERMITS

                                                                             CONSTRUCTION, CONTRACTING
                  DESIGN
                                                                       ______AND COMMISSIONING

                                                                                                                                    Funding

                                                                                    TOWER CRANES                (2)
                                                                                                                                        SALES AND MARKETING
 Effective capital recycling

                                                                                                                                        ONGOING MAINTENANCE AND
                                                                                                                                        SERVICE

                                                                                                                                 UNDERSTANDING OF CUSTOMER NEEDS
  CONTROL OVER COSTS, QUALITY AND                                      BUSINESS STABILITY AND LOWER RISK                         THANKS TO NATIONWIDE SALES NETWORK
  TIMELY DELIVERY OF PROJECTS                                          OF DEPENDENCE ON COUNTERPARTIES                           (SALES NETWORK THROUGHOUT THE
                                                                                                                                 COUNTRY)

   (1)   Brick plant and concrete products plant   (2) 62   tower cranes (Liebherr and Wolff). Data as of 31.12.2017
                                                                                                                                        AT A GLANCE     ETALON GROUP   5
BOARD OF DIRECTORS REPRESENTS
INTERESTS OF ALL INVESTOR GROUPS
FOUNDING EXECUTIVE NON-EXECUTIVE INDEPENDENT NON-EXECUTIVE
SHAREHOLDERS DIRECTORS DIRECTORS DIRECTORS
DMITRY DMITRY MICHAEL BORIS CHARALAMPOS
ZARENKOV KASHINSKIY JOHN CALVEY SVETLICHNY AVGOUSTI
Chairman of the First Vice President Senior partner at Independent Non- Independent Non-
Board of Directors and COO Baring Vostok Executive Director Executive Director
EXPERIENCE AND AWARDS
EXPERIENCE AND AWARDS EXPERIENCE AND AWARDS EXPERIENCE AND AWARDS EXPERIENCE AND AWARDS
• Over 27 years of experience in finance and
• 20 years of experience in construction industry • Over 15 years of experience in construction industry • Member of the board of Europlan, Volga Gas, • 10 years of legal experience in the real estate,
senior management with international and
• Honoured builder of Russia(1); Certificate of Honour • Worked at Barkli and AFI Development (Russia), Gallery Media Group corporate and banking sectors
Russian companies
of the Ministry of Regional Development where he served as CEO • Worked at EBRD, Salomon Brothers, Sovlink • Founder and Managing Director of Ch. Avgousti &
• Recent experience included CFO position at
EDUCATION EDUCATION Corporation Partners LLC (Advocates & legal consultants)
Orange in Russia, VP for Finance at Vimpelcom
• Institute of Aeronautical Instrumentation, • Moscow Aviation Institute • Ex-Member of the board of CTC Media, Golden • Board member at Cyprus Telecommunication
and CFO at Golden Telecom
St Petersburg University of Architecture & Civil Telecom, Burren Energy Authority (CYTA), member of the Advisory council
• EDUCATION
Engineering, St Petersburg University of Internal EDUCATION of Limassol for the Central Cooperative Bank
• University of Massachusetts (BBA in Accounting),
Affairs • University of Oklahoma and London School of EDUCATION
Carnegie-Mellon University (MBA)
• PhD in Engineering Economics • Northumbria University Newcastle (LLM in
International Commercial Law), Democritus
University of Thrace
VIACHESLAV KIRILL ALEXEI MARTIN MARIOS
ZARENKOV BAGACHENKO KALININ COCKER THEODOSIOU
President, CEO Deputy CEO and Partner at Independent Non- Independent Non-
and Founding Vice President Baring Vostok Executive Director Executive Director
shareholder
EXPERIENCE AND AWARDS EXPERIENCE AND AWARDS EXPERIENCE AND AWARDS EXPERIENCE AND AWARDS EXPERIENCE AND AWARDS
• 47 years of experience in construction industry • 12 years’ experience in corporate finance and asset • With Baring Vostok since 1999 • Over 20 years of experience in audit, 7 years - • Experienced professional in marketing and strategy,
• Honoured builder of Russia(1) management • Worked at Alfa-Bank and Alfa Capital in construction industry affiliated with American Marketing Association (AMA)
EDUCATION • Previously held position of senior equity portfolio • Chairman of the Board of Directors at Volga • Runs his own development business in Portugal and Academy of International Business
• Institute of Civil Engineering, St Petersburg manager at TKB BNP Paribas Investment Partners Gas, member of the board at Samarenergo and • Worked at Deloitte & Touche, KPMG and Ernst & • Member of the Working Group on Economic Matters
University of Internal Affairs • In 2013 voted one of the top-3 portfolio managers other companies Young in Russia, Kazakhstan and UK for Cyprus talks
• PhD in Economics, PhD in Technical Sciences, in Russia by Thomson Reuters Extel Survey EDUCATION EDUCATION • In 2015 won Excellence in Global Marketing
PhD in Architecture, Professor EDUCATION • Moscow Power Engineering University • University of Keele Research Award from AMA
• St Petersburg State University of Economics • PhD in Engineering EDUCATION
and Finance • University of Cyprus; University of Wales, Cardiff
(PhD, International Marketing and Strategy)
(1) Title granted by President of Russia
AT A GLANCE ETALON GROUP 6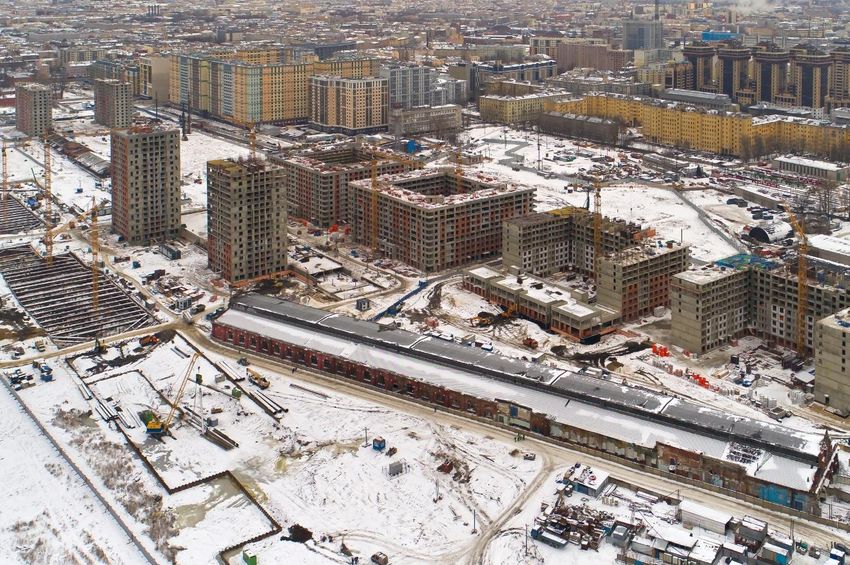
CORPORATE GOVERNANCE AND
SHAREHOLDING STRUCTURE
CORPORATE GOVERNANCE STRUCTURE                                                      SHAREHOLDER STRUCTURE(1)

GENERAL SHAREHOLDERS
MEETING                                                                                               2.2% Etalon Group
                                                                                 Baring Vostok 5.7%

BOARD OF DIRECTORS                                 BOARD COMMITTEES

 •   Chairman (D. Zarenkov)                                                    Zarenkov 30,7%
 •   3 Executive Directors                            Strategy Committee       family
 •   6 Non-Executive Directors,                                                                              61,4% Free float
     including 4 Independent
     Directors                                        Remuneration &
                                                      Nomination Committee

MANAGEMENT TEAM                                       Audit Committee

                                                      Information Disclosure
                                                      Committee

      Source:        (1) As   of 1 December 2017
      Company data                                                                           AT A GLANCE   ETALON GROUP   7
NEW SALES HAVE MORE THAN
TRIPLED IN THE 6 YEARS POST-IPO
             +30%          +30%            +27%              +32%               -12%          +35%            +6%

                                                                                                                      50,2
                                                                                                             47,4
                                                                               40
                                                                                        35,1
                                                        30,2
                                      23,7
                      18,3
     14,1

  2010              2011           2012             2013                2014           2015          2016            2017
                                                 New contract sales, bln RUB

> FY 2017 operating results set a new record in Etalon Group’s history
> New sales CAGR of 20% since pre-IPO year of 2010

    Source:
    Company data                                                                               AT A GLANCE     ETALON GROUP   8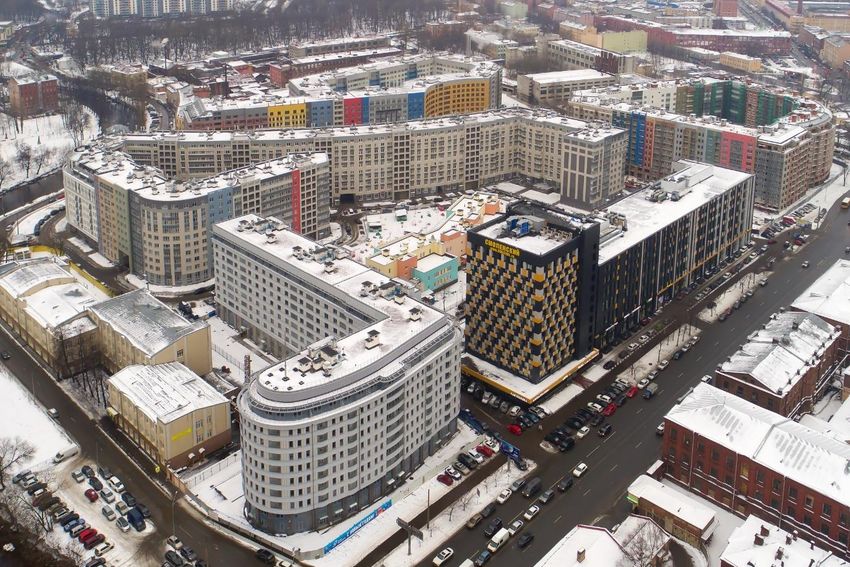
POWERFUL SALES NETWORK NATIONWIDE SALES & MARKETING
NETWORK SUPPORTS SUSTAINABLE
ACROSS THE COUNTRY CONTRACT SALES
REGIONAL POPULATION ACTIVELY BUYS ETALON GROUP’S REGIONAL
APARTMENTS IN MOSCOW AND ST SALES GEOGRAPHY(1)
PETERSBURG REGION SHARE OF TOTAL CONTRACTS
Leningrad region 2.7%
Yamalo-Nenets AD 1.6%
Khanty-Mansi AD 1.6%
Murmansk region 1.5%
Murmansk Krasnoyarskiy krai 1.4%
Monchegorsk
Apatity Khabarovskiy krai 1.4%
Arkhangelsk Elizovo
Krasnodarskiy krai 1.1%
Naryan-Mar Petropavlovsk-Kamchatsky
Severodvinsk Norilsk Yakutsk Yakutia 1.0%
Cherepovets Ukhta Mirniy Other Russian regions 24.3%
Magadan
SPMA Siktivkar
Nadim
Noviy Urengoy
Foreigners 1.2%
Gubkinsky TOTAL 37.8%
Perm
MMA
Tyumen
Khanty-Mansiysk
Surgut Kholmsk THE GROUP’S FLATS ARE SOLD IN 14 OF
Ekaterinburg
RUSSIA’S 15 MOST AFFLUENT REGIONS
Ulyanovsk Nefteyugansk
Uzhno-Sakhalinsk
Tolyatti Kamensk Uralsky Nizhnevartovsk Komsomolsk-on-Amur
Korsakov
Snezhinsk
Samara Ust-Ilimsk Blagoveshchensk REGIONAL INCOME PER CAPITA TO RUSSIA AVERAGE (2)
Krasnodar Khabarovsk
Chelyabinsk Omsk
Chita Ussuriysk Nenets AD 2.2x
Novosibirsk Irkutsk
Kemerovo Krasnoyarsk
Moscow 1.9x
Etalon Group’s sales offices / Novokuznetsk Vladivostok
Yamalo-Nenets AD 1.9x
representatives Tashtagol Chukotka 1.8x
Established relationships / Sakhalin region 1.6x
partnerships with local sales agencies Magadan region 1.5x
Khanty-Mansi AD 1.4x
Moscow region 1.3x
Kamchatskiy krai 1.3x
> Etalon Group’s sales force focuses on regions with the highest per capita income levels St Petersburg 1.3x
> Key markets: St Petersburg and MMA Yakutia 1.2x
Khabarovskiy krai 1.2x
> 52 cities covered with eight sales offices in St Petersburg and 22 more sales offices nationwide Murmansk region 1.2x
> External professional marketing and sales service agents engaged nationwide Sverdlovsk region 1.1x
Krasnodarskiy krai 1.1x
Russia average
Etalon Group’s target regions
(1) Source: Company data for 4Q 2017 (2) Average monthly cash income per capita, Rosstat’s preliminary estimates for 10M 2017
AT A GLANCE ETALON GROUP 9OPERATING RESULTS
FY 2017 OPERATING                          DELIVERIES ARE PRECISELY IN LINE
                                           WITH THE GUIDANCE FOR 2017
RESULTS
DELIVIERIES                 TRANSFERS                          2017 DELIVERIES BREAKDOWN
ths sqm                     ths sqm                            ths sqm

              +1%                     +37%                      PROJECT               NSA, ths sqm

                                                                Landyshi                        92

                                                     454        Emerald Hills                   88
     420              423
                                                                Moscow Gates                    78
                                     332
                                                                Golden Star                     77

                                                                Etalon City                     63

                                                                Samotsvety                      25

                                                                TOTAL                          423

  2016              2017      2016            2017

   Source:
   Company data                                            OPERATING RESULTS    ETALON GROUP   11
FY 2017 OPERATING 2017 OPERATING RESULTS BEAT
THE RECORDS SET IN 2016
RESULTS
NEW CONTRACT SALES NEW CONTRACT SALES CASH COLLECTIONS
ths sqm mln RUB mln RUB
+29% +3% +35% +6% +54% +16%
496 512 50 240
47 443 46,147
385 39 723
35 080
25 845
2015 2016 2017 2015 2016 2017 2015 2016 2017
> The overall number of contracts reached 9,916 in FY 2017, up 3% compared to FY 2016
Source:
Company data OPERATING RESULTS ETALON GROUP 124Q 2017 OPERATING NEW CONTRACT SALES RAMPED
UP TO RUB 16.7 BLN, +22% Y-O-Y
RESULTS
NEW CONTRACT SALES NEW CONTRACT SALES CASH COLLECTIONS
ths sqm mln RUB mln RUB
+5% +22% +32%
16,676
162
154 14 717
13 725
11 123
4Q 2016 4Q 2017 4Q 2016 4Q 2017 4Q 2016 4Q 2017
> In 4Q 2017, the overall number of contracts increased by 6% year-on-year to 3,182
Source:
Company data OPERATING RESULTS ETALON GROUP 134Q 2017 OPERATING HIGH AVERAGE DOWN-PAYMENT IN 4Q 2017
SUPPORTED HEALTHY GROWTH IN CASH
RESULTS COLLECTIONS
AVERAGE DOWN-PAYMENT AVERAGE PRICE
% RUB/sqm
115 806
114 582
82% 82% 111 382
109 390
105 928
102 869
79% 105 015
74%
71% 89 272
92 676
90 178
4Q 2016 1Q 2017 2Q 2017 3Q 2017 4Q 2017 4Q 2016 1Q 2017 2Q 2017 3Q 2017 4Q 2017
apartments total
Source:
Company data OPERATING RESULTS ETALON GROUP 14MORTGAGE CONTINUING REDUCTION IN AVERAGE MORTGAGE RATES
IS DRIVING UP THE SHARE OF MORTGAGE SALES
SALES
NUMBER OF MORTGAGE SHARE OF MORTGAGE AVERAGE MORTGAGE RATE IN
CONTRACTS SIGNED SALES 2017 YTD RUSSIA(1) 2017 YTD
+89% 41%
1,303
11,6%
35%
22% 33% 11,7%
688 11,1% 9,8%
10.1% 10%
4Q 2016 4Q 2017 1Q 2017 2Q 2017 3Q 2017 4Q 2017 Jan Apr Jul Oct Nov Dec
> Etalon Group offers various > Joint programmes established with 25 banks and special mortgage agencies to offer flexible
mortgage programmes through financing options:
major banks, including Sberbank, > minimum down payment: 10 – 20%
VTB Group, Gazprombank,
> maturity: 1 – 30 years
Raiffeisenbank and Absolut Bank
> interest rate: from 7.5%
Source: (1) Weightedaverage interest rate on mortgage loans given to Russia residents during
Company data the month for acquisition of apartments on the primary market, based on CBR data OPERATING RESULTS ETALON GROUP 15SALES GROWING SHARE OF HIGH-END PROJECTS CONTRIBUTED
TO DIVERSIFICATION OF ETALON’S SALES PORTFOLIO
PORTFOLIO AND SUPPORTED NEW SALES
4Q 2016 NEW CONTRACT SALES BY PROJECT 4Q 2017 NEW CONTRACT SALES BY PROJECT
sqm sqm
House on Obruchevykh 3%
Landyshi 3% Silver Fountain
House on Other projects 2% Normandy
Swallow’s Nest 4%
Obruchevykh 2%
Moscow Gates Other projects
Swallow’s Nest
4% 16%
Golden Star 5% 7%
7%
6%
Samotsvety
Moscow Gates 12% 6%
19% Emerald Hills 21% Emerald Hills
Tsar’s Capital 7%
Golden Star 3%
4% 9%
11%
5% Galactica
16%
Samotsvety Etalon City
8% 9% 11%
Summer Garden Galactica
Tsar’s Capital Etalon City Summer Garden
> Share of projects in prime locations increased to 65% in 4Q 2017 compared to 43% in 4Q 2016
> With 482 contracts for apartments signed in 4Q 2017, the Galactica project accounted for 16% of total contracted NSA in the last quarter
of 2017
> 38% of sales arose from regional sales network
Source:
Company data OPERATING RESULTS ETALON GROUP 16NEW PROJECT ACQUIRED IN MOSCOW IN 2017
PROJECT ON LETNIKOVSKAYA STREET
Central administrative district of Moscow The project is situated in the city centre on
Letnikovskaya Street. This is a well-
established and prestigious neighbourhood,
with modern residential and entertainment
infrastructure, as well as cultural sites, all
located nearby. The area also benefits from
its close proximity to a business district that
is home to the headquarters of several
financial institutions and international
companies. The project will have excellent
transport accessibility: Red Square is just a
10-minute drive from the project, and
Paveletskiy railway station is located at the
Krutitskaya and Derbenevskaya emb.
northern end of Letnikovskaya street.
Total NSA Planned launch Income from sales
75 ths sqm(1) 2018 RUB 15.8 bln(1) Paveletskiy railway station Business centre Paveletskaya Tower
Source: (1) Based on management estimates
Company data OPERATING RESULTS ETALON GROUP 17NEW PROJECT ACQUIRED IN ST PETERSBURG
IN 2017
BOTANICA
Petrogradskiy district of St Petersburg This new business-class project is situated on
Aptekarskiy prospekt in the prestigious
Petrogradskiy district of St Petersburg. This is a
well-established central neighbourhood, with
extensive residential, business and
entertainment infrastructure, as well as cultural
sites, all located nearby. The project is in close
proximity to the picturesque Aptekarskaya
embankment, the St Petersburg Botanical
Garden and a number of historic venues. The
project will have excellent transport access to
major transport routes, including Bolshoy
prospekt and Aptekarskaya and Vyborgskaya
The St Petersburg Botanical Garden
embankments.
Total NSA Launched Income from sales
47 ths sqm(1) October 2017 RUB 6.2 bln(1) Aptekarskaya embankment A-class business centre Lukoil City
Source: (1) Based on management estimates
Company data OPERATING RESULTS ETALON GROUP 18NEW PROJECT ACQUIRED IN ST PETERSBURG
IN 2017
PROJECT ON OBUKHOVSKOY OBORONY PROSPEKT
Nevskiy district of St Petersburg The hallmark of this new project is its direct
access to the Neva River, which will give
residents a view of the water from their
apartment windows. Two parks are also
situated nearby. The site is located in a district
with well-developed residential and transport
infrastructure. It is just a five-minute walk from
the Elizarovskaya metro station, while the
historical centre can be reached in 15 minutes
by car. Proximity to the Alexandr Nevsky,
Voldarsky and Vantoviy bridges, as well as to
Obvodny canal, provides easy access to major
transport routes.
Established green neighbourhood
Total NSA Planned launch Income from sales
76 ths sqm(1) 2018 RUB 8.1 bln(1) Vantoviy bridge Fountain park
Source: (1) Based on management estimates
Company data OPERATING RESULTS ETALON GROUP 19NEW PROJECT ACQUIRED IN ST PETERSBURG
IN 2017
PROJECT ON PETROVSKIY ISLAND
Petrogradskiy district of St Petersburg The project will be built in one of the most
prestigious locations in St Petersburg. It
benefits from direct access to a long
embankment and close proximity to parks,
which will provide for excellent views of the
Neva river and green areas. Various recreation
areas, including a yacht club, upscale
restaurants, Petrovskiy Park and parks on
Krestovskiy Island, as well as stadiums and
sports facilities, are located nearby. Krestovskiy
island is just 10-minute walk from the complex
and the city center can be reached by car in 15
minutes.
Yacht club
Total NSA Planned launch Income from sales
77 ths sqm(1) 2018 RUB 11 bln(1) Krestovskiy stadium Krestovskiy park
Source: (1) Based on management estimates
Company data OPERATING RESULTS ETALON GROUP 20LAND BANK WITH NEW ACQUISITIONS AND GAINS ON EXISTING
PROJECTS, ETALON’S LAND BANK REMAINS SUFFICIENT
DEVELOPMENTS FOR EXECUTION OF THE GROUP’S STRATEGY
UNSOLD NSA
ths sqm
2 819
2,738
512
160
271
2582
31 DECEMBER NSA CONTRACTED NSA ACQUIRED NSA GAINS ON 31 DECEMBER
2016 IN 2017 IN 2017 EXISTING PORTFOLIO 2017
Source:
Company data OPERATING RESULTS ETALON GROUP 21MAINTAINING STRONG BALANCE SHEET
STRONG LIQUIDITY POSITION NET DEBT BALANCED GROSS DEBT
mln RUB mln RUB COMPOSITION(2)
23 988 Local
bonds
42%
19 024
58%
14 276 Bank
loans
9 565 9 459 9 712
> 100% of debt denominated in RUB
> Average cost of borrowings declined from 12.71% at
the end of 2016 to 10.29% at the end of FY 2017
> In September, Etalon Group subsidiary Etalon
LenSpetsSMU placed bonds in the amount of
30.06.2017 31.12.2017 30.06.2017 31.12.2017 RUB 5 bln with a five-year term and a coupon rate
of 8.95%, which is the lowest ever in Etalon Group’s
Total debt Cash and cash equivalents(1) history of public borrowings. Demand exceeded the
offering amount by 4.8 times
Source: (1) Including bank deposits in ST Investments (2) As of 31.12.2017
Company data OPERATING RESULTS ETALON GROUP 22GUIDANCE SOLID GROWTH EXPECTED ACROSS KEY
OPERATING METRICS IN 2018
FOR 2018
DELIVERIES NEW CONTRACT SALES NEW CONTRACT SALES CASH COLLECTIONS
ths sqm ths sqm mln RUB mln RUB
+13% +7% +13% +15%
57 000
550 53 000
512 50,240
480 46,147
423
2017 2018F 2017 2018F 2017 2018F 2017 2018F
Source:
Company data OPERATING RESULTS ETALON GROUP 23MARKET OVERVIEW
SUPPLY AND DEMAND
FACTORS AFFECTING SUPPLY FACTORS AFFECTING DEMAND
Renovation programme in Moscow Decrease in real disposable income in recent years
> Positive impact in the short term due to > Moderately negative impact in the short term
decreasing supply of apartments from the state- due to a downswing in consumer confidence;
owned “Administration for Civil Engineering” (all however impact is partially offset by rapid growth of
apartments available on the open market will be used real income recorded up to 2014
in the next 3 years for relocation purposes under the Significant decrease in mortgage rates
renovation programme), and moderate impact
expected in the long term > Considerable positive impact due to increasingly
Amendments to Law 214 regulating residential accessible mortgages for income groups who
previously could not afford mortgage payments. Up to
development industry 1.5 mln new households within Etalon Group’s target
> Considerable positive impact in the long term due markets who could not afford mortgage financing
to withdrawal of smaller players who do not comply with now will be able to buy housing, with interest rates
the requirements of the amended law 214 declining to 7%(1)
Further industry consolidation among top Macro recovery and subsequent real
industry players disposable income growth
> Positive impact due to decreasing supply triggered > Macro recovery and growth of real disposable income
by market consolidation among top players and is likely to provide further stimulus for
withdrawal of smaller developers who do not comply potential buyers of residential real estate
with the requirements of the amended law 214
(1) Source:
MACON Realty Group estimates based on Rosstat income distribution data, saving rates, households
consumption patterns; AHML data; MinEc data and other open sources MARKET OVERVIEW ETALON GROUP 25RENOVATION PROGRAMME
RENOVATION PROGRAMME(1) BENEFITS FOR REAL ESTATE DEVELOPERS
> Over 5,000 buildings are already included in the > Lack of completed housing stock for the first
programme stage of renovation means that the city
authorities might be forced to buy from existing
> Over RUB 3,500 bln is expected to be spent within the supply, in addition to apartments belonging to
next 15 years to implement the whole programme the “Administration for Civil Engineering”,
resulting in reduction of current supply
> Construction of new housing stock in the first 7-8 years for
relocation purposes only, without admitting private
developers to the programme > In case of supportive measures from city council
and willingness to admit private companies to
> In the first three years, Moscow authorities are planning to renovation, the top players will have the option
spend RUB 300 bln on the renovation programme to participate in the programme rather than buy
plots from private landlords, resulting in lower
> For relocation at the first stage of the programme, Moscow land acquisition costs
authorities plan to use 250 ths sqm of apartments
belonging to the “Administration for Civil Engineering” > Assuming the current pace of financing by
that were previously due to be sold on the open market Moscow authorities, implementation of the
programme may take over 30 years
> The renovation programme has a social focus, and the intent
is to implement it in such a way that there is no negative
effect on the market > On the back of the renovation programme,
customers have shifted interest from the
> Height restrictions of 9-14 floors for newly constructed secondary market to the primary market, which
complexes has resulted in a short-term boost in demand
(1) Based
on information available at mos.ru, and from the interview with Deputy Mayor of Moscow
M. Khusnullin published in Vedomosti on 9 August 2017 MARKET OVERVIEW ETALON GROUP 26FEDERAL LAW 214 FINANCIAL AND OPERATING EXCELLENCE CREATE
AN OPPORTUNITY TO CAPITALISE ON INDUSTRY
CONSOLIDATION
AMENDMENTS TO FEDERAL LAW 214
ENHANCED REQUIREMENTS TO CAPITAL SUFFICIENCY AND USE OF FUNDS
Changes Relevance for Etalon BENEFITS FOR TOP PLAYERS:
> Compensation fund contribution equal to 1.2% of
value of equity participation contract Unlike small players, Etalon’s strong balance sheet
enables the Company to easily comply with new
> Major developers with
> Own funds worth 10% of the entire project must
be deposited in a mandated bank before being requirements sustainable cash positions
able to raise funds through equity participation have less potential
agreements exposure to negative
> Developer’s borrowing activities are limited to Additional financing needs can be met through effects of the
housing construction activities only borrowings from a parent company, including bank loans, amendments, creating
> No bonds, only equity issuance allowed
or debt securities that can be issued either by a parent conditions for further
company or affiliated companies industry consolidation
> Advances associated with design and construction
Current values for Etalon Group companies are in line
are limited to 30% of total project value > Land owners may be
with the new requirements of the amended law
> SG&A to be capped at 10% of construction costs forced to sell plots, as their
ENHANCED TRANSPARENCY REQUIREMENTS ability to raise capital and
Changes Relevance for Etalon undertake development
> Audited annual financial reporting activities is doubtful.
Established IFRS reporting system and semi-annual audit
> Disclosure of interim unaudited financial results This will further ease
ENHANCED TRACK RECORD REQUIREMENTS competition and
Changes Relevance for Etalon potentially make
> Developer must have at least a 3-year track
30 years of experience
attractive new projects
record, and a minimum of 10 ths sqm of area
Over 5.5 mln sqm commissioned available for sale and
commissioned even with more appealing
OTHER REQUIREMENTS price
Changes Relevance for Etalon
> Developer may undertake only one construction Establishing SPEs to enable simultaneous implementation
project approved by authorities at a time of projects
MARKET OVERVIEW ETALON GROUP 27RESIDENTIAL REAL ESTATE ETALON IS WELL-POSITIONED
TO GROW MARKET SHARE IN
SUPPLY CORE MARKETS
TOTAL SUPPLY IN ST PETERSBURG AND MMA(1)
38% 34% 41% 48% 55%
TOP 20 in total supply
3.4% 2.0% 4.5% 5.0% 8.9%
Etalon Group share
in total supply
11,9
10,8 10,0 10,7 9,9 Total supply
estimates, mln sqm
2012 2013 2014 2015 2016
Source: (1) Moscow, New Moscow and Moscow region within 30 km from Moscow Ring Road
Knight Frank, IRN, Company data MARKET OVERVIEW ETALON GROUP 28RESIDENTIAL REAL ESTATE ETALON GROUP REMAINS
FOCUSED ON THE SEGMENTS
DEMAND WITH HIGHEST DEMAND
RESIDENTIAL REAL ESTATE DEMAND BREAKDOWN ETALON GROUP SEGMENTS
Low volume due
to low demand
63% ELITE
of the demand linked
to Etalon Group BUSINESS CLASS
segments
COMFORT CLASS
UPPER ECONOMY CLASS
Low margin due
LOWER-ECONOMY to low price
Source: MACON Realty Group estimates based on Rosstat income distribution data, saving rates, households consumption patterns;
AHML data; MinEc data and other open sources MARKET OVERVIEW ETALON GROUP 29FINANCIAL RESULTS
1H 2017 RESIDENTIAL                                                        GROWTH IN DELIVERIES COUPLED
                                                                           WITH SALES OF COMPLETED REAL
DEVELOPMENT SEGMENT                                                        ESTATE ENABLED STRONG
                                                                           REVENUE RECOGNITION
ANALYSIS
DELIVERIES                                   TRANSFERS                           RESIDENTIAL REAL ESTATE
ths sqm                                      ths sqm                             DEVELOPMENT REVENUE
                                                                                 mln RUB
                +14%                                     +48%                                  +39%

                                      108                            191                               16,409
         94
                                                                                      11,828
                                                    129

  1H 2016                    1H 2017           1H 2016          1H 2017             1H 2016           1H 2017

   Source:
   Company data, IFRS financial statements                                     FINANCIAL RESULTS   ETALON GROUP   31
1H 2017 REVENUE CONSOLIDATED REVENUE INCREASED
BY 22% Y-O-Y TO RUB 24.2 BLN
ANALYSIS
CONSTRUCTION SERVICES OTHER REVENUE EXTERNAL(1) TOTAL REVENUE
REVENUE FROM THIRD PARTIES mln RUB mln RUB
mln RUB
-23% +29% +22%
4 812 4 016 24,151
3 726 19,742
3 102
1H 2016 1H 2017 1H 2016 1H 2017 1H 2016 1H 2017
Source: (1) Including revenue from selling construction materials, maintenance services, etc.
IFRS financial statements FINANCIAL RESULTS ETALON GROUP 32PROFITABILITY HEALTHY PROFITABILITY
LEVELS MAINTAINED
ANALYSIS
RESIDENTIAL REAL ESTATE CONSTRUCTION SERVICES CONSOLIDATED ADJUSTED
DEVELOPMENT ADJUSTED GROSS PROFIT GROSS PROFIT(1)
GROSS PROFIT(1)
+27% -19% +22%
5 557
5 341 401 4 565
4 200 326
8% 9%
36% 33% 23% 23%
1H 2016 1H 2017 1H 2016 1H 2017 1H 2016 1H 2017
Adjusted gross Gross profit Gross profit, Gross profit Adjusted gross Gross profit
profit, mln RUB margin, % mln RUB margin, % profit, mln RUB margin, %
Source: (1) Adjusted for interest in cost of sales
IFRS financial statements FINANCIAL RESULTS ETALON GROUP 33SELLING, GENERAL AND STRICT COST CONTROLS
KEPT SG&A AND OTHER
ADMINISTRATIVE EXPENSES EXPENSES NEARLY FLAT
GENERAL AND SELLING EXPENSES OTHER EXPENSES
ADMINISTRATIVE EXPENSES
1 168
1 958 1 990
918 495
319
10%
8% 5% 5% 3%
1%
1H 2016 1H 2017 1H 2016 1H 2017 1H 2016 1H 2017
G&A, G&A Selling expenses, Selling expenses Other expenses, Other expenses
mln RUB as % of revenue mln RUB as % of revenue mln RUB as % of revenue
Source:
IFRS financial statements FINANCIAL RESULTS ETALON GROUP 34EBITDA AND NET EBITDA INCREASED BY 33% Y-O-Y,
WITH EBITDA MARGIN UP BY 80 BPS
INCOME ANALYSIS
EBITDA EBITDA MARGIN NET INCOME
mln RUB % mln RUB
+33% +0.8p.p. -7%
2,288 1 308
1,214
1 715
9.5%
8.7%
1H 2016 1H 2017 1H 2016 1H 2017 1H 2016 1H 2017
Source:
IFRS financial statements FINANCIAL RESULTS ETALON GROUP 35OPERATING CASH FLOW SLIGHTLY NEGATIVE CASH FLOW
IN 1H 2017 DUE TO ACQUISITION
ANALYSIS OF TWO HIGH-END PROJECTS
IN MOSCOW AND ST PETERSBURG
OPERATING CASH FLOW(1) HIGHT-END PROJECTS ACQUIRED IN 1H 2017
PROJECT ON LETNIKOVSKAYA PROJECT ON APTEKARSKIY
STREET PROSPEKT
86 122 Location: Moscow Location: St Petersburg
Total NSA: 75 ths sqm Total NSA: 47 ths sqm
4 108 Income from sales: Income from sales:
RUB 15.8 bln(2) RUB 6.2 bln(2)
Planned launch: 2018 Launched: October 2017
The project is situated in the city centre on This new business class project is in the prestigious
Letnikovskaya Street. This is a well-established and Petrogradskiy district of St Petersburg. This is a
prestigious neighbourhood, with modern residential well-established central neighbourhood, with
and entertainment infrastructure, as well as extensive residential, business and entertainment
cultural sites, all located nearby. The area also infrastructure. The project is in close proximity to
benefits from its close proximity to a business the picturesque Aptekarskaya embankment, the
district that is home to the headquarters of several St Petersburg Botanical Garden and a number of
-1 108 financial institutions and international companies. historic venues.
The project will have excellent transport The project will have excellent transport access to
1H 2016 1H 2017
accessibility: Red Square is just a 10-minute drive. major transport routes, including Bolshoy prospekt,
Aptekarskaya and Vyborgskaya embankments.
Operating cash flow(1), New acquisitions,
mln RUB ths sqm
Source: (1) Operating cash flow less interest paid (2) Based on management estimates
IFRS financial statements FINANCIAL RESULTS ETALON GROUP 36NEW MOTIVATION POLICY
NEW MOTIVATION PROGRAMME
ETALON GROUP’S NEW MOTIVATION POLICY AIMS TO:
Encourage development Align interests of shareholders and
breakthroughs in accordance with management through long-term GDR
Etalon Group’s new strategy based incentive programme tied to
net profit and market capitalisation,
and will be a key part of overall top
management remuneration packages
Shift focus from operating to financial Strengthen motivation to achieve
KPIs (net income, dividends and targets by decreasing fixed part and
market capitalisation) increasing variable part tied to KPIs
NEW MOTIVATION POLICY ETALON GROUP 38TOP MANAGEMENT KPIs BALANCED REMUNERATION
SYSTEM WITH A FOCUS ON
FINANCIAL PERFORMANCE
KPI WEIGHTING FORM OF REMUNERATION
GDR PRICE GROWTH
PAYMENTS IN GDRs
WITH VESTING
PERIOD
NET PROFIT
DIVIDEND PAYMENTS PAYMENTS
IN CASH
CASH COLLECTIONS
DELIVERIES
NEW MOTIVATION POLICY ETALON GROUP 39SELECTED PROJECTS
GALACTICA
JANUARY 2018 DECEMBER 2016
Total NSA Open Market Value(1) Income from sales(1) St Petersburg
841 ths sqm RUB 15,174 mln RUB 69,618 mln
(1) JLL estimate as of 31.12.2016
SELECTED PROJECTS ETALON GROUP 41MOSCOW GATES
JANUARY 2018 DECEMBER 2016
Total NSA Open Market Value(1) Income from sales(1) St Petersburg
235 ths sqm RUB 8,004 mln RUB 21,642 mln
(1) JLL estimate as of 31.12.2016
SELECTED PROJECTS ETALON GROUP 42SAMOTSVETY
JANUARY 2018 DECEMBER 2016
Total NSA Open Market Value(1) Income from sales(1) St Petersburg
213 ths sqm RUB 5,903 mln RUB 18,252 mln
(1) JLL estimate as of 31.12.2016
SELECTED PROJECTS ETALON GROUP 43LANDYSHI
JANUARY 2018 DECEMBER 2016
Total NSA Open Market Value(1) Income from sales(1) St Petersburg
92 ths sqm RUB 1,806 mln RUB 7,551 mln
(1) JLL estimate as of 31.12.2016
SELECTED PROJECTS ETALON GROUP 44HOUSE ON OBRUCHEVYKH STREET
JANUARY 2018 DECEMBER 2016
Total NSA Open Market Value(1) Income from sales(1) St Petersburg
42 ths sqm RUB 1,949 mln RUB 5,153 mln
(1) JLL estimate as of 31.12.2016
SELECTED PROJECTS ETALON GROUP 45FUSION
JANUARY 2018 VISUALISATION
Total NSA Open Market Value(1) Income from sales(1) St Petersburg
14 ths sqm RUB 719 mln RUB 1,800 mln
(1) JLL estimate as of 31.12.2016
SELECTED PROJECTS ETALON GROUP 46EMERALD HILLS
JANUARY 2018 DECEMBER 2016
Total NSA Open Market Value(1) Income from sales(1) Moscow region
856 ths sqm RUB 18,415 mln RUB 65,149 mln
(1) JLL estimate as of 31.12.2016
SELECTED PROJECTS ETALON GROUP 47ETALON CITY
JANUARY 2018 DECEMBER 2016
Total NSA Open Market Value(1) Income from sales(1) Moscow
365 ths sqm RUB 7,512 mln RUB 27,827 mln
(1) JLL estimate as of 31.12.2016
SELECTED PROJECTS ETALON GROUP 48SUMMER GARDEN
JANUARY 2018 DECEMBER 2016
Total NSA Open Market Value(1) Income from sales(1) Moscow
283 ths sqm RUB 6,880 mln RUB 29,328 mln
(1) JLL estimate as of 31.12.2016
SELECTED PROJECTS ETALON GROUP 49GOLDEN STAR
JANUARY 2018 DECEMBER 2016
Total NSA Open Market Value(1) Income from sales(1) Moscow
85 ths sqm RUB 3,005 mln RUB 10,054 mln
(1) JLL estimate as of 31.12.2016
SELECTED PROJECTS ETALON GROUP 50NORMANDY
JANUARY 2018 VISUALISATION
Total NSA Open Market Value(1) Income from sales(1) Moscow
92 ths sqm RUB 3,727 mln RUB 10,221 mln
(1) JLL estimate as of 31.12.2016
SELECTED PROJECTS ETALON GROUP 51SILVER FOUNTAIN
JANUARY 2018 VISUALISATION
Total NSA Open Market Value(1) Income from sales(1) Moscow
183 ths sqm RUB 9,573 mln RUB 25,085 mln
(1) JLL estimate as of 31.12.2016
SELECTED PROJECTS ETALON GROUP 52APPENDIX
AT A GLANCE
PRESENCE IN RUSSIA’S LARGEST LIQUIDITY AND CREDIT
                             RATINGS                                                                                                                 LSE ticker                ETLN:LI
MARKETS
                                            > Secure liquidity position supported                                                                    Current share price       3.19 (17.01.2018)
> Focus on middle class residential real
  estate in Moscow metropolitan area (MMA)    by pre-sales cash collections model                                                                    Market Capitalisation     USD 932 mln
  and St Petersburg metropolitan area       > Low leverage: 1.2x net debt / LTM
  (SPMA)                                      EBITDA(3)                                                                                              Portfolio valuation       RUB 115,818 mln
> 11% CAGR for deliveries over 2010-2017 > Credit rating by S&P: B+/B(4)
                                        (1)
                                                                                                                                                     (by JLL)(2)               (31.12.2016)

STRONG DELIVERY TRACK                                                      CORPORATE GOVERNANCE
RECORD                                                                     > 10 BoD members, 7 NEDs                                                  PORTFOLIO COMPOSITION(2)
> Over 30 years of construction &                                          > Board of Directors consists of
   development experience                                                    professionals with broad range of
                                                                                                                                                                                 completed
> 5.8 mln sqm commissioned                                                   experience and expertise, ensuring that
                                                                                                                                                                                   projects
                                                                             the interests of all groups of shareholders                              MMA              projects at
TRUE VERTICAL INTEGRATION                                                    are appropriately represented                                                             design stage
                                                                           > Monthly visual updates on projects,                                                                    11%
> Strategic vertical integration in key value-
  added segments of property development                                     quarterly trading updates and semi-
                                                                             annual financial reporting                                                49%       51%            30%
  enables the Company to control costs,                                                                                                                                                       59%
  quality and timing                                                       > Official guidance on deliveries and new
> 5 ths employees                                                            contract sales
                                                                                                                                                                                             under
                                                                           > Dividend policy aims to pay out 40% to                                               SPMA
> Country-wide sales network covering 52                                                                                                                                               development
  cities                                                                     70% of IFRS net profit semi-annually

DIVERSIFIED PROJECTS
PORTFOLIO
> Land bank of 2.82 mln sqm(2)
> Land bank sufficient until 2021
> Projects well diversified by locations within
   both SPMA and MMA
      (1) Company         (2) JLL
                                land bank valuation   (3) IFRSfinancial statements   (4) 'B+'
                                                                                            long-term & ‘B’ short-term corporate credit ratings of
      operating results   report as of 31.12.2016     for 6M ended 30.06.2017        Etalon LenSpetsSMU (last reconfirmed on 05.07.2017)                      APPENDIX        ETALON GROUP           54
STRATEGIC VERTICAL ETALON OPERATES AT EVERY STAGE OF THE
DEVELOPMENT PROCESS, WHICH MEANS
INTEGRATION CONTROL OVER COSTS, QUALITY AND TIMING
INDEPENDENCE
FROM SUPPLIERS,
LAND ACQUISITION AND BUT ONLY
CONSTRUCTION MATERIALS (1)
IN CRUCIAL AREAS
PERMITS
CONSTRUCTION, CONTRACTING
DESIGN
______AND COMMISSIONING
Funding
TOWER CRANES (2)
SALES AND MARKETING
Effective capital recycling
ONGOING MAINTENANCE AND
SERVICE
UNDERSTANDING OF CUSTOMER NEEDS
CONTROL OVER COSTS, QUALITY AND BUSINESS STABILITY AND LOWER RISK THANKS TO NATIONWIDE SALES NETWORK
TIMELY DELIVERY OF PROJECTS OF DEPENDENCE ON COUNTERPARTIES (SALES NETWORK THROUGHOUT THE
COUNTRY)
(1) Brick plant and concrete products plant (2) 62 tower cranes (Liebherr and Wolff). Data as of 31.12.2017
APPENDIX ETALON GROUP 55RESIDENTIAL DEVELOPMENT SCHEME
TOTAL DEVELOPMENT PERIOD RANGE: 39-59 MONTHS
TIMING 3-5 years 12-18 months 18-30 months 1-2 months 3 months
STAGES OF Investment Construction
State
RESIDENTIAL Zoning & initial commission Ownership
contract, planning Sales after
permit rights
REAL ESTATE documentation
& construction registration
commissioning
DEVELOPMENT permit Pre-sale
PERMISSION High Medium-low
permission permission risk
RISK risk
VS.
PROJECT Low entry Medium entry
price price
VALUE For share participation agreements when the For 100% payment when sale-
construction is completed and the building purchase agreement is signed
REVENUE has been approved by the State commission
For less than 100% payment
RECOGNITION for acceptance of finished buildings
when preliminary agreement
For share accumulation agreements when and act of acceptance is
the building has been approved by the State signed by client
commission for acceptance of finished
buildings and act of acceptance is signed by
share accumulation cooperative
ETALON GROUP FOCUS
Source:
Company data APPENDIX ETALON GROUP 56TYPICAL PROJECT COST STRUCTURE
MATERIALS COST STRUCTURE(1) CONSTRUCTION COST STRUCTURE(1) TOTAL COST STRUCTURE(1)
RUB 12,000-18,000 per sqm of NSA RUB 29,000-39,000 per sqm of NSA RUB 59,000-72,000 per sqm of NSA
Sand 2% Machinery Other 1%
Bricks 3% Project management 2%
Crushed granite
5% Design
VAT accrued 5% Interest expense
8% 16%
Other
6%
49% Materials 43% Construction 8% Sales costs
15% Cement 56%
17% Wages 8% Infrastructure
23% 19% 14%
Metal products Overhead expenses(2) Land acquisition
TYPICAL PROJECT LIFECYCLE CONSTRUCTION TIMELINE, MONTHS
0 5 10 15 20 25 30 ∑ share
CONSTRUCTION STAGE
Predevelopment 8 months 3% 3%
Zero cycle works 10 months 7% 10%
Construction works 20 months 43% 53%
Facade works 10 months 11% 64%
Fit out works 10 months 5% 69%
MEP systems 21 months 14% 83%
Engineering facilities 23 months 15% 98%
Urban landscaping 6 months 2% 100%
(1) Source:
Company estimates for typical project based on current portfolio average. (2) Including payroll tax
Actual breakdown per project is subject to significant variation due to a number of factors. APPENDIX ETALON GROUP 57INDUSTRIAL
CONSTRUCTION PROJECTS
NISSAN PLANT EXPOFORUM ZVEZDA-REDUKTOR
2012-2014 2011-2015 2015-2016
• Etalon Group is a long-time partner of Nissan • The largest commercial construction project in • Overhaul of production lines and the renovation
in Russia, having acted as the general St Petersburg in recent years of administrative and service buildings for Zvezda-
contractor for design and construction of the • Overall size of the complex is over 200 ths sqm Reduktor, a subsidiary of Zvezda, Russia’s largest
test track and new car storage areas in 2008 • 2 main exhibition halls, 3 exhibition pavilions, 2 manufacturer of compact, high-RPM Diesel
• In 2014 Etalon Group delivered 66 ths sqm of hotels, 3 helicopter pads, parking and utilities engines
new factory space, including expansion of infrastructure • Contract covers a total area of 9,854 sqm
existing assembly lines, warehouse and office • Capacity for up to 10 ths delegates
facilities
FORD MOTOR COMPANY UNIPRES STATE HERMITAGE MUSEUM
2007-2012 2014-2016 2015-2018(1)
• General contractor agreement for the
Expansion of existing production facilities, construction of a 12,313 sqm manufacturing • Construction of part of the Restoration and
including a 25 ths sqm logistics area for finished facility and a 3,588 sqm administrative building Storage Centre of the State Hermitage Museum
goods, renovation of warehouse and overhaul • Turnkey project involving the full construction in St Petersburg
of utility systems cycle • Contract is worth RUB 1.6 billion
(1) Expected date of completion
APPENDIX ETALON GROUP 58INCOME STATEMENT
MLN RUB 2014 2015 2016 1H 2015 1H 2016 1H 2017
Revenue 51,481 42,404 49,022 18,148 19,742 24,151
Cost of sales (35,685) (29,405) (36,813) (12,584) (15,685) (19,296)
Gross profit 15,796 12,999 12,209 5,564 4,057 4,855
General and administrative expenses (4,178) (4,348) (4,454) (2,021) (1,958) (1,990)
Selling expenses (1,474) (1,411) (1,984) (619) (918) (1,168)
Other expenses, net (913) (991) (753) (341) (495) (319)
Results from operating activities 9,231 6,249 5,018 2,583 686 1,378
Finance income 1,717 1,686 1,857 998 891 760
Finance costs (553) (504) (319) (593) (152) (397)
Net finance income 1,164 1,182 1,538 405 739 363
Profit before income tax 10,395 7,431 6,556 2,988 1,425 1,741
Income tax expense (2,026) (2,002) (1,654) (795) (117) (527)
Profit for the period 8,369 5,429 4,902 2,193 1,308 1,214
Profit attributable to:
Owners of the Company 8,345 5,399 4,902 2,188 1,307 1,210
Non-controlling interest 24 30 - 5 1 4
Profit for the period 8,369 5,429 4,902 2,193 1,308 1,214
Source:
IFRS financial statements for 1H15, 1H16, 1H17, 2014, 2015, 2016
APPENDIX ETALON GROUP 59BALANCE SHEET
MLN RUB 2014 2015 2016 1H 2015 1H 2016 1H 2017
ASSETS
Non-current assets
PP&E 2,503 2,479 2,889 2,349 2,433 2,927
Investment property 808 538 561 618 482 354
Other long-term investments 1,036 578 545 684 556 630
Trade and other receivables 2,521 3,303 5,063 2,164 3,801 5,633
Deferred tax assets 885 1,159 1,414 1,040 1,412 1,617
Other non-current assets 10 5 - 10 2 -
TOTAL NON-CURRENT ASSETS 7,763 8,062 10,472 6,865 8,686 11,161
Current assets
Inventories 57,525 67,722 71,261 61,131 69,237 77,924
Trade and other receivables 15,075 18,227 21,409 15,926 20,340 26,468
Short-term investments 1,221 733 793 2,122 830 754
Cash and cash equivalents 14,631 11,532 10,206 10,042 15,770 9,392
Other current assets 66 7 - 66 7 -
TOTAL CURRENT ASSETS 88,517 98,221 103,669 89,287 106,184 114,538
TOTAL ASSETS 96,280 106,283 114,141 96,152 114,870 125,699
EQUITY AND LIABILITIES
Equity
Share capital 14,983 14,999 15,070 14,983 14,999 14,603
Retained earnings 36,537 39,697 43,052 37,011 40,068 44,263
TOTAL EQUITY ATTRIBUTABLE TO EQUITY HOLDERS OF THE COMPANY 51,520 54,696 58,122 51,994 55,067 58,866
Non-controlling interest 351 147 28 170 83 -
TOTAL EQUITY 51,871 54,843 58,150 52,164 55,150 58,866
Non-current liabilities
Loans and borrowings 12,411 13,138 12,415 13,375 12,950 14,973
Trade and other payables 2,854 923 859 4,024 610 3,270
Provision 114 117 107 112 109 99
Deferred tax liabilities 1,456 1,810 1,557 1,249 1,096 1,173
TOTAL NON-CURRENT LIABILITIES 16,835 15,988 14,938 18,760 14,765 19,515
Current liabilities
Loans and borrowings 3,880 6,276 5,639 5,141 8,720 4,051
Trade and other payables 21,460 25,630 33,666 18,451 34,375 41,773
Provisions 2,234 3,546 1,748 1,636 1,860 1,494
TOTAL CURRENT LIABILITIES 27,574 35,452 41,053 25,228 44,955 47,318
TOTAL EQUITY AND LIABILITIES 96,280 106,283 114,141 96,152 114,870 125,699
Source:
IFRS financial statements for 1H15, 1H16, 1H17, 2014, 2015, 2016
APPENDIX ETALON GROUP 60CASHFLOW STATEMENT
MLN RUB 2014 2015 2016 1H 2015 1H 2016 1H 2017
OPERATING ACTIVITIES
Profit for the period 8,369 5,429 4,902 2,193 1,308 1,214
Adjustments for:
Depreciation 417 406 434 213 240 172
Loss/(gain) on disposal of PP&E (52) (65) (52) 20 (7) (51)
Gain on disposal of investment property - - (267) - - (27)
Impairment gain/(loss) on investment property 280 215 (41) 166 27 -
Impairment loss on inventories 466 514 430 30 290 312
Finance income, net (1,164) (1,182) (1,538) (405) (739) (363)
Income tax expense 2,026 2,002 1,654 795 117 527
CASH FROM OPERATING ACTIVITIES BEFORE CHANGES IN WORKING CAPITAL 10,342 7,319 5,522 3,012 1,236 1,784
Change in inventories (6,890) (8,255) (1,780) (2,418) (502) (3,884)
Change in accounts receivables (1,427) (3,899) (3,746) (366) (2,381) (5,831)
Change in accounts payable 1,184 2,369 7,812 (1,461) 8,519 8,175
Change in provisions 594 1,315 (1,808) (600) (1,694) (262)
Change in other current assets (59) - - - - -
Income tax paid (1,645) (2,146) (1,960) (1,605) (1,070) (1,090)
Interest paid (1,588) (2,516) (2,603) (1,180) (1,278) (1,094)
NET CASH FROM/(USED IN) OPERATING ACTIVITIES 511 (5,813) 1,437 (4,618) 2,830 (2,202)
INVESTING ACTIVITIES
Proceeds from disposal of non-current assets 66 188 93 29 45 221
Proceeds from disposal of investment property - - - - - 224
Interest received 823 1,311 1,153 802 580 410
Acquisition of PP&E (653) (369) (711) (95) (218) (365)
Loans given (178) (123) (435) (4) (41) (27)
Loans repaid 174 66 25 21 18 317
Disposal of subsidiaries, net of cash disposed of 7 - - (3) (1) -
(Acquisition)/disposal of other investments 3,038 1,155 242 (598) (113) (337)
NET CASH FROM /(USED IN) INVESTING ACTIVITIES 3,277 2,228 367 152 270 443
FINANCING ACTIVITIES
Acquisition of non-controlling interest (83) (20) (94) (66) (38) (30)
Proceeds from borrowings 10,763 9,480 9,016 4,707 5,882 4,671
Repayments of borrowings (8,498) (6,281) (10,404) (2,323) (3,635) (3,678)
Acquisition of own shares 16 16 - - - -
Dividends paid (1,124) (2,452) (1,504) (1,834) (961) -
NET CASH FROM/(USED IN) FINANCING ACTIVITIES 1,074 743 (2,986) 484 1,248 963
Net increase/(decrease) in cash and cash equivalents 4,862 (2,842) (1,182) (3,982) 4,348 (796)
Effect of FX rate fluctuations 1,630 (257) (144) (607) (110) (18)
Cash & cash equivalents at the end of the period 14,631 11,532 10,206 10,042 15,770 9,392
Source:
IFRS financial statements for 1H15, 1H16, 1H17, 2014, 2015, 2016
APPENDIX ETALON GROUP 61EBITDA CALCULATION
MLN RUB 2014 2015 2016 1H 2015 1H 2016 1H 2017
Comprehensive income 8,369 5,429 4,902 2,193 1,308 1,214
Income tax expense 2,026 2,002 1,654 795 117 527
Interest expense on loans and finance lease 295 19 12 15 6 2
Net foreign exchange loss - 138 78 438 51 22
Interest income on bank deposits (729) (1,089) (839) (686) (437) (278)
Interest income on loans and receivables (94) (222) (314) (116) (143) (132)
Net foreign exchange gain (814) - - - - -
Bank fees and commissions 117 95 133 49 65 59
Interest in cost of sales 1,024 897 1,241 272 508 702
DEPRECIATION: 417 406 434 213 240 172
Depreciation in cost of goods sold (Note 13 PP&E) 271 284 321 167 183 132
Depreciation to selling expenses (Note 13 PP& E) 4 6 4 3 2 4
Depreciation to general and administrative expenses (Note 13 PP&E) 94 63 62 19 29 26
Depreciation to investment property (Note 14 Investment property) 48 48 42 24 24 10
Depreciation to other non-current assets - 5 5 - 2 -
EBITDA 10,611 7,675 7,301 3,173 1,715 2,288
Source:
IFRS financial statements for 1H15, 1H16, 1H17, 2014, 2015, 2016
APPENDIX ETALON GROUP 62WORKING CAPITAL CALCULATION
MLN RUB 2014 2015 2016 1H 2015 1H 2016 1H 2017
Total inventory 57,525 67,722 71,261 61,131 69,237 77,924
CURRENT PART
+Trade and other receivables 15,074 18,227 21,409 15,926 20,340 26,468
- Trade and other payables 21,460 25,630 33,666 18,451 34,375 41,773
- Provisions 2,234 3,546 1,748 1,636 1,860 1,494
NON-CURRENT PART
+Trade and other receivables 2,521 3,303 5,063 2,164 3,801 5,633
- Trade and other payables 2,854 923 859 4,024 610 3,270
- Provisions 114 117 107 112 109 99
ADJUSTMENTS
- Cumulative borrowing costs capitalised during the period (Note 11 Finance income and finance costs) 5,416 7,977 10,602 6,636 9,278 11,686
+ Cumulative borrowing costs that have been included into the cost of sales (Note 11 Finance income
2,313 3,210 4,451 2,585 3,718 5,153
and finance costs)
- Income tax receivable (Note 18 Trade and other receivables) 159 358 412 467 302 235
+ Income tax payable (Note 25 Trade and other payables) 380 125 399 10 100 246
WORKING CAPITAL 45,576 54,036 55,189 50,490 50,662 56,867
Source:
IFRS financial statements for 1H15, 1H16, 1H17, 2014, 2015, 2016
APPENDIX ETALON GROUP 63FCF CALCULATION
MLN RUB 2014 2015 2016 1H 2015 2H 2015 1H 2016 2H 2016 1H 2017
Comprehensive income 8,369 5,429 4,902 2,193 3,236 1,308 3,594 1,214
ADJUSTMENTS FOR
Depreciation 417 406 434 213 193 240 194 172
Loss/(gain) on disposable PP&E (52) (65) (52) 20 (85) (7) (45) (51)
Gain on disposal of investment property - - - - - - - (27)
Impairment loss on investment property 280 215 (41) 166 49 27 (68) -
Impairment loss on inventory 466 514 430 30 484 290 140 312
Loss on disposal of subsidiaries - - - - - - - -
Finance income, net (1,164) (1,182) (1,538) (405) (777) (739) (799) (363)
Income tax expense 2,026 2,002 1,654 795 1,207 117 1,537 527
Income tax paid (1,645) (2,146) (1,960) (1,605) (541) (1,070) (890) (1,090)
Interest paid (1,588) (2,516) (2,603) (1,180) (1,336) (1,278) (1,325) (1,094)
(Increase)/decrease in working capital: (6,598) (8,470) 478 (4,845) (3,625) 3,942 (3,462) (1,802)
Change in inventories (6,890) (8,255) (1,780) (2,418) (5,837) (502) (1,278) (3,884)
Change in accounts receivable (1,427) (3,958) (3,746) (366) (3,592) (2,381) (1,365) (5,831)
Change in accounts payable 1,184 2,369 7,812 (1,461) 3,830 8,519 (705) 8,175
Change in provisions 594 1,315 (1,808) (600) 1,915 (1,694) (114) (262)
Change in other current assets (59) 59 - - 59 - - -
(Increase)/decrease in invested capital based on CF statement: (587) (181) (618) (66) (115) (173) (445) 80
Acquisition of PP&E (653) (369) (711) (95) (274) (218) (493) (365)
Proceeds from disposal of non-current assets 66 188 93 29 159 45 48 445
FCF (76) (5,994) 1,086 (4,684) (1,310) 2,657 (1,569) (2,122)
Source:
IFRS financial statements for 1H15, 1H16, 1H17, 2014, 2015, 2016
APPENDIX ETALON GROUP 64DEUTSCHE BANK ACCESS
CEEMEA CONFERENCE
ETALON GROUP PLC
2-4 CAPITAL CENTRE
ARCH. MAKARIOU III AVENUE
NICOSIA | CYPRUS
TEL: +44 (0)20 8123 1328
FAX: +44 (0)20 8123 1328
EMAIL: INFO@ETALONGROUP.COMYou can also read