Deutsche Post DHL Group - Investor Relations March 2018

Page created by Craig Wise
 
CONTINUE READING
Deutsche Post DHL Group - Investor Relations March 2018
Deutsche Post DHL Group
Investor Relations
March 2018
Deutsche Post DHL Group - Investor Relations March 2018
Q4/FY 2017 HIGHLIGHTS

Group EBIT, in EUR m                                                   2020: >EUR 5bn                Delivering steady profitable growth
                                                                (8% CAGR 2013-20 + IFRS 16 effect)
5,000                                                                                                 Strong organic growth across all divisions, reflecting structural
4,500                                                                                                  e-commerce trend as well as macroeconomic acceleration
                                                                                     ~4,150           2017 Group EBIT increase of 7.2%, delivering on guidance
4,000
                                                                          3,741                       EBIT growth drives strong Cash Flow generation, allowing to
3,500                                                                                                  balance growth investments and rising shareholder returns
3,000

2,500                                                                                                Unique global footprint and investing for further growth

2,000                                                                                                 Unique global capabilities to leverage growth in e-commerce
                                                                                                       logistics
1,500
                                                                                                      Further potential to optimize divisional profitability – esp. in DGFF
1,000
                                                                                                      Continued investments into capacity, speed and technology
        2008
               2009
                      2010
                             2011
                                    2012
                                           2013
                                                  2014
                                                         2015
                                                                2016
                                                                       2017
                                                                              2018
                                                                                     2019
                                                                                            2020

                                                                                                       support sustainable growth path

          EUR 1.15 dividend proposed (+9.5%) – 2020 Group EBIT guidance confirmed incl. adjustment for IFRS16 effect

INVESTOR RELATIONS PRESENTATION | MARCH 2018                                                                                                                            PAGE 2
Deutsche Post DHL Group - Investor Relations March 2018
SUMMARY 2017 KEY FINANCIALS

Delivering steady profit and cash flow growth

 EUR m                                       FY 2017
                                                               Change,            Change,              Topline growth accelerated, and once more
                                                                EUR m               % yoy              translated into stronger EBIT growth

 Revenue                                       60,444             +3,110             +5.4%             Profit growth driving further improvement in
                                                                                                       operating and free cash flow generation
 EBIT                                            3,741              +250             +7.2%

 OCF 1)                                          3,297              +353           +10.3%
                                                                                                       Strong FCF increase also reflects swing in net
                                                                                                       M&A (2016: UK Mail acquisition; 2017:
 FCF
      1)
                                                 1,927              +483           +33.4%
                                                                                                       Williams Lea Tag disposal) while growth
                                                                                                       investments increased
1) FY17 and 2016 comparison adjusted for pension fundings of EUR 1bn in Q2/16 and EUR 0.5bn in Q4/17

             Delivering sustainable performance improvement across all metrics year by year

INVESTOR RELATIONS PRESENTATION | MARCH 2018                                                                                                      PAGE 3
Deutsche Post DHL Group - Investor Relations March 2018
PeP: EBIT HISTORY AND OUTLOOK

 2017 PeP EBIT: EUR 1.502bn
 PeP revenue & EBIT,
 in EUR m

20,000
20,000                        Parcel Revenue           Post Revenue        PeP EBIT           EBIT guidance, EUR:          2,200

                                                                                                                           2,000
15,000                                                                                                           2020:
                                                                                                                ~ 1.7 bn   1,800
                                                                                               2018:
10,000                                                                                        ~ 1.5 bn                     1,600

                                                                                                                           1,400
 5,000
                                                                                                                           1,200

     0                                                                                                                     1,000
           2008        2009    2010    2011     2012      2013    2014   2015   2016   2017     2018     2019     2020

           Since 2012 low point, EBIT up EUR >400m, all while investing in Parcel expansion

 INVESTOR RELATIONS PRESENTATION | MARCH 2018                                                                              PAGE 4
Deutsche Post DHL Group - Investor Relations March 2018
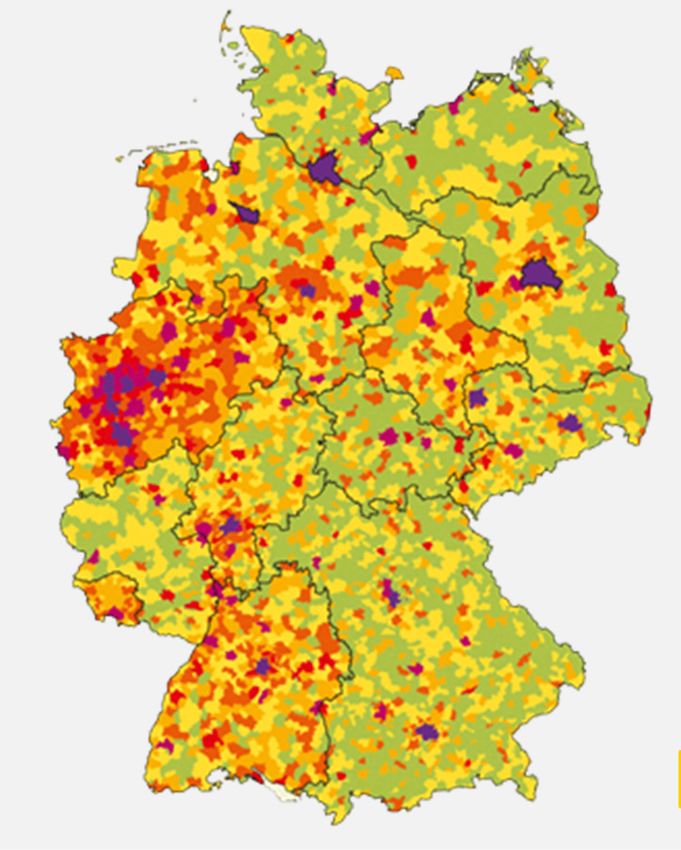
DHL EXPRESS: NEW MARKET STUDY CONFIRMS SHARE GAINS IN ALL REGIONS

Continued TDI leadership across all regions outside the Americas

                                 Americas [EUR 8.2bn ]   Europe [EUR 7.1bn]           Asia Pacific [EUR 8.0bn]
Deutsche Post DHL Group - Investor Relations March 2018
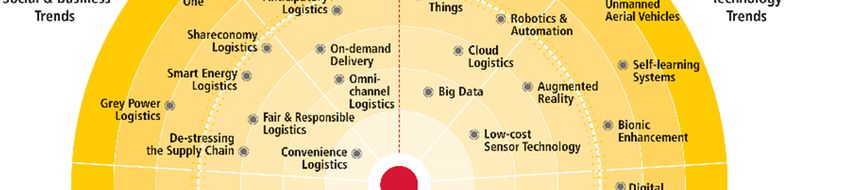
DGFF: PERFORMANCE STARTS TURNING AS 2017 SHOWED
PROGRESS IN MANY IMPORTANT AREAS

  DGF Gross Profit conversion and EBIT margin

           17.1%             16.9%
                                                                                              Volume trends pick up and
                                             10.3%                    9.7%         8.6%       rate development gradually
                                                       5.1%
           3.9%              3.9%
                                             2.3%
                                                      1.2%
                                                                      2.4%         2.0%       normalizing
            2012              2013           2014      2015           2016         2017
                           GP-to-EBIT conversion               EBIT margin                    New IT system (IRR) completed
 2015 EBIT adjusted for EUR -353m one-offs                                                    pilot and entered into roll-out
                                                                                              phase
  DGF Gross Profit conversion, quarterly progression

                                                                                              New divisional CEO onboard
          Q1                           Q2                 Q3                      Q4
                                                                                              with strong sector experience
                                                                                  12% 13%
           9%                           9%                10% 9%
                                             8%      7%                      8%
                   5%
    3%                           3%

   2015 2016 2017               2015 2016 2017       2015 2016 2017          2015 2016 2017

 2015 Quarterly EBIT adjusted for one-offs

INVESTOR RELATIONS PRESENTATION | MARCH 2018                                                                               PAGE 6
Deutsche Post DHL Group - Investor Relations March 2018
SUPPLY CHAIN: INVESTING IN GROWTH AND EFFICIENCY

  New signings, EUR bn1)                           New signings by sector, FY 2017                       Business Highlights
                                              Engineering & Manufacturing               Consumer          EUR 1.5bn order intake again at record levels
         1.5                   1.5                          Others
                                                                           12%      17%
                                                                     6%
                                                                                                          Williams Lea Tag disposal reflects focus on our core
                                                 Life Sciences
                                                 & Healthcare       6%                                     supply chain services
                                                                                                           • Q4: no significant EBIT effect, FCF EUR +286m
                                                                                          25%
                                                       Technology
                                                                     16%                        Retail     • 2018 revenue reduced by EUR ~1.1bn with low-mid
       2016                  2017                                                                            double-digit million EBIT impact
                                                                              18%
1) Annualized revenue 2016 incl. WLT; 2017 excl. WLT                       Automotive

  Creating the DSC Digital Warehouse Vision                                                              Digital Warehouse

                                                                                                          Digitalization showing high cost saving potential through
                                                                                                           software automation of back-office processes (Robot
                                                                                                           Process Automation)
                                                                                                          Good progress in integrating warehouse solutions, e.g.
                                                                                                           piece picking robots
                                                                                                          Leveraging the technical experience towards a clear
                                                                                                           digital business vision
2) Automated guided vehicles for Very Narrow Aisles
INVESTOR RELATIONS PRESENTATION | MARCH 2018                                                                                                                     PAGE 7
Deutsche Post DHL Group - Investor Relations March 2018
CONSISTENT STRONG CASH GENERATION

In EUR m                           FCF             Dividend payment                            2017 FCF generation supported by
                                                                                         1)
                                                                                 1,927
                                                                                                Williams Lea Tag disposal proceeds
                                                   1,724                                        (EUR 286m)
    1,669
                                                                         1)                    Strong FCF generation nonwithstanding
                                                                   1,444         1,432
                           1,345                                                                sustained investments in growth with net
                                                                                     1,270      capex spend up to EUR 2.0bn (+EUR
                                                           1,030         1,027
                                                                                                266m)
                                    968
             846                                                                               Sustainable FCF as basis for attractive
                                                                                                shareholders returns:
                                                                                                 -   FY2017 dividend proposal of EUR
                                                                                                     1.15 (+9.5%)
                                                                   444
                                                                                                 -   Further excess liquidity generation
                                                                                                     as FCF consistently exceeds
                                                                                                     dividend payment since 2013
        2013                    2014                   2015          2016          2017

1) Adjusted for pension funding (2016: 1bn, 2017: 0.5bn)

INVESTOR RELATIONS PRESENTATION | MARCH 2018                                                                                               PAGE 8
Deutsche Post DHL Group - Investor Relations March 2018
DPDHL GROUP FINANCE POLICY: CONFIRMED AND EXECUTED UPON

   FINANCE POLICY                                      Dividend proposal of EUR 1.15 for FY2017

                                                                                                                                         € 1.15
    Target / maintain rating BBB+                                                                                               €1.05
                                                Underlying Payout          Ratio1)
    Dividend payout ratio to remain                                                    €0.80
                                                                                                      €0.85         €0.85
     between 40–60% of net profit              €0.65        €0.70         €0.70
     (continuity and Cash Flow
     performance considered)                   59%           58%           53%            49%          50%             46%       48%     52%      60%
    Excess liquidity will be used for                                                                                                            40%
     share buybacks and/or                     2010          2011         2012           2013           2014          2015       2016    2017
     extraordinary dividends
     and/or                                    Expected dividend payments of EUR ~1.4bn to
     potential additional pension
     funding (if not by other means)           DPDHL shareholders on April 27, 2018

                                               1) Adjusted for Postbank effects as well as non-recurring items when applicable

INVESTOR RELATIONS PRESENTATION | MARCH 2018                                                                                                 PAGE 9
Deutsche Post DHL Group - Investor Relations March 2018
2018 & 2020 GUIDANCE

  EBIT,                                                               Previous 2020 guidance
                    2018 (incl. IFRS 16)       2020 (incl. IFRS 16)
  EUR bn                                                                 (before IFRS 16)

  PeP                       ~1.5                      ~1.7             ~ 3% CAGR 2013-20

  DHL                       ~3.0                      ~3.7             ~ 10% CAGR 2013-20

  CC/Other                ~ -0.35                    ~ -0.35          < 0.5% of group revenue

  Group                    ~4.15                      >5.0             > 8% CAGR 2013-20

 FY 2018:
 Free Cash Flow: > EUR 1.5bn
 Tax rate: ~18%
 Gross Capex (excl. leases): ~ EUR 2.5bn

INVESTOR RELATIONS PRESENTATION | MARCH 2018                                                    PAGE 10
CONCLUSION

 2017 has been another very successful year for DPDHL Group

 Growth path confirmed with operating profit increase delivering on expectations
 Strong cash generation allows increases in growth investments as well as shareholder return
 Further strengthened our unique position to drive profitable growth, notably in e-commerce

 Long-term strategic goals intact and consistently delivered upon:
         Leverage growth in e-commerce and emerging markets, based on unrivalled,
         diversified business portfolio

         Clear roadmap for margin improvements in all divisions

         Solid balance sheet and increasing cash generation support shareholder return strategy

INVESTOR RELATIONS PRESENTATION | MARCH 2018                                                PAGE 11
DPDHL INVESTMENT PROFILE

Global Powerhouse of Logistics                    Clear Strategic Direction        Sustainable Growth Momentum
                                               Our roadmap for margin and profit   Unique position for e-commerce
                                                        improvement

 Increasing Margins and Returns                     Investing for Growth            Delivering Attractive Returns
    Divisional self-help agendas                Innovation, quality & customer      Committed to FCF growth and
                                                           centricity               improving shareholder returns

INVESTOR RELATIONS PRESENTATION | MARCH 2018                                                                  PAGE 12
Divisional Information

INVESTOR RELATIONS PRESENTATION | MARCH 2018      PAGE 13
DPDHL GROUP AT A GLANCE

                                             Network businesses – asset intensive                Brokerage & Outsourcing – asset light

                         Divisions
                                        Post - eCommerce-                                    Global Forwarding
                         -EUR m -                                        Express                                         Supply Chain
                                               Parcel                                             Freight

 2017
                         Revenue                18.168                    15.049                    14.482                   14.152
 Group revenues
 € 60.4bn                EBIT                    1.502                    1.736                       297                      555
                         Margin                  8.3%                     11.5%                      2.1%                     3.9%
 EBIT
 € 3.741bn               Staff (FTE)            179.600                   86.313                    42.646                   149.042

                                        USO Provider for letter   Core product Tide-        Brokerage of transport   Customized,
 Market                  Products                                                           services in Air, Ocean   outsourced logistics
                                        products in Germany.      Definite International
 capitalization                         Parcel operations in      (TDI): premium cross-     and Road freight         solutions through full
 € 49bn per                             Germany, Europe and       border parcels and                                 value chain
 31.12.2017                             selected international    document delivery
                                        markets

                         Geographies    Germany - Europe          220 countries and         >150 countries and       >50 countries and
                                        Americas -Asia Pacific    territories               territories              territories
 Approximately
 500,000 employees                      61% letter mail           34% global market         # 1 in air freight       #1 globally
                         Market Share                                                       # 2 in ocean freight     6.2% market share
 in more than 220                       Germany                   share
                                        45% parcel Germany        # 1 Europe, MiddleEast,
 countries/territories                                            Africa and Asia, # 3 US

INVESTOR RELATIONS PRESENTATION | MARCH 2018                                                                                          PAGE 14
CONTINUOUS MARGIN IMPROVEMENT REMAINS TOP PRIORITY ON
DIVISIONAL AGENDAS

Further potential to optimize divisional profitability – esp. in DGFF

              Asset intensive: Express and PeP                                          +                    Asset light: DGFF and DSC
 EBIT                                                                                       EBIT
 Margin1)                                                                                   margin1)

                                                                                11.5%                                                      3.9%
   8.1%
                                                                                8.3%
                                                                                              2.7%
   4.4%                                                                                                                                    2.1%
                                                                                              1.8%

          Q4 2010                                                       Q4 2017                        Q4 2010                           Q4 2017
                                  PeP             Express                                                             DSC     DGFF

 1) Rolling 12 month EBIT margins, DGFF adjusted for NFE write-off in Q3 2015

            Group margin of 6.2% is up +260bp since 2010; +100bp since 2013
INVESTOR RELATIONS PRESENTATION | MARCH 2018                                                                                                 PAGE 15
DISRUPTION IS EVERYWHERE: INNOVATION IS THE SOLUTION

DHL Trend - Radar

        In order to stay ahead of the curve, we have to think in a creative way and not be
        afraid to self-disrupt
INVESTOR RELATIONS PRESENTATION | MARCH 2018                                             PAGE 16
Focus. Connect. Grow.

                              POST, E-COMMERCE & PARCEL

INVESTOR RELATIONS PRESENTATION | MARCH 2018                           PAGE 17
PeP: PARCEL GROWTH CONTINUES TO OUTWEIGH MAIL DECLINE

 Mail Communication revenue      Dialogue Marketing revenue           Business Highlights
EUR m                           EUR m
             -1.3%                                                    • Ongoing, gradual shift towards Parcel and eCommerce
            Q4: -0.7%
                                                 +4.3%                                2010                                      2017
    6,527               6,439                   Q4: +7.9%
                                                                          20%                                             46%
                                     2,225                  2,320

                                                                                                                                          54%
   FY 2016          FY 2017         FY 2016             FY 2017                                    80%
   Parcel Germany revenue           Parcel Germany volumes
                                                                                 Post revenue                        Parcel and eCommerce revenue

             +4.3%                                                    • Letter volume per working day (WD) increased by 1.5% in
EUR m                           m units
            Q4: +4.4%                                                   Q4 driven by Dialogue Marketing - resulting in almost flat
                                                 +7.8%                  full-year at +0.7% with support of elections:
    4,814               5,022                   Q4: +7.1%

                                        1,227                1,323       Volume yoy                       Q4 17  Q4/WD            2017 2017/WD
                                                                         Mail Communication                -6.0%   -3.1%           -4.6%  -3.5%
                                                                         Dialogue Marketing                +2.6%   +5.8%           +3.5%  +4.7%
   FY 2016          FY 2017         FY 2016                 FY 2017
                                                                         Letter volume1)                   -1.6%   +1.5%           -0.5%  +0.7%

                                                                        1) Mail Communication & Dialogue Marketing
INVESTOR RELATIONS PRESENTATION | MARCH 2018                                                                                                PAGE 18
PeP: ENLARGING OUR E-COMMERCE FOOTPRINT

 Parcel Europe revenue                     DHL eCommerce revenue        Continued expansion into international parcel markets
 EUR m          +65.4%             EUR m                                Parcel Europe: European coverage expanded to 26
              Q4: +66.9%                             +10.3%             countries, including Germany, thereof
                                                    Q4: +4.5%
                                                                        - 2 greenfield countries (AT, SK)
                           1,882            1,385               1,528
      1,138
                                                                        - 7 internal asset shifts (NL, BE, PL, CZ, SE, ES, PT)

    FY 2016            FY 2017             FY 2016          FY 2017
                                                                        - 2 acquisitions (GB: UK Mail, FR: Relais Colis stake)
 Parcel Europe, EBIT margin by country                                  - 14 countries with Parcel Union cooperations
                                                                         Strong 2017 revenue increase: +18.3% adjusted for first
 8%                                                                       time UK Mail contribution (EUR 536m)
                                                                         Margin potential: mid-to-high single digit EBIT margin
 5%
                                                                        DHL eCommerce: PeP capabilities outside Europe
 0%
                                                                         Excluding FX effects, FY17 revenue up 13.1%, Q4 +13.9%
                                                                         Good US domestic and cross-border business from Asia
                                                                         E-fulfilment network further expanded
       Countries: AT, CZ, ES/PT, NL, PL, SK, SE, GB

INVESTOR RELATIONS PRESENTATION | MARCH 2018                                                                                     PAGE 19
PeP – DIVISIONAL RESULTS Q4 2017

EUR m                     Q4 2016    Q4 2017     Chg.   Management comments
                                                        Continued Parcel growth in Germany, Europe and DHL eCommerce drives
Revenue                      4,710     5,052   +7.3%    strong peak season for PeP with Post revenue also up by 2.1%. PeP
                                                        organic increase of +4.9%

                                                        Good Parcel peak season combined with stable Post revenue and slight
EBIT PeP                       490       510   +4.1%
                                                        positive contribution from International in the quarter

   t/o Germany                 496       503   +1.4%    German EBIT only slightly up as peak season also comes with higher costs
   t/o International
                                -6         7   >100%    International Parcel expansion progressing to plan
   eCommerce - Parcel

Operating Cash Flow            602       858   +42.5%   OCF increase supported by timing effects

Capex                          265       320   +20.8%   Increase primarily driven by investments into German parcel infrastructure

INVESTOR RELATIONS PRESENTATION | MARCH 2018                                                                                   PAGE 20
PeP: DHL Parcel Germany maintains sustainable growth momentum

DHL Parcel Germany, volume growth, yoy                            DHL Parcel Germany, market share development
                                                                      +6pp
   9.8%   9.8%                        9.3%
                               8.7%
                 7.4%   7.0%                 7.8%                 39%     45%

                          market growth expectation: 5-7%                                                                     20%

                                                                  2010    2017           Comp 1   Comp 2   Comp 3   Comp 4
   2011   2012   2013   2014   2015   2016   2017

   High delivery convenience…                                    …enabled by efficient, automated network
  • Broad choice of recipient services for consumers: doorstep   • ~85% next day delivery & ~98% second day delivery
    delivery, Parcel lockers (Packstation), Click & Collect
    (Parcel shops), Private Parcel box (Paketkasten)             • 34 fully automated parcel sorting centers, with average
                                                                   sorting capacity of ~30,000/hour
  • Highest density of customer access points for delivery &
    returns                                                      • >240 local delivery depots and >75 mechanized depots

  • ~5.3m parcels per working day in 2017                        • Capacity increased by >50% versus 2012

          Leading service proposition translates into sustained increase in volume and market share
INVESTOR RELATIONS PRESENTATION | MARCH 2018                                                                                 PAGE 21
MINIMIZING IMPACT OF CONTINUOUS MAIL DECLINE:
COST FLEXIBILITY IS THE KEY OBJECTIVE

 Joint Delivery helps to optimize delivery of                             Revenue mix shift also reflected in delivery
 declining mail volumes                                                   staff development

                                   ~50% of Parcel                               93,400               103,700         Delivery workforce
                                                                                            +8,000
                                    deliveries done                                                                   Headcount, t/o
                                    through joint delivery                                  +5,400

                                    with mail                                                                          Dedicated Parcel
                                                                                             -3,100                    Joint Delivery

                                          Joint Delivery of                                                            Mail Delivery
                                          Parcels and Mail                         2010                2016

                                          Dedicated Mail or
                                                                           Increase in dedicated Parcel and joint delivery drives
                                          Parcel Delivery
                                                                            net hiring since 2010, as a result of strong Parcel growth
                                                                           New wage structure provides competitive basis for
                                   Population density, increasing order     sustainable growth in Parcel Germany

         Mail volume decline is a given, so our focus is on compensating measures in order to minimize
         the impact and allow Parcel to drive PeP growth
INVESTOR RELATIONS PRESENTATION | MARCH 2018                                                                                       PAGE 22
DHL eCOMMERCE: OUR PRODUCTS AND NETWORKS

 DHL eCommerce capabilities based on three core pillars

                                                          Global, multi-site eFulfillment
                                                          Current network:
                                                          • US, Mexico, India, Hong Kong, Australia,
                                                            Germany

Domestic B2C delivery                                               International day-definite
and returns                                                         delivery and returns
• Current network:                                                  • Currently servicing 220 countries
      • US, Chile                                                     from 11 origin countries (US,
                                                                      Canada, Mexico, Hong Kong,
      • India, Thailand, Malaysia,
                                                                      Singapore, China, India, Australia,
        Vietnam
                                                                      Japan, Malaysia,Thailand)

INVESTOR RELATIONS PRESENTATION | MARCH 2018                                                       PAGE 23
EXPANDING OUR INTERNATIONAL E-COMMERCE FOOTPRINT

 Selected domestic assets combined with global cross-border delivery and vendor-neutral eFulfillment
                                                         Parcel Europe
                                                  One Parcel network for Europe

   Domestic Delivery &
   Cross-Border
   Cross-Border Origin
   Multi-user, vendor-neutral
   eFulfillment facilities
                                                         DHL eCommerce
   In-bound/Out-bound Sorting
                                               Selective, expanding footprint in the
   Distribution Center/Central Hub                 Americas and Asia-Pacific

          Quick and selective international expansion of e-commerce logistics – in and outside of Europe
INVESTOR RELATIONS PRESENTATION | MARCH 2018                                                       PAGE 24
PEP: CONTINUOUS INNOVATION ALONG THE WHOLE VALUE CHAIN,
DRIVING STRUCTURAL E-COMMERCE GROWTH

                                               Network orchestration
                                               (e.g. routing, data analytics)    Sustainable
   Production / sorting                                                          delivery
      (e.g. 50k/hour ; MechZB)
                                                                                 (e.g. Streetscooter)

                                                      e-commerce
                                                         growth

  Penetration of
                                                                                 Last mile
  new business fields
  (e.g. grocery marketplace &
                                                                                 automation
  delivery)                                        Recipient solutions           (e.g. Postbot)
                                                (e.g. trunk delivery, DHL4ALL)
INVESTOR RELATIONS PRESENTATION | MARCH 2018                                                       PAGE 25
Focus. Connect. Grow.

                                                  EXPRESS

INVESTOR RELATIONS PRESENTATION | MARCH 2018                           PAGE 26
EXPRESS: CONTINUED STRONG TDI PERFORMANCE

 Time Definite International (TDI), revenue per day, in EUR m1)                           Business Highlights

                                                                                           TDI volume growth continues strongly with all regions
                                                                                            contributing
                +15.1%                                         +12.9%

       45.7                   52.6                   41.9                   47.3          DHL Express, TDI volume growth, yoy
                                                                                                                                        Q4 17    FY 17
                                                                                            27.4%
                                                                                                    23.7%
                                                                                                            17.6% 14.3%
    Q4 2016                Q4 2017                 FY 2016                FY 2017                                         12.5% 12.8%
                                                                                                                                         5.3%   3.6%

 Time Definite International (TDI), shipments per day, ‘000s
                                                                                               MEA          Americas        Europe      Asia Pacific

                                                                                           Revenue growing stronger than shipments due to higher
                +11.1%                                          +9.9%                       fuel surcharge and active yield management: revenue/kg
       880                    978                     808                    888
                                                                                            increase driven by General Price Increase, portfolio
                                                                                            optimization and ship-to-profile measures
                                                                                           Volume growth, yield management and scale efficiencies
    Q4 2016                Q4 2017                 FY 2016                FY 2017
                                                                                            drive continued EBIT and EBIT margin improvement
1) Currency translation impacts are eliminated. Data aggregated with same currency rate

INVESTOR RELATIONS PRESENTATION | MARCH 2018                                                                                                     PAGE 27
EXPRESS – DIVISIONAL RESULTS Q4 2017

 EUR m            Q4 2016     Q4 2017          Chg.   Management comments

                                                      Strong TDI volume increase (+11.1%), yield management and higher fuel surcharge
 Revenue             3,759       4,059    +8.0%
                                                      drive organic growth to 15.2% excl. adverse FX effects

                                                      Volume growth, yield performance across all verticals and efficiencies in air network
 EBIT                 434         499    +15.0%
                                                      costs drive EBIT growth above revenue increase: margin up 80bp to 12.3%

 Operating                                            Flat due to timing effects and more balanced steering of year-end cash management,
                      728         723      -0.7%
 Cash Flow                                            full-year OCF up 14.7%

 Capex                279         605    +>100%       High Q4 number reflects planned aircraft purchases

INVESTOR RELATIONS PRESENTATION | MARCH 2018                                                                                         PAGE 28
EXPRESS: FOR OUR INTERNATIONAL NETWORK, X-BORDER B2C
IS A PROFITABLE GROWTH DRIVER

 Portion of B2C TDI shipments has increased                                             We grow B2C profitably because 90% of the KPIs
 over time                                                                              perfectly suit our network
                                     1)
                           >10%                                                    1)                  Volume growth drives better utilization
                                                                                >23%      SpD
                                                                                                       of existing network

                                                                                          WpS          Lower weight per shipment

                                                                                          RpK          Higher RpK related to lower WpS

                 2013                                                    2017             First mile   More pieces per stop at pickup

 Our TDI product is attractive to e-tailers because we offer…                                          Better utilization of existing infrastructure,
                                                                                          Hub sort
  Unparalleled global door-to-door network                                                            with high degree of conveyables
  Fast customs clearance                                                                              Better utilization of existing capacity,
                                                                                          Airlift
  Flexible delivery options                                                                           with lower WpS being advantageous
  Highest service quality & customer service                                             Last mile    Residential delivery to private households
 1) Indications based on medium to large B2C customers of top 30 countries

             X-Border e-commerce has developed into an important TDI vertical and profitable growth driver
INVESTOR RELATIONS PRESENTATION | MARCH 2018                                                                                                            PAGE 29
EXPRESS GROWTH SUPPORTED BY BALANCED GLOBAL FOOTPRINT

 Quarterly growth ranking, TDI volume growth

#1   EU    EU      MEA      AM    AP    AP      MEA      EU    MEA   EU          EU   EU    EU    AM          AM   EU    EU    MEA MEA MEA                  Consistent strong
                                                                                                                                                             volume growth in
     AP    MEA         AP   AP    MEA   AM          AM   MEA   EU    MEA MEA          AP    AM    EU          EU   AM    MEA   EU          AM    AM          global TDI network
#2
                                                                                                                                                            Constant variation
     MEA   AP          AM   EU    AM    MEA     AP       AP    AP    AP          AP   MEA   AP    AP      MEA MEA        AM    AM          EU    EU
#3                                                                                                                                                           in regional patterns
                                                                                                                                                             reflects movements
     AM    AM          EU   MEA   EU    EU          EU   AM    AM    AM          AM   AM    MEA MEA           AP   AP    AP    AP          AP    AP
#4                                                                                                                                                           in global trade flows

                                                                                      821         820              880   824   890       863     978
     615   647     618      693   662   700     661      748   709   760     723            764           771

     Q1    Q2          Q3   Q4    Q1    Q2          Q3   Q4    Q1    Q2          Q3   Q4    Q1    Q2          Q3   Q4    Q1    Q2          Q3    Q4
                2013                         2014                         2015                         2016                         2017

            +8.4%                        +7.8%                        +8.7%                        +7.4%                        +9.9%

             TDI Shipments/ day         EU      Europe               MEA     Middle East Africa    AM         Americas              AP      Asia Pacific

INVESTOR RELATIONS PRESENTATION | MARCH 2018                                                                                                                                PAGE 30
DHL EXPRESS: FOCUS ON TDI

            Continue successful FOCUS strategy                               DHL Express Core Product

                                                               TDI (Time Definite International) - The premium segment
  2009 Revenue distribution        2017 Revenue distribution   within Express Industry

                                      0%                       Time Definite = Dedicated delivery at a scheduled time of day
           10%                       3%  12%
                                                               International = Cross-Border Shipment (intra- or between
        13%
                                          7%                   continents)
       4%                                                      TDI: requires dense and broad international network
        12%            61%
                                                  78%          TDD: Time Definite Domestic
                                                               DDI: Day Definite International
                                                               DDD: Day Definite Domestic
      TDI        TDD         DDI    DDD        ACS / Other     ACS: Air Capacity Sales (re-sale of spare capacity on dedicated
                                                               fleet to optimize utilization, not sold by core Express sales teams)

INVESTOR RELATIONS PRESENTATION | MARCH 2018                                                                                 PAGE 31
DHL EXPRESS: VIRTUAL AIRLINE MODEL & AIR CAPACITY SALES

                       Virtual Airline                                       Air Capacity Sales

Approx. 500 airports and 22 major hubs connected                            Block Space Agreement, guaranteed air
through                                                                     cargo product.
1. Dedicated air: >250 aircraft with 17 partner airlines on
   >600 daily flights                                                       Express TDI core product, capacity
2. Purchased air: >300 commercial airlines with >1,800
                                                                    BSA     based on average utilization, adjusted on a
   daily flights                                                            daily basis
                                                                    CORE
                                                                     TDI
                                                                    CAPA-   CORE Flex & Air Capacity Sales Flex, a
                  Capacity Commitment                                CITY   set amount of the Total Spare Capacity to
                                                                            be utilised for TDI core volume surge
                                                                    FLEX    and/or air cargo filler traffic
                               22%             0 - 90 Days (incl.
                                                                     ACS
                                               Purchased Air)       GUAR.   Air cargo guaranteed, a set amount of the
                                               91 - 360 Days                Total Spare Capacity guaranteed for priority
         52%
                                                                            traffic & key customers
                               26%             Fixed

INVESTOR RELATIONS PRESENTATION | MARCH 2018                                                                      PAGE 32
Focus. Connect. Grow.

                                      FORWARDING, FREIGHT

INVESTOR RELATIONS PRESENTATION | MARCH 2018                           PAGE 33
GLOBAL FORWARDING, FREIGHT: PERFORMANCE RECOVERING

  Air freight ‘000s Export - Tons          Air freight gross profit             Business Highlights
                                                                        EUR m
                   +8.0%                                                         DGFF fully participating in market recovery with
                                                       -1.4%
                  Q4: +3.8%                                                       strong Air and Ocean freight volume growth in 2017
                                                     Q4: +11.0%
         2,081                    2,248                                          Successful peak season in AFR with 3.8% volume
                                               875                863             growth translated into 11.0% GP increase reflecting
                                                                                  early peak season preparation
      FY 2016                    FY 2017    FY 2016            FY 2017           Volume growth in OFR still being offset by GP
                                                                                  pressure in OFR market

  Ocean freight ‘000s TEU1)                Ocean freight gross profit            Full-year DGFF EBIT slightly up as H2
                                                                                  improvement offset H1 decline
                  +6.5%                                                 EUR m    Returning to former profitability levels remains 1st
                 Q4: +4.7%
                                                      -5.8%                       priority, long term ambition unchanged to close gap
        3,059                     3,259              Q4: -8.8%                    to benchmark performance - Simplify initiatives incl.
                                                                                  IT roll-out (IRR) on track
                                              703                 662

     FY 2016                     FY 2017   FY 2016            FY 2017
1) Twenty Foot Equivalent Unit

INVESTOR RELATIONS PRESENTATION | MARCH 2018                                                                                       PAGE 34
GLOBAL FORWARDING, FREIGHT– DIVISIONAL RESULTS Q4 2017

 EUR m            Q4 2016     Q4 2017          Chg.    Management comments

                                                       Good momentum continues, reflecting growth in AFR and OFR volumes - organic
 Revenue             3,623       3,791    +4.6%
                                                       increase of 9.1%

                                                       AFR posting increase in absolute GP and GP/t – rate development in OFR still
 Gross Profit         883         879      -0.5%
                                                       challenging with ongoing pressure on GP

 EBIT                 104         123    +18.3%        Strong peak season well managed, margin at pre NFE levels of 3.2%

 Operating
                      206         119     -42.2%       Reflecting WC build-up due to increasing activity levels
 Cash Flow

 Capex                  18          18          flat   Stable on low level reflecting asset light business model

INVESTOR RELATIONS PRESENTATION | MARCH 2018                                                                                          PAGE 35
THE LIFECYCLE OF A SHIPMENT IS A COMPLEX PROCESS

Forwarding is more than brokerage of transport, it is managing all the steps along the way

                                         Take control of goods   Create documents for
                                         from customer           export compliance &    Manage transport
                Plan route & organize                            customs                to port/airport
                            shipment

            Quotation Process                                                                        Manage loading &
                                                                                                     export process
          Goods to be
          shipped
                                                                                                           Ensure goods are
                                                                                                           shipped

      Billing & payments
                                                                                                      Ensure shipment
                                                                                                      stays on track
              Transport to warehouse or
                         final destination                                         Accept delivery
                                                Manage documents for import        at port/airport
                                                compliance & customs process

INVESTOR RELATIONS PRESENTATION | MARCH 2018                                                                            PAGE 36
DGFF SUMMARY: AMBITIOUS YET ACHIEVABLE PLAN

     DGFF: recent EBIT and ROCE history                       Forwarding is an attractive industry – and
    60%                                                        DGFF has a leading franchise, brand and
                                                               right people to be a successful industry
    50%
                                                               leader
    40%
                                                              We know our weaknesses and are
    30%
                                                               committed to bringing our practices to
    20%                                                        best-in-class levels
    10%                                                       Our plan is ambitious, but the steps to
     0%                                                        address our short- and medium term
             2012   2013    2014    2015    2016   2017
   -10%                                                        challenges are well-described and
                              EBIT-Margin
                                                               accepted
   -20%       ROCE excl. goodwill      ROCE incl. goodwill

          We remain committed to our goal of benchmark conversion ratios and profitability

INVESTOR RELATIONS PRESENTATION | MARCH 2018                                                             PAGE 37
DGFF: GROSS PROFIT AND GROSS PROFIT/EBIT CONVERSION

                                             FY
    in € m                                 2017
    Total revenues                        14.482    DGF Gross Profit conversion and EBIT margin

    Revenues Global Forwarding            10.279
                     t/o Airfreight        4.608
                 t/o Oceanfreight          3.512
                        t/o others         2.159
    Revenues Freight                       4.354   17.1%    16.9%
    Consolidation                           -151
    Total gross profit                     3.470                     10.3%                 9.7%     8.6%
                         t/o Airfreight      863
                                                                               5.1%
                     t/o Oceanfreight        662    3.9%     3.9%
                             t/o others      865                      2.3%                  2.4%        2.0%
                                                                                   1.2%
                            t/o Freight    1.080
                                                   2012      2013     2014     2015         2016        2017
    Reported EBIT                           297
                      t/o Forwarding        206            GP-to-EBIT conversion          EBIT margin
                           t/o Freight       91

INVESTOR RELATIONS PRESENTATION | MARCH 2018                                                                   PAGE 38
SIMPLIFY: IMPROVE EXECUTION, OWNERSHIP AND INCENTIVES

                   Challenges                                   Simplify

        Decision-making and                   1
                                                  Adherence to a set of clear business rules
         execution takes too long                  along three areas:
        Complex structures and                         Mindset and behavior
         processes                                      Roles and responsibilities
        Working together as one                        Steering and incentives
         network
        No state-of-the-art IT
                                               2 Structural cost reductions on all levels
         systems yet and new digital
         players entering                      3 IT Renewal Roadmap (IRR)

INVESTOR RELATIONS PRESENTATION | MARCH 2018                                                    PAGE 39
Focus. Connect. Grow.

                                                SUPPLY CHAIN

INVESTOR RELATIONS PRESENTATION | MARCH 2018                           PAGE 40
SUPPLY CHAIN – DIVISIONAL RESULTS Q4 2017

EUR m            Q4 2016     Q4 2017      Chg.   Management comments

                                                 Reported growth primarily influenced by adverse FX developments (GBP, USD)
Revenue             3,607      3,619     +0.3%   and WLT sale. Organic increase of 7.8% as a result of volume increases across all
                                                 regions

                                                 EBIT below last year as EUR 32m one-time write-down of customer
EBIT                 206         184    -10.7%
                                                 relationship assets masks good business development

Operating
                     520          28    -94.6%   Includes provision movement from debt-financed UK pension funding
Cash Flow

Capex                 73          83    +13.7%   Increase in overall low spending due to phasing of new customer start-ups

INVESTOR RELATIONS PRESENTATION | MARCH 2018                                                                                   PAGE 41
DHL SUPPLY CHAIN: SOLUTIONS OVERVIEW

Offering Customized Solutions Across the Entire Supply Chain

                                                                Revenue by Service Area
                                                                       FY 2017

                                                               Value Added
                                                                Services
                                                                                             Transportation
                                                                        20%
                                                                                           33%

                                                                             47%

                                                                             Warehousing

INVESTOR RELATIONS PRESENTATION | MARCH 2018                                                     PAGE 42
TAPPING NEW E-COMMERCE LOGISTICS OPPORTUNITIES:
E-FULFILLMENT
                                                       DHL Vendor-neutral E-fulfillment

                  Seamless Logistics Management                                       Quality Fulfillment, Worldwide

      •    End-to-end order and inventory visibility                    •   High quality, secure fulfillment
      •    Global order orchestration                                   •   Choice of standard services
      •    Plug-n-play expansion into new markets                       •   Consistent SLAs across all locations

                         Transactional pricing                                       Fast and Flexible Shipping
      •    Pay per use                                                  •   Broad range of shipping services
      •    No capital spend required                                        (domestic + international)

      •    No fixed costs                                               •   Late cut-off times

                                                             Customer Benefits

      •    Significant overall cost savings through partnership for fulfillment and shipping
      •    Quality improvement, control over branding, packaging and inventory data
      •    Decreased shipping time through best-in-class supply chain technology and fulfillment

          Using the full range of our cross-divisional experience and assets allows us to
          differentiate in e-fulfillment and provide unique customer benefits
INVESTOR RELATIONS PRESENTATION | MARCH 2018                                                                           PAGE 43
DHL SUPPLY CHAIN HAS 9 INITIATIVES TO DELIVER STRATEGY 2020
    Focus                               Connect                      Grow
 Drive standardization and          Create an effective           Shift the portfolio…
 reduce complexity…                 organization globally…

 1 Improvement of                   4 Efficient and effective     7 Value added
   underperforming business           functions                     services

 2 Operational standardization      5 Consistent and lean         8 Global sectors and
                                      organization                  products
                                      globally

 3 Commercial standardization       6 Culture and mindset shift   9 Geographical shift

 …to increase efficiency            …to enable change             …to address
                                                                  attractive segments

INVESTOR RELATIONS PRESENTATION | MARCH 2018                                             PAGE 44
Appendix

INVESTOR RELATIONS PRESENTATION | MARCH 2018              PAGE 45
GROUP P&L 2017

 EUR m                                 2016         2017     Chg.    Management comments

                                                                     Organic growth of 6.8% reflecting economic acceleration and structural e-
 Revenue                            57,334         60,444   +5.4%
                                                                     commerce growth. Adverse FX effects of -2.2%

 EBIT                                 3,491         3,741   +7.2%    Steady profitable growth continued, delivering on guidance

                                                                     E-commerce-driven Parcel growth offset mild letter decline supported by
 t/o PeP                              1,446         1,502   +3.9%
                                                                     elections – international operations continue to build out Parcel growth platform
                                                                     EBIT growth strongest at Express (+12.4%), turnaround in Global Forwarding,
 t/o DHL                              2,404         2,587   +7.6%
                                                                     Freight (+3.5%), held back by Supply Chain (-3.0%) due to Q4 one-off

 Financial result                       -359         -411   -14.5%   Affected by write downs on financial assets in Q3 and Q4

                                                                     Tax rate at 14.3% - above 13% expectation due to revaluation of US tax loss
 Taxes                                  -351         -477   -35.9%
                                                                     carryforwards (FY 16: 11.2%)
 Consolidated                                                        Net profit and EPS increase slower than EBIT growth due to financial result and
                                      2,639         2,713   +2.8%
 net profit1)                                                        tax rate increase
 EPS (in EUR)                           2.19         2.24   +2.3%
1) Attributable to Deutsche Post AG shareholders

INVESTOR RELATIONS PRESENTATION | MARCH 2018                                                                                                       PAGE 46
GROUP P&L Q4 2017

 EUR m                           Q4 2016            Q4 2017    Chg.    Management comments

                                                                       Organic revenue increase of +8.4% - Euro strength lead to worsened FX effects
 Revenue                            15,410           16,109   +4.5%
                                                                       in Q4 of -4.1%
                                                                       Expected strong year-end with main growth contributions from Express and PeP
 EBIT                                 1,111           1,181   +6.3%
                                                                       as well as turnaround of DGFF
                                                                       Good Parcel and eCommerce peak season performance combined with stable
 t/o PeP                                 490           510    +4.1%
                                                                       Post revenue
                                                                       Strong year-end performance driven by all divisions, although held back by DSC
 t/o DHL                                 746           806    +8.0%
                                                                       one-off
                                                                       Includes write down on financial asset, offsetting previous year expenses from
 Financial result                       -124           -128    -3.2%
                                                                       currency translation

 Taxes                                  -115           -181   -57.4%   Final full-year tax rate of 14.3% leads to Q4 rate of 17.2%

 Consolidated
                                         841           837     -0.5%   Net profit and EPS not reflecting EBIT growth due to tax rate increase
 net profit1)
 EPS (in EUR)                           0.70           0.69    -1.4%
 1) Attributable to Deutsche Post AG shareholders

INVESTOR RELATIONS PRESENTATION | MARCH 2018                                                                                                       PAGE 47
FREE CASH FLOW FY 2017

Strong FCF generation in excess of dividend taking into account EUR 495m pension funding

                  EUR m       2016     2017
                      EBIT    3,491    3,741 Up EUR 250m
              Depreciation    1,377    1,471 Increase reflecting increasing growth capex as well as DSC Q4 one-off
                                               Debt-financed pension funding effect in 2016 (EUR 1,000m) and 2017 (EUR 495m) – excl.
      Change in provisions    -1,799    -940
                                               this effect, 2017 provision change within expected EUR 400-500m range
              Income taxes     -528     -626 Cash taxes trending up following profit growth
                                               Swing vs last year due to phasing of lump-sum pension payment offers: related pension
                     Other       -27    -228
                                               obligations reclassified from provision to liabilities in 2016 and liabilities partly served in 2017
 Changes in working capital      -75    -121 Expected slight build-up aligned with business growth
     Operating Cash Flow      2,439    3,297 Excl. pension fundings up EUR 353m
                 Net capex    -1,701 -1,967 Significantly higher than last year, mostly due to fleet investments in Express
                  Net M&A      -206      210 Includes UK Mail acquisition in 2016 (EUR - 278m) and WLT disposal in 2017 (EUR +286m)
               Net interest      -88    -108 Increase reflects higher outstanding debt financing
                      FCF       444    1,432 FCF of 1,927m in 2017 adjusted for pension funding (-495m)

INVESTOR RELATIONS PRESENTATION | MARCH 2018                                                                                                PAGE 48
FREE CASH FLOW Q4 2017

Strong OCF and FCF generation as usual in fourth quarter, despite the expected high capex spend

 EUR m                                         Q4 2016   Q4 2017

 Net cash from operating activities                                Usual strong seasonal Operating Cash Flow generation, impacted
                                                 1,205      981    by EUR 495m pension funding in UK
 before changes in Working Capital
                                                                   Changes in working capital below last year due to a more
 Changes in Working Capital                       720       546
                                                                   balanced steering of year-end cash management
 Net cash from operating activities
                                                 1,925     1,527
 after changes in Working Capital

 Net Capex                                        -404      -779   FY capex up in line with guidance, with Express investments
                                                                   significantly up in Q4 due to expected aircraft purchases
 Net M&A                                          -260      284
                                                                   Net M&A includes last year´s UK Mail acquisition (EUR - 278m)
                                                                   and closing of Williams Lea Tag disposal in Q4 17 (EUR +286m)
 Net Interest                                      -60       -57

 Free Cash Flow                                  1,201      975    FFO/Debt up to 32.0% (year-end 2016: 30.6% )

INVESTOR RELATIONS PRESENTATION | MARCH 2018                                                                                  PAGE 49
NET DEBT DEVELOPMENT

Net debt reduced despite additional pension funding

                                3,297

                                                                                                        in EUR m

                                               -1,967

                                                                                          -1,938
            -2,261                                       -1,390          383

         Net debt (Dec        OCF after         Net     Dividends   Other incl. M&A     Net debt
           31, 2016)          change in        capex       paid                       (Dec 31, 2017)
                                W/C

INVESTOR RELATIONS PRESENTATION | MARCH 2018                                                           PAGE 50
IFRS 16: MAJOR P&L IMPLICATIONS
                                                                      1)
  EUR m                               Expected IFRS16 effect on 2018
  Revenuenue                                                No changes

                                                            Decrease as lease expenses to be recognized as depreciation and interest
  Materials expense                    ~ -1,950             costs – only exemptions for short-term leases and low-value assets, which
                                                            stay in material costs

  EBITDA                               ~ +1,950             Increase due to lower materials expenses

  D&A                                  ~ +1,800             Increase due to new depreciation of capitalized operating-lease-assets

                                                            EBIT increase as operating lease expense replaced by depreciation
   EBIT                                ~ +150
                                                            and interest

  Net finance costs                     ~ -350              Increase due to interest cost component booked in finance cost

  Income taxes                          ~ -50               Lower during first years due to higher deferred tax assets

                                                            Whilst neutral over time, timing effect due to higher interest during
  Cons. net profit                      ~ -150
                                                            first years

                       Main P&L effects: increase in EBITDA and EBIT, long-term neutral to net profit
 1) Based on leases as per 1.1.2018

INVESTOR RELATIONS PRESENTATION | MARCH 2018                                                                                            PAGE 51
IFRS 16: EXPECTED IMPLICATIONS FOR DPDHL GROUP

Scope at DPDHL Group: >25,000 leasing contracts, covering >35,000 assets

Expected major impacts on 2018 numbers:

 P&L                       EBIT: expected increase of EUR ~ 150m
                                                                                Current internal estimates:
                                                                                to be further validated
 Balance sheet             Net debt: Expected increase of ~ EUR 9bn

                           FCF: no change based on new definition: OCF – redemption of lease liabilities - net
 FCF
                           capex - net M&A - net interest

 Credit Rating             No impact on rating and related metrics expected

                 No effect on actual cash generation and debt rating

INVESTOR RELATIONS PRESENTATION | MARCH 2018                                                                  PAGE 52
OCF: TOTAL CASH OUT FOR PENSION PLANS DECLINING, AS
EXPECTED
                         EUR m                       2012      2013      2014     2015      2016      2017                                                         Expected trend
                                                     542       538       531                                       Steady decline: 50% cost reduction by
                         Civil                                                     516                             2027 due to civil servants going into
                                                                                            493
                         servants (in                                                                 461          retirement
 Defined                 GER)
 contribution
 (DC):
 Cash out =
 staff costs in          Hourly
                                                                                                                   Slight increase reflecting business growth
 EBIT                    workers and                                               317       305      300          and selected shifts from DB to DC plans
                         salaried                              286       276
                         employees
                                                      238
                         mainly
                         outside GER

 Defined                                                                                                           Cash out with declining trend, reflecting
 Benefit                  Hourly                     566                                                           demographics and 2012/16 pension
 (DB):                    workers and                          468                457       428
                                                                         431                          417          funding
 Staff costs +            salaried                   410       282       268       264      266       230          Change in provisions (Cash out in excess of EBIT)
 Change in                employees
           1)
 provisions                                          156       186       163       193      162       187          Current service costs (in staff costs)

1) Cash Out = benefit payments + employer contributions = staff costs + change in provisions, excluding one-offs
INVESTOR RELATIONS PRESENTATION | MARCH 2018                                                                                                                              PAGE 53
OCF: OTHER PROVISIONS DEVELOPED IN LINE WITH EXPECTATIONS,
WITH NO CHANGE IN TRENDS EXPECTED

                                                                        Trend, as
EUR m                                             2012          2017                 OUTLOOK: drivers intact, trends expected to continue
                                                                        expected1)

    Other employee benefits                      1,109           662                 Further down reflecting net utilization

    Restructuring provisions                        681          102                 US restructuring provisions further tailing off

             Technical reserves                     591          642                 Increase with business growth

                Postage stamps                      450          173                 Lower as letter volumes continue to decline

                   Tax provisions                   127          163                 No significant change expected

   Miscellaneous provisions                         667          809                 No specific trend expected

                                Total            3,635          2,552                Further decrease, although decelerating

1) IR Tutorial, Pension and Provisions Accounting, April 2013

INVESTOR RELATIONS PRESENTATION | MARCH 2018                                                                                           PAGE 54
CAPEX: RECENT HISTORY AND OUTLOOK

                                                                                     Slight upward trend
   Increase driven by                                          Low levels
                                    2017 peak,                                      from new business –          GROUP CAPEX
  investments in B2C
 national/international
                            +   plateauing in 2018    +    reflecting minimal
                                                            capital intensity
                                                                                +    still remains mostly   =     (excl. leases)
                                                                                            asset light
 Capex,
 EUR m
                                            1,049

                  666                                                                                           FY 2018 guidance
                                                                                                                   EUR ~2.5bn
                                                                                                 277
                                                                        70

            PeP                       Express             Global Forwarding,          Supply Chain
                                                               Freight

  FY 2013         FY 2014       FY 2015     FY 2016       FY 2017      FY 18e

INVESTOR RELATIONS PRESENTATION | MARCH 2018                                                                                 PAGE 55
CAPEX BY DIVISION – WHERE DOES IT GO?

2017 Capex,
                                        1,049
EUR m
                                                 Other

                                                 Vehicles
         666                                     Hubs &
                                                 Gateways
                  Other
                  Post
                  Parcel
                  International                                                      277         Other
                                                 Aviation                                        IT
                  Parcel                                              Other                      Transportation
                  Germany                                    70       Facilities
                                                                                             Warehousing
                                                                      IT
         PeP                           Express              DGFF                     DSC

         We invest in infrastructure and improving customer service and satisfaction to foster
         sustainable profit and cash flow growth

INVESTOR RELATIONS PRESENTATION | MARCH 2018                                                          PAGE 56
PENSIONS: STATUS UPDATE ON DEFINED BENEFIT PLANS

                                                                                                                     in EUR m
 After UK funding, Group funding ratio up to 75%
                                                                    17,723               17,486         17,381 Total DBO
 DB pensions in Germany and UK
                                                                                                                Net Pension
  Germany: no regulatory funding requirement, funding               5,437               4,987           4,297 Provison
   ratio at 60%
  UK: after EUR 495m funding in Q4, funding ratio up to
   98%
                                                                    12,286               12,499         13,084 Plan Assets
 Impact of change in discount rates on Group
  Balance sheet: No significant impacts from discount
   rate changes in Q4 17 - net pension provision declined
   as a result of increased pension assets, mainly EUR            Dec 31, 2016       Sep 30, 2017     Dec 31, 2017
   495m UK pension funding
  P&L: Changes made only on annual basis based on
   prior year end discount rates                               Discount Rate     Germany      UK      Other     Total

  Cash flow: Current pension payments and employer            Dec 31, 2016      2.25%        2.75%   2.19%     2.39%
   contributions to plan assets not affected by fluctuations   Sep 30, 2017      2.25%        2.50%   2.24%     2.33%
   in applied discount rate levels
                                                               Dec 31, 2017      2.25%        2.50%   2.23%     2.32%

INVESTOR RELATIONS PRESENTATION | MARCH 2018                                                                         PAGE 57
DISCLAIMER

THIS PRESENTATION CONTAINS CERTAIN STATEMENTS THAT ARE NEITHER REPORTED RESULTS NOR OTHER
HISTORICAL INFORMATION. THESE FORWARD-LOOKING STATEMENTS ARE SUBJECT TO RISKS AND
UNCERTAINTIES THAT COULD CAUSE ACTUAL RESULTS TO DIFFER MATERIALLY FROM THOSE EXPRESSED IN
THE FORWARD-LOOKING STATEMENTS. MANY OF THESE RISKS AND UNCERTAINTIES RELATE TO FACTORS THAT
ARE BEYOND DEUTSCHE POST AG’S ABILITY TO CONTROL OR ESTIMATE PRECISELY, SUCH AS FUTURE MARKET
AND ECONOMIC CONDITIONS, THE BEHAVIOR OF OTHER MARKET PARTICIPANTS, THE ABILITY TO
SUCCESSFULLY INTEGRATE ACQUIRED BUSINESSES AND ACHIEVE ANTICIPATED SYNERGIES AND THE ACTIONS
OF GOVERNMENT REGULATORS. READERS ARE CAUTIONED NOT TO PLACE UNDUE RELIANCE ON THESE
FORWARD-LOOKING STATEMENTS, WHICH APPLY ONLY AS OF THE DATE OF THIS PRESENTATION. DEUTSCHE
POST AG DOES NOT UNDERTAKE ANY OBLIGATION TO PUBLICLY RELEASE ANY REVISIONS TO THESE FORWARD-
LOOKING STATEMENTS TO REFLECT EVENTS OR CIRCUMSTANCES AFTER THE DATE OF THIS PRESENTATION.
THIS PRESENTATION DOES NOT CONSTITUTE AN OFFER TO SELL OR THE SOLICITATION OF AN OFFER TO
SUBSCRIBE FOR OR BUY ANY SECURITY, NOR SHALL THERE BE ANY SALE, ISSUANCE OR TRANSFER OF THE
SECURITIES REFERRED TO IN THIS PRESENTATION IN ANY JURISDICTION IN CONTRAVENTION OF APPLICABLE
LAW.
COPIES OF THIS PRESENTATION AND ANY DOCUMENTATION RELATING TO THE OFFER ARE NOT BEING, AND
MUST NOT BE, DIRECTLY OR INDIRECTLY, MAILED OR OTHERWISE FORWARDED, DISTRIBUTED OR SENT IN OR
INTO OR FROM AUSTRALIA, CANADA OR JAPAN OR ANY OTHER JURISDICTION WHERE TO DO SO WOULD BE
UNLAWFUL.
THIS DOCUMENT REPRESENTS THE COMPANY‘S JUDGMENT AS OF DATE OF THIS PRESENTATION.

INVESTOR RELATIONS PRESENTATION | MARCH 2018                                                     PAGE 58
INVESTOR RELATIONS CONTACTS

                 Martin Ziegenbalg, Head of Investor Relations
                 • +49 228 182 63000
                 • E-mail: m.ziegenbalg@dpdhl.com

                Robert Schneider
                • +49 228 182 63201
                • E-mail: robert.schneider1@dpdhl.com

                 Sebastian Slania
                 • +49 228 182 63203
                 • E-mail: sebastian.slania@dpdhl.com

                 Sarah Bowman
                 • +1 914 226 3437
                 • E-mail: sarah.bowman@dpdhl.com

                Christian Rottler
                • +49 228 182 63206
                • E-mail: christian.rottler@dpdhl.com

INVESTOR RELATIONS PRESENTATION | MARCH 2018                     PAGE 59
You can also read