Development of Ice Profiler Sonar (IPS) Target Sonar with a Logarithmic Detector
←
→
Page content transcription
If your browser does not render page correctly, please read the page content below
Development of Ice Profiler Sonar (IPS) Target Sonar
          with a Logarithmic Detector
                                                                                    ASL Environmental Sciences Inc.
   Rene A.J. Chave, David B. Fissel, David D. Lemon,
                                                                                         Victoria BC Canada
               M. Clarke and P. Johnston                                                 rchave@aslenv.com

    Abstract— Upward-looking sonar (ULS) instruments have                 I.   ICE PROFILING SONAR (IPS): DEVELOPMENT HISTORY
become the primary source of data for high resolution and long
duration measurements of sea ice drafts to support engineering         A. Introduction and Principles of Operation
requirements for oil and gas exploration projects in Arctic and            Upward-looking sonar (ULS) instruments have become the
other ice-infested areas. ULS instruments, in the form of ASL’s        primary source of data for high resolution and long duration
Ice Profiler Sonar (IPS), provide accurate measurements for ice        measurements of sea ice drafts to support engineering
draft on a continuous year-long basis and allow detailed               requirements for oil and gas exploration projects in Arctic and
characterization of keel shapes and other ice features. The IPS        other ice-infested areas [1]. ULS instruments, in the form of
instrument was originally developed in the 1990’s and it was last
                                                                       ASL’s Ice Profiler Sonar (IPS) continuously collect acoustic
upgraded by ASL Environmental Sciences Inc. in 2007- 2008
                                                                       data for periods of one year or longer as operated on sub-
through improved instrument design based on more capable
microprocessors and more advanced on-board firmware.
                                                                       surface moorings (see Fig. 1). The instruments provide
                                                                       accurate measurements for ice draft on a continuous year-long
     Another upgrade of the IPS instrument platform is presently       basis and allow detailed characterization of keel shapes and
underway with the design, testing and implementation of a              other ice features. When combined with a companion Acoustic
logarithmic detector module in place of the previously used            Doppler Current Profiler (ADCP) to measure ice velocities,
linear detector module which has been used for the past decade         high resolution ice thicknesses and ice velocities can be
in the instrument. The linear detector module involves the use of      obtained along thousands of kilometers of ice which move over
an echo sounder detector which generates an analog voltage             the moored ice profiler location. These measurements provide
output from the raw transducer input supplied which is constant,       important data for establishing metocean design criteria related
i.e. independent of the time elapsed since the acoustic pulse was      to oil and gas operations in areas with seasonal or year-round
originally emitted. While this approach has proven reasonably          ice cover.
serviceable, it has the disadvantage that the dynamic range of the
instrument is curtailed from the alternative approach of using a           The IPS instrument operates by emitting frequent short
logarithmic detector module which has previously been                  pulses (pings) of acoustic energy concentrated in narrow beams
implemented in other ASL upward looking sonar instruments.             (l.8° beamwidth) and detecting surface returns [2]. Precise
The larger dynamic range of the log detector avoids using              measurements of the delay times between ping emission and
approximate TVG compensation. With the logarithmic sonar               reception are converted into distances separating the
detector, the use of discrete threshold values for target detection    instrument’s transducer and the ice undersurface.
is avoided and the resulting target detection capability is more       Contemporary data from the instrument’s on-board pressure
robust.                                                                sensor are then combined with atmospheric surface pressure
                                                                       data and estimates of the mean sound speed in the upper water
    The project involved three principal components: (a)               column (obtained from observations of open water above the
construction of a prototype 420 kHz log sonar card; (b)                instrument) to derive estimates of ice draft from each emitted
simulations of the response of the IPS log sonar instrument from       ping. The IPS can operate continuously for one year at a ping
previous IPS data sets which guided the development of
                                                                       rate of 1 Hz and it provides high precision of approximately
operating firmware; and (c) assembly and field testing of a
prototype IPS log sonar unit operated simultaneously with a
                                                                       ±0.05 m vertical of the underside of the sea ice. When
standard IPS5. The simulations of the IPS5 log sonar outputs           combined with the ADCP instrument located below the IPS
derived from previous standard IPS5 data indicate that there are       instrument, the time series ice draft data can be converted to a
occasional differences in the target detection for borderline cases,   quasi-spatial or distances series with a horizontal resolution of
but they will not be significant. After iterations to improve the      approximately 1 m.
robustness of the target detection algorithm, development of the
remaining functions of the IPS5 operating firmware was then            B. Development History
carried out and further tested. Finally the prototype IPS5 log             The ASL IPS is an upward looking sonar device that was
sonar instrument unit, along with a standard IPS5 instrument,          purpose-designed for sea ice draft measurements by the
was field tested in a deep open water environment (to 200 m
                                                                       Institute of Ocean Sciences (IOS) of the Fisheries and Oceans
water depth) in order to test the accuracy of the acoustic range of
the sonar targets.
                                                                       Canada in the 1990’s [3].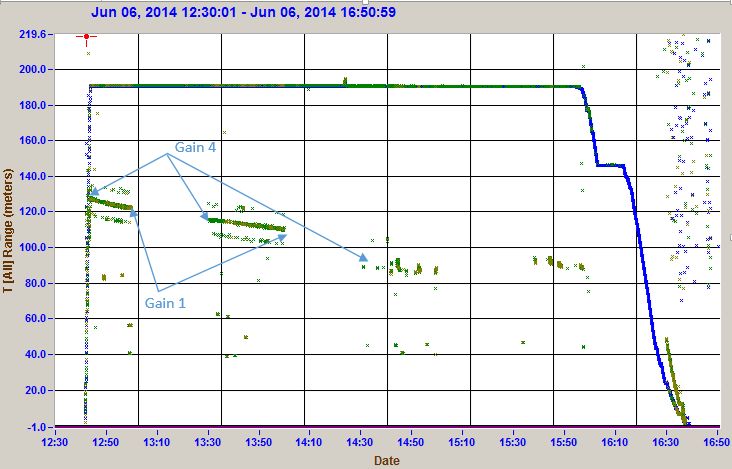
Table 1 The improved features of the Ice Profiler Sonar
model IPS5 with comparisons to the model IPS4.
Parameter IPS-4 IPS-5
Year Introduced 1996 2008
Sample Rate up to 1 Hz up to 2 Hz
Data Storage 68/128 MB 2 to 8 GB
A/D Resolution 8 bits 16 bits
Receiver Gain fixed variable
Power up to 2 years improved
Consumption
Multiple Phases 8 12
Targets per Ping 1 up to 5
Full Water Column Limited User
Profiles selectable
Wave Measurement Not 2 Hz Burst
Mode Available Sampling
II. IPS LOGARITHMIC DETECTOR: DESIGN OBJECTIVES
An upgrade of the IPS instrument platform is presently
underway with the design, testing and implementation of a
logarithmic detector module in place of the previously used
linear detector module which has been used for the past decade
in the instrument.
A. Present Detector Module
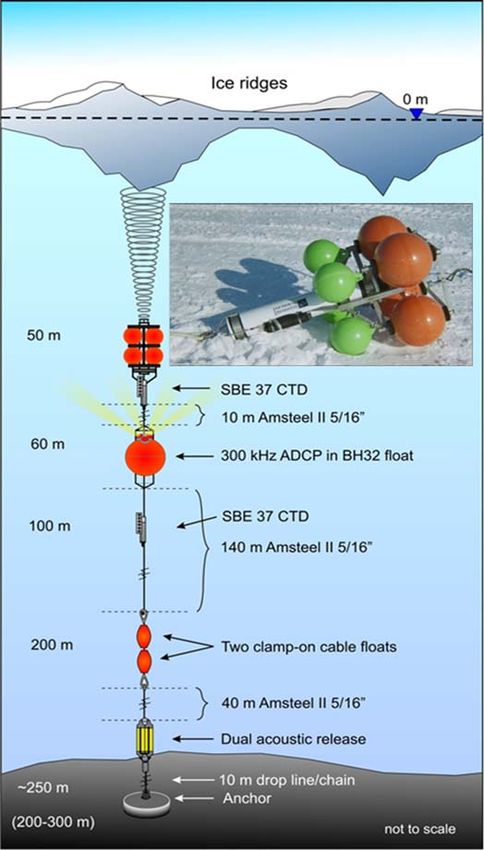
Figure 1 A typical deployment arrangement of an ice The existing linear detector module is comprised of three
profiler and ADCP ice velocity measuring instrument on a main sections. The first section is an impedance matching pre-
single subsurface mooring. amp that provides passive linear gain and bandpass filtering.
The second section is a voltage controlled amplifier whose gain
The technology was commercialized by ASL in 1996. It is controlled in time relative to the start of the transmitted
was last upgraded by ASL Environmental Sciences Inc. in signal. This Time Varying Gain (TVG) roughly compensates
2007- 2008 through improved instrument design based on the expected signal loss from attenuation and spreading of the
more capable microprocessors and more advanced on-board acoustic signal in sea water such that the signal level from
firmware [4]. The additional features of the new IPS5 model identical targets will generate the same DC voltage irrespective
as given in Table 1 included: expansion of the onboard flash of its distance from the instrument. The TVG has four settings,
data storage from 69 MB to 2GB, then 4 GB and now 8 GB; corresponding to different initial gains, with G1 being the
allowing for detection of up to 5 targets per ping rather than the lowest and G4 the highest; normally only G1 is used for ice
single target detected with the IPS4; increasing the total draft measurements. The third section generates an analog DC
number of individual sequential sampling selections from 8 to voltage that is linearly proportional to the peak to peak
12; and reduction of overall receiving system gain so that amplitude of the filtered and gained signal so the 420KHz echo
thicker ice targets were not at the saturation limit of the A/D signal can be digitized by the A/D converter at rates up to 64 K
converter. Also, the echoes from separately programmed samples / second..
“bursts” of pings can be recorded over the entire water column The effects of the time varying transmission losses are
above the instrument with a vertical resolution of 1.1 cm. compensated for through a time varying gain (TVG) circuit
which only approximately represents the actual transmission
losses. While this approach has been successful, it has thelimitation of a relatively small “instantaneous” dynamic range instrument digital measurements were converted to the output
at any point in time. This limited dynamic range makes the that would have resulted from the log sonar module (see Figure
setup of the instrument more difficult if the user does not want 2), through a detailed numerical simulation software system
the water-ice and water-air interfaces to be saturated (clipped at developed for this purpose. These converted profiles were then
the maximum input of the A/D converter). To overcome the processed using the new algorithm for target detection with the
clipping problem, the time varying amplifier and the linear log sonar module and these targets were then compared to
detector have been replaced with a “logarithmic” detector that those found by the standard algorithm in the original IPS linear
provides a DC voltage for the A/D converter with an detection module. An example of the output of the software
instantaneous dynamic range of over 80dB. The logarithmic simulation is shown in Figure 3.
detector converts the logarithm of the peak to peak amplitude
from the pre-amp/filter into a DC value for the A/D converter.
This system was developed for the ASL AZFP product line and
is now a “proven” technology for delivering high quality sonar
data with low power consumption. [5]. In addition, the new
logarithmic sonar detector avoids component obsolesce issues
that have been a problem with the older linear detector system
and also has manufacturing advantages. The use of the present
linear detector module also required the specification of
amplitude thresholds for qualifying the detection of targets
which were not optimal for short ranges and for very long
ranges.
B. Design Objectives and Requirements for the Logarithmic
DetectorModule
The log detector has no TVG compensation, instead relying
on its large dynamic range to keep the echo signal within the
detector’s response. In that case, the signal received from a
Figure 2 Converted linear data to log
constant strength target will decrease with its range, in
accordance with the transmission loss. With the logarithmic
The start and stop amplitudes used in the original data were
sonar detector, the use of discrete user-selected threshold
converted to their logarithmic equivalents (matched at 50
values for detection is avoided and the resulting target
meters range), and the same persistence limits were used. For
detection capability is more robust.
each set of profiles considered the plots show for the standard
and log versions of the IPS, the number of targets found, the
III. DEVELOPMENT AND TESTING OF THE IPS LOG difference in the number of targets, and the difference in the
DETECTOR SONAR index number vs. the profile number. For sample cases where
The development project involved three principal the number of targets detected differed, plots of the signal
components: (a) preliminary design and initial construction of profile with the start and stop amplitudes are shown for each
a prototype 420 kHz log sonar card; (b) simulations of the instrument configuration.
response of the IPS log sonar instrument from previous IPS
data sets which guided the development of operating firmware
for the IPS instrument; and (c) assembly and field testing of a Table 2 Data sets used in detection performance model
prototype IPS5 unit. tests.
A. Preliminary Design and Initial Construction of a Project Measurem Extracted
Prototype 420 kHz log sonar detector module Condition Instrument # Site Name ent Year Date
The preliminary design of the IPS5 Log Detector involved D,M IPS5-1107 709 Site H 2009-2010 Feb 09-23
an adaptation of the log sonar detection module previously D,M IPS5-1106 758 Site A1 2010-2011 Feb 26-27
developed for the AZFP [5] to replace the original linear echo
sounder electronics circuitry used for sonar target detection. D,M IPS5-1110 758 Site H 2010-2011 Feb 26-28
D,M IPS5-1079 776 ShellSite02 2011-2012 Nov 28-29
B. Simulation of the IPS5 Log Sonar Detector In Support of Makavik
D,HN,O IPS5-3019 827 (SWIP) 2011-2012 Oct 15-16
the Firmware Development Makavik
Once the prototype log sonar module had a preliminary M IPS5-3019 827 (SWIP) 2011-2012 Nov-15
design for the electronics as per part (a), the development of H,M,O IPS5-1147 793 Site 1 2012-2013 Dec 03-08
the operating firmware was undertaken. This involved the use
of data obtained from many previously collected IPS data sets H,M IPS5-1147 793 Site 1 2012-2013 Mar 04-06
Yellowknife
(see Table 2) that had a wide range of signal-to-noise and other M IPS5-1050 795 Bay 2012-2013 Mar 05-12
types of data attributes. These test data from the original IPS
M,N IPS5-1050 701 Site A 2009-2010 Nov-05M,O IPS5-1110 758 Site H 2010-2011 Aug 24-28
M,O IPS5-1107 776 ShellSite01 2011-2012 Sep 15-30
Condition: D - Drop Outs, M - multiple targets, HN – high amp, no target, O - open
water, H - high tilt, N - noisy data
Figure 4 IPS5L All Targets
The IPS5E was operated with the gain alternating between
G1 and G4 every 30 minutes, as indicated in Figure 6. The
periods with higher gain were included to allow the IPS5E to
detect the mid-depth zooplankton scattering layer, the echoes
Figure 3 Log Targets - Orig Targets from which were used to do a relative inter-calibration of the
two instruments. As may be seen from Figures 5 and 7, the
The threshold curves computed from the transmission loss surface is always detected as the primary target by both
equation were tabulated in discrete steps in the firmware to instruments. The angled lines of targets in Figure 4 are
make it possible for the processor to run the detection interference from another echo-sounder operating in the
algorithm. The stepwise approximations to the ideal curve will vicinity; they are not seen in the IPS5E target record because of
cause occasional differences in the target detection for its more limited dynamic range the differences in the form of
borderline cases, but they will not be significant. After the target threshold in the two instruments.
iterations to improve the robustness of the target detection
algorithm, development of the remaining functions of the IPS5
operating firmware was then carried out and further tested.
Finally the prototype IPS units are being assembled and field
tested in a deep water environment (to 200 m water depth) in
order to test the accuracy of the range of the targets detected
out to the limits of signal detectability at large acoustic ranges.
C. Field testing of a prototype IPS5- Log Detector unit.
A field test of a prototype version of the IPS5 Log Detector
(IPS5L) unit operated alongside a conventional IPS5 (IPS5E)
instrumented was conducted in the waters of Saanich Inlet,
B.C. Canada near Victoria B.C on June 6, 2014. The IPS
instruments were operated on connected sub-surface moorings
which were separated by a distance of approximately 150 m
over a total measurement period of 5 hours at an operating
depth of 195 m below the water surface. Figure 5 IPS5L Best Targets
All targets (to the selected maximum of 3 per ping) and the
best target (target 1) during the inter-comparison measurements
are shown in Figure 4 and Figure 5 for the IPS5L and in Figure
6 & Figure 7 for the conventional IPS5E.Typical returns from
the full water column acoustic returns are presented in Figure 8
and Figure 9 for the IPS5L and IPS5E instruments.Figure 9 IPS5E Typical Acoustic Return
To quantitatively compare the response of the IPS5L and
Figure 6 IPS5E All Targets (gain settings shown)
the IPS5E, the comparison results are further analysed. To
allow for an inter-calibration of the IPS5L and IPS5E, the
zooplankton acoustic scattering layer at 70-80 m depth allowed
an adjustment to computed volume backscattering values (Sv)
so that the Sv values for each IPS instrument is directly
comparable
A range of backscatter coefficients from -14dB/Sr to
0dB/Sr was chosen to represent the range of echo intensities
that could be seen by an IPS deployed under the ice. Using
these as max and min values for both models, the difference in
instrument response can be shown. Figure 10 shows the
response for the current IPS5E. The 0dB line shows the signal
at this level from the ice will be clipped out to 240m. The
signal from the low end of -14dB will be out of saturation but
still above the threshold detection level. The line for the -14dB
also shows the error due to the deviation in the TVG response
Figure 7 IPS5E Best Targets from the theoretical. The line should be flat out to where the
TVG no longer is increasing which is just over 180m. The plot
of the actual data from the test shows the return from the water
surface and the system noise floor. From this it can be seen that
the noise floor starts to rise above the detection threshold at
around 180m but the low end of the ice signal range should
stay safely above the noise until just over 230m. This leaves
the possibility for false targets between the range of 180m to
230m.
Figure 8 IPS5L Typical Acoustic ReturnIPS5 log detector instrument using profile data from the
conventional IPS5 instrument proved to be very useful in
preparing the initial version of the IPS log sonar detector
firmware. The field inter-comparison of the IPS5 with log
sonar detector reveals that this version of the instrument will
allow detection of non-saturated A/D acoustic returns much
more frequently than the conventional IPS5 for sea ice and
even for open water returns, allowing greater use of acoustic
amplitudes for acoustic ice measurements. Based on an
acoustic model of the IPS5 log sonar instrument’s target
detectability, the IPS5 log sonar instrument also with its greater
dynamic range will allow detection of weaker targets in the
water column that the IPS5E would not be able to detect.
Operation of the instrument is also simplified as there is no
longer any need to select the gains to switch between the ice
and wave detection modes. The greater dynamic range should
Figure 10 IPS5E Response as a function of range as reduce the importance of, or even the need for, the user
specification of amplitude thresholds to detect targets. There is
no impact on the instrument power consumption from these
In Figure 11 the response of the IPS5L is shown. The changes.
highest estimated returns from the ice are clipped out to just The next step in the development of the IPS5 log detector
under 20m while the low returns are out of saturation until the sonar will be a full year deployment of the IPS log detector
signal drops below the system noise floor out near 270m. It can instrument alongside a conventional IPS5 to provide extensive
also be seen that there is enough dynamic range for returns direct comparisons of returns from sea ice. This inter-
lower than estimated at the short range and stronger signals at comparison is planned for the period Sept. 2014 to Sept. 2015
the longer ranges. in the Canadian Beaufort at a site in a total water depth of 30-
50 m.
ACKNOWLEDGMENT
The authors acknowledge the original and ongoing
contributions of Dr. Humfrey Melling developing the IPS
technology. We also thank our colleagues in ASL who
contributed to this work: Jan Buermans, Matt Stone, Jeremy
Lawrence, Kelvin Nelson, Dave Billenness and Dawn Sadowy.
REFERENCES
[1] D.B. Fissel, Marko, J.R. and Melling, H., “Advances in Marine Ice
Profiling for Oil and Gas Applications,” Proceedings of the Icetech 2008
Conference, July 2008.
[2] D.B. Fissel., J.R. Marko and H. Melling. Advances in upward looking
sonar technology for studying the processes of change in Arctic Ocean
ice climate. Journal of Operational Oceanography: 1(1), 9-18, 2008
Figure 11 IPS5L Response as a function of range
[3] H. Melling, P.H. Johnston and D.L. Reidel, “Measurements of the
Underside Topography of Sea Ice by Moored Subsea Sonar,” J.
Atmospheric and Ocean Technology, 12: 589-602, 1995.
[4] D.B. Fissel, J.R. Marko, E. Ross, V. Lee and R.A.J. Chave 2007.
Improvements in Upward Looking Sonar-Based Sea-Ice Measurements:
A Case Study for 2007 Ice Features in Northumberland Strait, Canada.
Proc. IEEE Oceans 2007, Vancouver, September 2007
IV. SUMMARY AND PRESENT STATUS
[5] Lemon, D., P. Johnston, J. Buermans, E. Loos, G. Borstad and L.
The project involved three principal components: (a) Brown. Multiple-frequency moored sonar for continuous observations
preliminary design and construction of a prototype 420 kHz log of zooplankton and fish. Proc. MTS/IEEE Oceans 2012, Hampton
Roads, VA Oct. 14-19, 2012.
sonar card; (b) development of operating firmware for the IPS
instrument; and (c) assembly and field testing of a prototype
IPS5 unit. The numerical simulations of profile data of theYou can also read