Diamond Conditioner Wear Characterization for a Copper CMP Process
←
→
Page content transcription
If your browser does not render page correctly, please read the page content below
Diamond Conditioner Wear Characterization for a Copper CMP Process
L. Borucki1, Y. Zhuang1,2, R. Kikuma3, N. Rikita3, T. Yamashita3, K. Nagasawa3, M. Keswani2,
H. Lee2, T. Sun2, D. Rosales-Yeomans2, T. Stout4 and A. Philipossian1,2
1. Araca Incorporated, 6655 North Canyon Crest Drive, Suite 1205, Tucson, AZ 85750
USA. Phone: 01-480-7485105, Fax: 01-520-5293055, Email: lenborucki@aol.com
2. The University of Arizona, Tucson, AZ 85721, USA. Phone: 01-520-6216101, Fax:
01-520-6216048, Email: ara@engr.arizona.edu
3. Mitsubishi Materials Corporation, 1-297, Kitabukuro-Cho, Omiya-Ku, Saitama-Shi,
Saitama 330-8508, Japan. Phone: 81-48-6415891, Fax: 81-48-6419471, Email:
rikita@mmc.co.jp
4. Veeco Instruments Incorporated, 2650 East Elvira Road, Tucson, AZ 85706, USA.
Phone: 01-520-7411044, Fax: 01-520-2941799, Email: tstout@veeco.com
Abstract
Conditioner wear, copper polish rates, pad temperature and coefficient of friction (COF) are
measured for two novel Mitsubishi Materials Corporation designs during an extended wear and
polishing test. Both designs are coated with a TeflonTM film to reduce substrate wear and
chemical attack. Using optical interferometry, changes in the coating that result in gradual
changes in diamond exposure are measured. Theories of the COF, conditioning, and polishing are
applied to explain the observed performance differences between the designs.
Introduction
It is well known that pad conditioning is necessary to prevent removal rate decay in CMP
processes. However, depending on the process kinematics, the ionic strength of the slurry and the
concentration and nature of slurry abrasive particles, chemical or abrasive wear of the conditioner
itself may be sufficient to require replacement of the disc within a few tens of hours. It is
therefore critical to develop materials and designs for diamond conditioning discs that resist
corrosion and abrasive wear while effectively refreshing the surface of the pad during CMP.
In this study, two novel Mitsubishi Materials Corporation diamond conditioners with different
designs were used in a copper CMP process. The surface of each conditioner was coated with a
polytetrafluroethelene (PTFE or TeflonTM) film to reduce substrate wear and chemical attack.
Each diamond disc was used to condition multiple IC-1000TM flat pads in a wear test comparable
in duration (30 hrs) to commercial disc lifetimes. Periodically during the wear experiments, the
conditioner was installed on a separate polishing tool for in situ polishing of copper wafers. Real
time shear force, pad temperature and copper removal rate were measured. Optical interferometry
and optical microscopy were performed on selected areas of the conditioner surfaces before and
after wear testing in order to characterize changes. Relationships between the coefficient of
friction, temperature, removal rates and changes in the discs are then explored theoretically.
Experimental
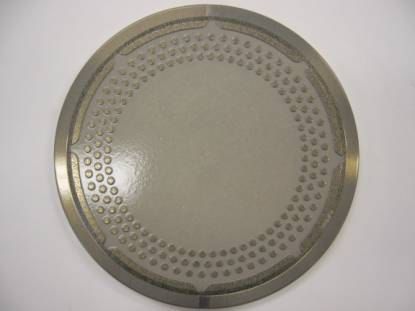
Figure 1 shows the two novel Mitsubishi Materials Corporation 100 mm diameter 100-grit blocky
type diamond conditioners used in this study. Figure 1(a) is the Mosaic design, in which
diamonds are distributed randomly at 34/mm2 except in roughly circular diamond-free zones that
are arranged in a hexagonal close packed pattern. Figure 1(b) is the triple ring dot, or TRD design.
In this design, diamonds are randomly distributed at 35/mm2 on three concentric circular rings of
raised circular dots or pillars and on a raised outer ring punctuated by eight flow channels. Both
conditioner surfaces were coated with 10 µm of PTFE to protect them from corrosion and
abrasive wear.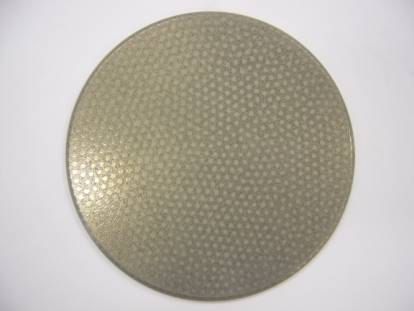
For each conditioner, the experiment consisted of an initial copper wafer polishing phase on a 200
mm Fujikoshi polisher followed by ten 3-hour cycles of accelerated wear testing on a 100 mm
polisher. Each wear cycle was followed with a copper wafer polishing measurement on the 200
mm polisher.

During the initial copper wafer polishing phase, the conditioner was used to break in an IC-
1000TM K-grooved pad for 30 min at 0.4 PSI using deionized (DI) water as the lubricant. The
same pad and the same conditioner kinematics were subsequently used for all copper polishing
experiments. Pad break-in was followed by 10 minutes of pad seasoning using 200 mm, 99.99%
pure copper discs. The shear force was monitored to insure that stable values were achieved prior
to copper wafer polishing. The metal stack of the 200 mm copper wafers that were used consisted
of 1.5 µm of electroplated copper on top of a 0.1 µm PVD copper seed layer and a 0.025 µm TaN
barrier. Each copper wafer was polished for 1 minute at 2.5 PSI and a sliding velocity of 1.2 m/s.
An Ohaus Analytical Plus balance was used to weigh wafers before and after polishing to
determine the mean removal rate. The polishing slurry in all phases of the experiment consisted
of 11.9 volume parts of Cabot Microelectronics Corporation iCue 5001TM slurry and 1 volume
part of 30% H2O2 applied at 220 ml/min on the 200 mm tool and 80 ml/min on the100 mm tool.
The pad temperature was measured using an infrared camera with accuracy of 0.1 °C at a
frequency of 3 Hz. During all polishing runs, shear force measurements were taken at 1000 Hz
and the average COF was obtained by dividing the average shear force by the applied normal
force.

After the initial wafer polishing phase, the conditioner was attached to the wafer carrier of the 100
mm polisher and used to abrade an IC-1000TM flat pad at 2 PSI and 0.62 m/sec for 3 hours. No
polishing was performed during this accelerated wear phase, but Cabot Microelectronics iCue
5001TM slurry was applied as in a normal copper process. The conditioner was then reinstalled on
the Fujikoshi polisher and used to polish 200 mm copper wafers on the original pad to complete
the cycle. Polishing was preceded by dressing of the pad at 0.4 PSI with DI water for 5 minutes,
followed by 5 minutes of copper disc polishing with in situ conditioning. The shear force was
again monitored until stable values were achieved. Wafer polishing conditions were identical to
the initial polishing phase.

Optical interferometry was performed on the diamond conditioner surface both before and after
the 30-hour conditioner wear and polishing process using a Wyco NT-3300 optical profiler. A
template was used to select the analysis regions to insure that the same areas were imaged before
and after the extended wear test. Optical microscopy photographs were also taken of the analysis
regions before and after testing.

Copper Polishing Results
As seen in Fig. 2, the mean COF measured when the Mosaic design was used increased
monotonically from 0.37 to 0.54 during the first five cycles, and then fluctuated around 0.5 for
the remaining cycles. While the initial temperature showed no trend with time (Fig. 3), a gradual
increase in the difference between the mean and initial pad temperatures can be seen in Cycles 0-
5. This increase is related to the increase in the COF during the same cycles. Variations in COF
also can be seen to follow variations in the pad temperature. Figure 4 shows the measured copper
removal rate. Except for the initial polish, the removal rate follows the same trend as the COF and
the mean pad temperature.

When the TRD design was used as the conditioner, there was a gradual upward trend in the COF
from about 0.25 to about 0.37 except for dips at Cycles 2 and 6 (Fig. 5). The COF induced by the
TRD design is less than that of the Mosaic design, indicating that the conditioners produced
different pad surface topography and mechanical contact conditions with the same accelerated
wear process. As for Mosaic, the initial temperature does not show a systematic increase or
decrease with time (Fig. 6), but there is a slight increase in the temperature rise with the number
of cycles that is consistent with the gradual rise in the COF. Similar to the Mosaic design, there is
a correlation between the measured temperatures and the COF. The mean pad leading edge and
initial temperatures are about the same as for Mosaic even though the COF is considerably lower.
There is again a strong correlation between the copper removal rate (Fig. 7) and both the pad
temperature and the COF.

Conditioner Wear Analysis
The method for matching and analyzing new and used interferometry images is described in [1].
Figure 8 shows matched new and used images of the Mosaic conditioner in a region near the disc
center. Coating material from the diamond-free zones appears to have been laterally displaced by
shear forces and plastic deformation, partly or totally covering some of the adjacent diamonds.
Contours around several diamonds taken at the same level can also be seen to tighten on the used
conditioner, indicating that PTFE coating immediately surrounding some of the diamonds has
also been displaced and that these diamonds are active.

Matched images of one of the pillars in the TRD design are shown in Fig. 9. After the wear test,
the pillar surface is flat except for a few protruding diamonds. There are two possibilities: either
the diamond-containing layer has been largely worn away, or the PTFE coating has simply been
smoothed over. In Fig. 10, we show new and used optical microscopy images of the same pillar.
These pictures show that all of the diamonds present at the beginning of testing remain after the
wear test. Therefore, the smooth pillar surfaces are due to plastic deformation and smoothing of
the PTFE by shear forces. The appearance of a flat surface is due to a difference in the
wavelength of light used by the interferometer (80 nm) and the optical microscope. The PTFE
coating is opaque at 80 nm but transparent to visible light, so only the coating surface is visible
by interferometry. This interpretation is consistent with partial or total obscuration of some
diamonds on the Mosaic disc due to movement of coating material from the diamond-free areas.

Analysis and Conclusions
First we discuss the temperature data. The mean pad temperature Tp is the sum of the initial
temperature Ta and an increment proportional to the COF,

                                          T p = Ta + cb µ k pV ,                                 (1)

where µk is the COF, p is the pressure, V is the sliding speed and cb is a constant. For both
conditioner designs, variations in the mean pad temperature can be accounted for by Equation (1).
However the data suggest that the COF not only causes variations in temperature but also is
affected by it.

We offer one possible explanation. In a previous paper [2], it is shown that the viscous shear
contribution to the COF is

                                          µ visc ∝ ( µ 0V / E ) 0.36 R −0.19 λ−0.17              (2)

where µ0 is the slurry viscosity, E is the pad modulus, and R is the mean asperity tip radius of
curvature. The parameter λ is a characteristic length that measures how abruptly the rough surface
of the pad terminates. A surface with asperities of more uniform height corresponds to a smaller
λ. R and λ should be affected by conditioning. A theoretical analysis [3] indicates that when the
pad cut rate is low, λ should vary inversely as the number of diamonds participating in cutting.
According to Equation (2), softening of the pad modulus E due to an increase in temperature
would increase the COF. The softening factor necessary to account for the initial increase in the
COF in the Mosaic experiments is about a factor of 3. While not a reasonable change given the
observed mean pad temperature, this much softening may be possible if the reaction temperature
T at the asperity tips,
T = Ta + cb µ k pV + ( β / V 1 / 2 + e ) µ k pV , (3)
is responsible for softening. In Equation (3), the additional term represents the asperity flash
heating increment [4]. A feedback mechanism is involved: fluctuations in Ta increase the COF,
which increases the second and third terms in Equation (3), further increasing the COF.
For the TRD design, there is in addition to the temperature-induced variations in COF (which are
weaker than for Mosaic) a slow increase of COF with time. To explain the overall COF increase,
we hypothesize that the PTFE layer is quickly smoothed in the early stages of accelerated wear
testing. Following this, the layer is slowly thinned by abrasion, gradually exposing more
diamonds. This increases the frequency of cutting of each contacting asperity, decreases both R
and λ, and increases the viscous contribution to the COF. In the Mosaic design, the COF initially
increases due to exposure of individual diamonds due to wear of the PTFE, which similarly
decreases R and λ,. This process then either saturates or is compensated for by an increase in the
number of diamonds partly or totally covered by migration of PTFE from the unpopulated areas.
The difference in the total number of active diamonds on the two designs, a factor of 2.5 in favor
of Mosaic, explains why Mosaic produces a higher COF than TRD. The larger active diamond
count produces lower values of both λ and R for Mosaic. If each of these parameters is decreased
by a factor of 2.5 in Equation (2), then the viscous contribution to the COF increases by a factor
of 1.4. The ratio of the Mosaic to TRD COF for the last 5 wear cycles is in fact about 1.5.
The pad temperature for TRD is also comparable to that for Mosaic in spite of a generally
lower COF. A larger value of R for TRD, driven by the lower diamond count, increases the
mean contact area per asperity according to Greenwood and Williamson contact theory [5]. Finite
element simulations of lubricated heat transfer to the asperity tips then indicate that a larger
fraction of the total frictional energy should be partitioned to the pad [4]. This compensates for
the lower COF.
For both conditioners, variations in the removal rate are controlled by both the mechanical shear
force and by the reaction rates that control the slurry behavior [4]. The chemical rates depend on
the temperature, which in turn depend on the mechanical shear force. Thus, removal rates for both
conditioners follow the trends in COF and temperature.
Finally, we remark that the PTFE coating on both conditioners provided protection from chemical
and abrasive attack. After 30 hours, there is no indication of a decline in performance. For the
TRD design, the coating not only reduces the overall COF but also provides a mechanism for
gradually exposing more diamonds to the pad.
References
[1] L. Borucki, Y. Sampurno, Y. Zhuang, A. Philipossian, T. Merchant and J. Zabasajja, “Measurement of
Diamond Conditioner Microwear”, Proc. of 22nd VLSI Multilevel Interconnection Conference
(VMIC), pp. 441-445 (2005)
[2] L. Borucki, Y. Zhuang and A. Philipossian, “Physics and Modeling of Fundamental CMP Phenomena”,
Proc. of 22nd VLSI Multilevel Interconnection Conference (VMIC), pp. 175-180 (2005).
[3] L.J. Borucki, T. Witelski, C.P. Please, P.R. Kramer and D. Schwendeman, “A Theory of Pad
Conditioning for Chemical Mechanical Polishing,” J. of Engineering Mathematics, 50, pp. 1-24 (2004).
[4] J. Sorooshian, L. Borucki, D. Stein. R. Timon, D. Hetherington, A. Philipossian, “Revisiting the
Removal Rate Model for Oxide CMP”, Trans. ASME J. Tribology, 127(3), pp. 639-651 (2005).
[5] K. L. Johnson, Contact Mechanics, Cambridge U. Press, 1985.Figures
(a) (b)
Figure 1: Mitsubishi Materials Corporation Mosaic (a) and TRD (b) conditioner designs.
0.6 34
Average pad temperature
32 Initial pad temperature
0.5 30
T a v e r a g e (°C )
COF
28
0.4 26
24
0.3 22
0 2 4 6 8 10 0 2 4 6 8 10
Cycle
Cycle
(a)
(b)
Figure 2: Mean COF during copper wafer Figure 3: Pad temperatures measured during
polishing using the Mosaic conditioner design. polishing using the Mosaic conditioner design.
5000 0.5
Removal Rate (A/min)
4500
0.4
4000
COF
3500 0.3
3000
0.2
2500
2000 0.1
0 2 4 6 8 10
0 2 4 6 8 10
Cycle
Cycle
Figure 4: Copper polish rates measured using Figure 5: Mean COF during copper wafer
the Mosaic conditioner design. polishing using the TRD conditioner design.32 4000
Av erage pad temperature
Initial pad temperature
Removal Rate (A/min)
30
3500
T averag e (°C ) 28
3000
26
2500
24
22 2000
0 2 4 6 8 10 0 2 4 6 8 10
Cycle Cycle
Figure 6: Pad temperatures measured during Figure 7: Copper polish rates measured
polishing using the TRD conditioner design. using the TRD conditioner design.
(a) (b)
Figure 8: Interferometry images of matched areas of a new (a) and used (b) Mosaic disc.
(a) (b)
Figure 9: Interferometry image of a TRD pillar before (a) and after (b) wear testing.
(a) (b)
Figure 10: Optical microscopy images of the new (a) and used (b) pillar in Fig. 9.You can also read