Dilemmas in the Management of Liminal Rodents-Attitudes of Dutch Pest Controllers
←
→
Page content transcription
If your browser does not render page correctly, please read the page content below
animals
Article
Dilemmas in the Management of Liminal
Rodents—Attitudes of Dutch Pest Controllers
Maite A.A.M. van Gerwen 1, * , Joachim Nieuwland 1 , Hein A. van Lith 2,3               and
Franck L.B. Meijboom 1,4
 1   Centre for Sustainable Animal Stewardship (CenSAS), Department Population Health Sciences, Faculty of
     Veterinary Medicine, Utrecht University, Yalelaan 2, 3584 CM Utrecht, The Netherlands;
     j.nieuwland@uu.nl (J.N.); f.l.b.meijboom@uu.nl (F.L.B.M.)
 2   Section Laboratory Animal Science/3Rs-Centre, Unit Animals in Science and Society, Department Population
     Health Sciences, Faculty of Veterinary Medicine, Utrecht University, Yalelaan 2,
     3584 CM Utrecht, The Netherlands; h.a.vanlith@uu.nl
 3   Brain Centre Rudolf Magnus, University Medical Centre Utrecht, Universiteitsweg 100,
     3584 CG Utrecht, The Netherlands
 4   Ethics Institute, Faculty of Humanities, Utrecht University, Janskerkhof 13,
     3512 BL Utrecht, The Netherlands
 *   Correspondence: m.a.a.m.vangerwen@uu.nl

 Received: 17 August 2020; Accepted: 7 September 2020; Published: 9 September 2020

 Simple Summary: Most people think the welfare of non-human animals matters. However, when it
 comes to rats and mice labeled as ‘pests’, welfare generally appears less important. Together with
 stakeholders in the field of pest management, we are working to develop a framework for less harmful
 rodent control that can be used by pest controllers. An online survey was carried out in order to find
 out to what extent Dutch pest controllers take the welfare of rats and mice into account as part of their
 profession. Our findings show that respondents pay attention to animal welfare and believe that
 some methods used cause severe animal suffering. Also, they think there are situations in which more
 attention for preventive methods (e.g., cleaning, removing food sources, or closing holes in a building)
 benefits both humans and pest animals. They indicate, however, that it is sometimes hard to include
 animal welfare in their work. An important reason for this is that clients do not always want to invest
 sufficient money in prevention. The findings of this study are useful for further conversations with
 pest controllers and their clients on how to safeguard animal welfare. Furthermore, they are relevant
 to the framework we are developing.

 Abstract: When non-human animals are labeled as ‘pests’, their moral status and welfare seem
 relatively unimportant. In a multi-stakeholder project, we develop an assessment frame for a more
 responsible rodent management that includes animal welfare. An online survey among 129 Dutch
 pest controllers was carried out in order to find out more about pest controllers’ attitudes about
 animal welfare. Respondents indicate to consider animal welfare in their job. They see differences in
 the welfare impact of different rodent control methods. A dilemma may occur when methods with a
 high impact, such as rodenticides, are ofttimes used in practice. Respondents also indicate that in
 different real-life scenarios (the hospital kitchen vs. the private backyard), a different weight may be
 attributed to the importance of animal welfare. Almost half of the respondents encounter difficulties
 when weighing animals against human interests. The problems are mainly related to clients who
 are not willing to invest sufficient money in preventive methods, where respondents do believe in.
 Some differences were found between respondents depending on membership of a professional
 association for pest controllers. The results of this study are relevant input for focus groups with pest
 controllers and their clients and for the development of the aforementioned assessment frame.

Animals 2020, 10, 1614; doi:10.3390/ani10091614                                 www.mdpi.com/journal/animals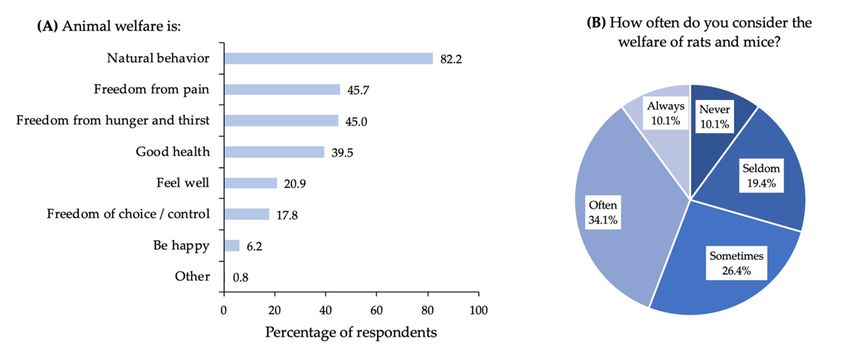
Animals 2020, 10, 1614                                                                               2 of 20

 Keywords: animal ethics; animal welfare; commensal rodents; liminal rodents; pest control; rodent
 control; rodent management

1. Introduction
     Discussions about the treatment and welfare of non-human animals (hereafter ‘animals’) usually
concern livestock, companion animals, laboratory animals, or large wild animals. However, the range
of human-animal interactions includes many more animals. These animals are neither wild, nor
domesticated. Living their lives amidst humans, between nature, and culture, these animals, such as
commensal rats, house mice, and pigeons can be considered liminal [1]. For the purpose of, e.g., food
safety, human and animal health, hygiene, and safety of stables, all over the world, unspecified but
large numbers of rats (Rattus norvegicus [2] and Rattus rattus [3]) and house mice (Mus musculus [3]) are
killed (with several methods inflicting significant levels of suffering [4]) because they are perceived as
‘pests’ or ‘vermin’. It is striking that once labeled as a pest animal, discussions on moral status and
welfare seem to disappear from both the scientific and public debate. In the relatively small amount
of papers on the treatment of these animals, authors point out the inconsistency in the treatment of
different animals depending on the context [5,6]. For instance, within the current legislation in most
Western societies, people have comparatively a lot of freedom to decide how to deal with these liminal
rodents that do not differ in their capacities to suffer compared to rats and mice in other practices, such
as the laboratory or as pets [7]. In scientific research for the production of rat poison, a rat will be
monitored and treated in accordance with humane endpoints (A humane endpoint can be defined
as: “the earliest indicator in an animal experiment of (potential) pain and distress that, within the
context of moral justification and scientific endpoints to be met, can be used to avoid or limit the
pain and distress by taking actions such as humane killing or terminating, or alleviating the pain and
distress” [8]) to prevent unnecessary suffering. A rat perceived as a pest animal often dies a slow
and painful death having ingested the same poison [6]. This inconsistency generally remains in the
background, as pest management is largely outsourced to professionals rendering the used control
measures a black box [6,7,9].
     In order to facilitate ethical decision-making and include the moral status and welfare of liminal
rodents in pest management, various authors have previously indicated animal research ethics as a
valuable source. This includes attention for animal welfare (e.g., minimizing suffering), as well as the
specific way of justifying actions by means of a decision-making framework [6,7,10–12]. Whereas in
the research context, animals are subjected to a wide range of different procedures that inflict suffering,
requiring ethical assessment, in pest management, the focus lies with the method of killing primarily.
The welfare implications of pest control methods are usually described by the amount of pain and
distress, the duration, the methods for killing, and the effects on animals that either escape from the
control or non-target species [4–7]. Broom [4] has classified different control methods by means of their
humaneness. Fast-acting killing traps are classified as humane, whereas slow-acting anticoagulants
(one of the most used control methods in the Netherlands and most other Western societies) are
classified as inhumane [4,5] or severe suffering [12].

1.1. Integrated Pest Management
     In the Netherlands, since 2017, the use of anticoagulant rodenticides requires a certification for
Integrated Pest Management (IPM) for the control of rats outside buildings [13]. According to the
IPM principles, preventive and non-chemical methods (e.g., mechanical killing traps) should be used
before rodenticides [see 6 for a description of IPM]. Preventive methods can consist of cleaning the
area, removing food sources, closing buildings, etc. While animal welfare appears a strong argument
to consider such a requirement, the primary motivation derives instead from environmental concerns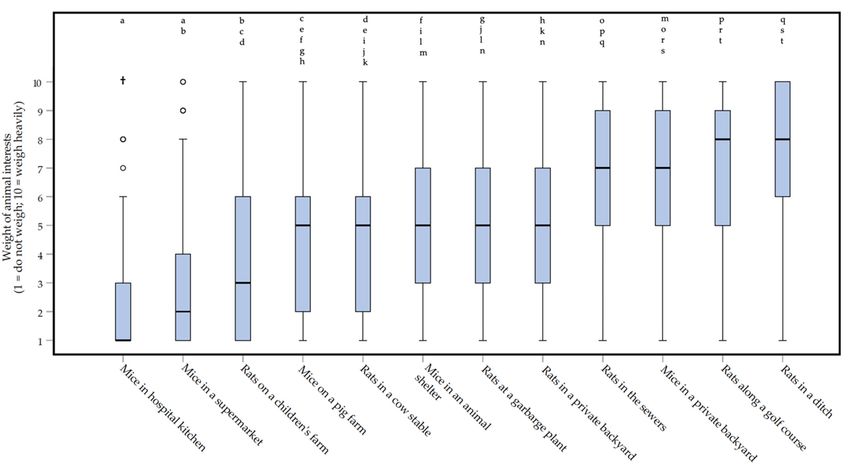
Animals 2020, 10, 1614                                                                              3 of 20

and the increasing resistance in rats against the poison. Nevertheless, the correct application of the
IPM principles with a focus on prevention benefits the interests of liminal rodents as well.

1.2. Stakeholder Views
     In 2018 the Centre for Sustainable Animal Stewardship (CenSAS) performed a stakeholder
consultation regarding the treatment of rats and mice perceived as pests [14]. Stakeholders (17 persons,
all Dutch) represented local and national government(s), animal protection NGOs (Non-governmental
organizations), pest controllers, food retail, agricultural sector, or were researchers or advisors in the
field of pest control and wildlife management. The consultation highlighted a shared need to take
the moral status and welfare of pest rodents more seriously. Everyone supported the need for better
application of preventive methods both by professionals and citizens. Control measures should be
categorized in terms of suffering, and their usage justified based on clearly stated conditions. Finally,
to better implement IPM and responsible rodent management, national coordination, and monitoring
under the responsibility of the government is considered crucial.
     The outcomes of this earlier study were the start of a multi-stakeholder project, initiated by,
and under the lead of CenSAS, for an assessment frame that contributes to more responsible rodent
management in which moral status and welfare of rodents are considered. In order to identify relevant
moral concerns and dilemmas, as well as to develop an adequate frame that will support ethical
decision-making in practice, the knowledge and experience of pest management professionals are
indispensable. An online survey among Dutch pest controllers was, therefore, carried out in order to
find out more about their attitudes regarding animal welfare in rodent control, their experiences of
(moral) dilemmas in practice, and possible ways (among which the use of an assessment frame) to
overcome these dilemmas.

2. Materials and Methods

2.1. Survey
      The online survey (details of the survey are available from the corresponding author upon demand)
was set up in Dutch using Google Forms. The answers were translated into English for the purpose
of this article. The link to the survey, together with the call to take part, was placed on the website
of CenSAS and spread via professional associations of pest controllers, newsletters, and websites of
stakeholder organizations, personal networks, and social media. No sample size had been predefined
since the main function of the survey was to provide a descriptive overview of views and opinions. The
survey was open during April and May 2019. The expected time to complete the survey was 15 to 20
min. The results were obtained and processed anonymously. Questions (37 in total) in the survey were
of different types using five-point Likert-style questions (never, seldom, sometimes, often, always),
10-response (equally spaced) interval rating scales from 1 (e.g., totally disagree or not important) to 10
(e.g., totally agree or very important), open, multiple-choice, and multiple response questions. A range
from 1 to 10 was used for the rating scales since this is a familiar range for Dutch people due to its
use for grading at schools. For some questions, respondents had the possibility to provide additional
information or add additional answers not provided in the lists. At the beginning of the survey, rats
and mice were specified as black and brown rats (Rattus rattus and Rattus norvegicus, respectively) and
house mice (Mus musculus).
      The survey was divided into six sections. The first section consisted of five statements about the
general perception of rats and mice, where respondents could agree with or not on a 1 (totally disagree)
to 10 (totally agree) rating scale.
      The second section about animal welfare consisted of six questions about the (relative)
importance of rodent welfare (Likert scales and 1 to 10 rating scales), conceptions of animal welfare
(multiple-response questions), the impact of 10 control methods in terms of animal suffering on a 1
(no welfare impact) to 10 (very large welfare impact) rating scale, and the motivation to improve rodent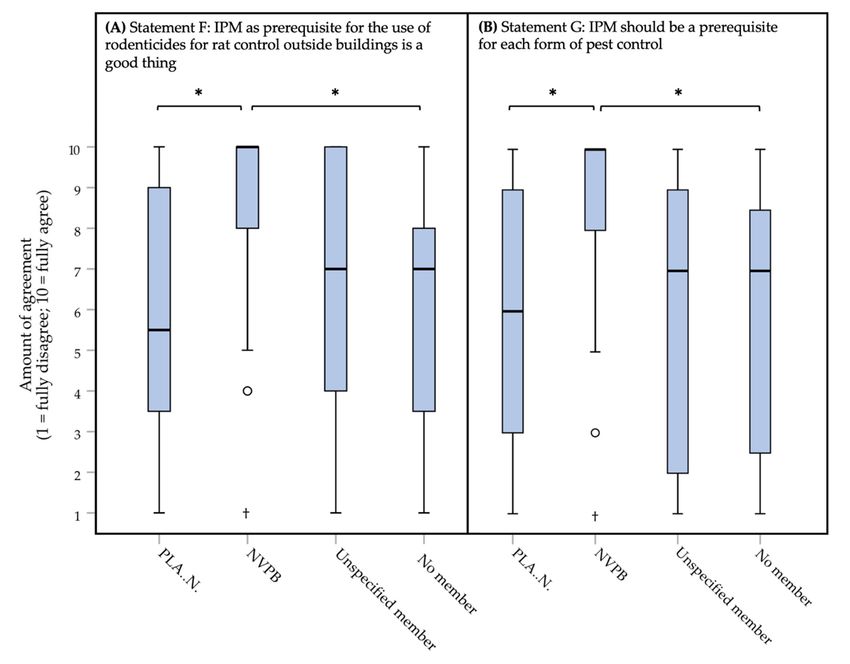
Animals 2020, 10, 1614                                                                              4 of 20

welfare in pest management on a 1 (I do not want to do more) to 10 (I want to do a lot more) scale. As a
further specification, animal interests were defined as ‘living, freedom, and welfare’.
     The third section consisted of questions about the type of clients (type of business, sector, etc.),
the amount of awareness among clients (Likert scales), and the client’s willingness to invest in
preventive methods on a 1 (no willingness) to 10 (much willingness) scale.
     The fourth section was to get insight into the attitudes towards existing regulations, IPM, and the
belief in prevention. The section consisted of three statements about regulations and IPM. It contained
one open question about prevention where respondents were asked to indicate what percentage of
nuisance could be solved by preventive methods only according to them.
     The fifth section about experience and decisions in daily practice consisted of questions about
important reasons to work as a pest controller on a 1 (very unimportant) to 10 (very important) rating
scale, the weight of (or space for) animal interests in 12 different real life scenarios on a 1 (animal
interests do not count) to 10 (animal interests count heavily) scale, the experience of problems or
dilemmas (multiple choice and open questions), and the possible solutions for these problems on a 1
(no added value for solving problems) to 10 (large added value for solving problems) scale.
     At the end of the survey (sixth section), several demographic data were collected, such as gender,
age, membership of a professional association for pest controllers, type of employment, and work
region. Furthermore, pest controllers were asked if they had taken any post-graduate course in ethics
for pest controllers. Membership of an association for pest controllers could be indicated on four
levels: a member of NVPB (Nederlandse Vereniging Plaagdiermanagement Bedrijven), member of
PLA..N. (Platform Plaagdierbeheersing Nederland), a member without specification of the association
(unspecified member), no member.

2.2. Statistical Analysis
       Analysis of the survey results was done with the IBM® SPSS® Statistics for Mac (Version 26)
computer program (IBM Corp., Armonk, NY, USA), using descriptive statistics and inferential statistics
for the interval rating data. For this type of data, the Friedman repeated measures test (omnibus) and the
Wilcoxon matched-pairs signed-ranks test (post-hoc) were used to test for differences between dependent
variables (e.g., ‘scored welfare impact of different control methods’ and ‘weight of animal interests
in different practical scenarios’). The Kruskal–Wallis test (omnibus) and Wilcoxon–Mann–Whitney
test (post-hoc) were used for testing differences between independent grouping variables (factors).
The following grouping variables were tested: (1) with or without post-graduate ethics education,
(2) membership of an association for pest controllers, and (3) ownership of companion animals.
Descriptive statistics of interval rating data (on a 1 to 10 scale) were provided as medians with
interquartile ranges (IQR) and displayed in box plots (also known as box-and-whisker plots). Box plots
show median values with IQR, highest and lowest non-outlying values (i.e., values up to 1.5 box
lengths from the upper or lower edge of the box). In the figures with the box plots (mild) outliers
(i.e., cases with values between 1.5 and three box lengths from the upper or lower edge of the box) and
extreme cases (i.e., cases with values more than three box lengths from the upper or lower edge of the
box) are also indicated.
       For the omnibus and post-hoc tests Monte Carlo (number of samples was 10,000) and exact p values
(two-tailed) were respectively calculated. To compensate for the increased chance of a type I error as a
consequence of multiple hypotheses testing, values of alpha (α) were adjusted with the Dunn–Šidák
correction. The formula for calculating the adjusted alpha was: αadj = 1 − [1 − α]1/γ ; in which γ is the
number of hypotheses tested (omnibus tests: ‘number of test variables’ multiplied by ‘the number
of omnibus tests performed’; post-hoc tests: ‘number of test variables’ multiplied by ‘the number of
omnibus tests performed’ multiplied by ‘the number of pairwise comparisons’) per topic, and α = 0.05.
The adjusted alpha values for each test used can be found in Supplementary Table S1. Significant
p values are marked with an asterisk (*) and are reported with six (e.g., p = 0.000414*) or seven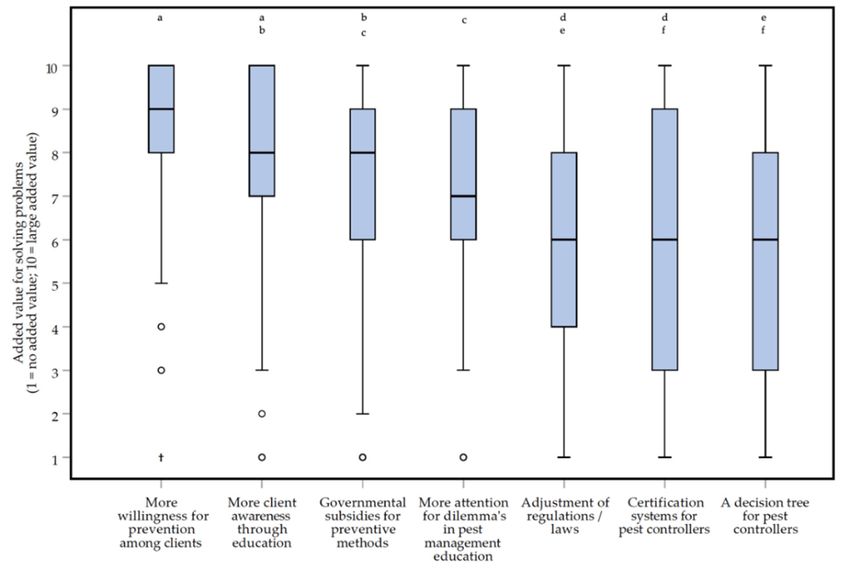
Animals 2020, 10, 1614                                                                                                      5 of 20

(p < 0.0000005*) decimal places, whereas non-significant p values are reported with two (e.g., p = 0.16)
to six digits (e.g., p = 0.00009) after the decimal point.
      Statistical significance represented by p values may not necessarily confirm practical importance.
In our opinion, the size of the observed effects is perhaps more important than statistical significance.
Therefore, besides p values, estimated effect sizes were calculated for both the omnibus and post-hoc
tests. Effect sizes reported comprise (1) Kendall’s W value for the Friedman repeated measures test,
(2) the eta squared value (η2 ) for the Kruskal–Wallis test, and (3) the correlation coefficient r for the
Wilcoxon matched-pairs signed-ranks test, and the Wilcoxon–Mann–Whitney test. The formulas [15]
are as follows:
                                                         χ2
                                                W =                                                     (1)
                                                      n(k − 1)
                                                               H−g+1
                                                       η2 =                                                                     (2)
                                                                n−g
                                                               Z
                                                           r = √                                                                (3)
                                                                 n
where ‘n’ is the number of observations (2 × 129 in case of the Wilcoxon matched-pairs signed-ranks
test), k is the number of repeated variables per topic, χ2 is the chi-square statistic for the Friedman
repeated measures test, H is the chi-square statistic for the Kruskal–Wallis test, g is the number of
groups per factor, and Z is the standardized z-score of the Wilcoxon matched-pairs signed-ranks test or
the Wilcoxon–Mann–Whitney test. The thresholds used for qualitative descriptions of the (absolute)
values of effect size (i.e., W, η2 , or |r|) are shown in Table 1. Exact p values and absolute effect sizes
for Wilcoxon matched-pairs signed-ranks test (post-hoc) could be found in the Supplementary Tables
S2–S9. The exact p values and absolute effect sizes for the Wilcoxon–Mann–Whitney test (post-hoc) can
be found in the Supplementary Table S10.

                                     Table 1. Thresholds for interpreting effect size.

                                         Thresholds Used for Qualitative Descriptions of Effect Size 2
  Effect Size Indices 1       Zero or Nearly Zero Effect            Small Effect        Moderate Effect          Large Effect
            W                         0 < W ≤ 0.1                  0.1 < W ≤ 0.3          0.3 < W ≤ 0.5            W > 0.5
            η2                        0 < η2 ≤ 0.01               0.01 < η2 ≤ 0.06       0.06 < η2 ≤ 0.14          η2 > 0.14
             r                         0 < |r| ≤ 0.1               0.1 < |r| ≤ 0.3        0.3 < |r| ≤ 0.5           |r| > 0.5
      1 Kendall’s W values were generated by IBM® SPSS® Statistics, whereas η2 and r values were computed via an
      online calculator [16]). 2 There is no consensus of to what constitutes a zero or nearly zero, small, moderate or large
      effect size. Cohen [17] gave some rules of thumb for the thresholds.

2.3. Ethical Approval
     For this type of research, no ethical approval is required in the Netherlands. The design and
analysis of the survey are in accordance with the code of conduct of the Association of the Universities
in the Netherlands and the General Data Protection Regulation (GDPR) of Utrecht University.

3. Results

3.1. Demographics
     The online survey was completed by 129 Dutch pest controllers (the respondents from now on),
mostly male (93.8%). Most respondents (41.9%) were between 41 and 50 years or between 51 and
67 (Dutch retirement age) years (31.0%) of age. Almost half of the respondents are employed by a
company (50.4%). Others are self-employed (21.7%), owners with employees (17.1%), employed by
a municipality (3.9%) or other (7.0%). Work regions were spread over the Netherlands and covered
all provinces. A majority (72.9%) indicated to be member of one of the two Dutch associations for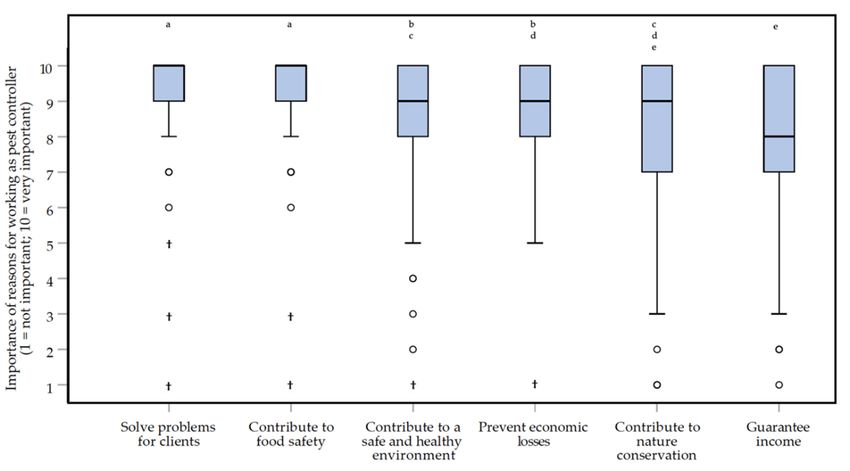
Animals 2020, 10, 1614 6 of 20
pest controllers (NVPB and PLA..N.). Almost half (47.3%) of the respondents took a post-graduate
(one-day) course in ethics for pest managers. Around two thirds (63.6%) of the respondents have one
or more hobby or companion animals, among which companion rodents (hamsters and guinea pigs,
but no rats and mice).
3.2. Effects of Grouping Variables
No statistically significant differences were found for the grouping variables (factors: ethics
course, companion animal, member of an association) for most test variables. Only for some test
variables of the topics ‘solutions for problems in practice’ and ‘attitude towards IPM’, differences were found
for membership of an association for pest controllers. These results will be shown in the particular
results section.
3.3. General Attitude of Liminal Rodents and IPM
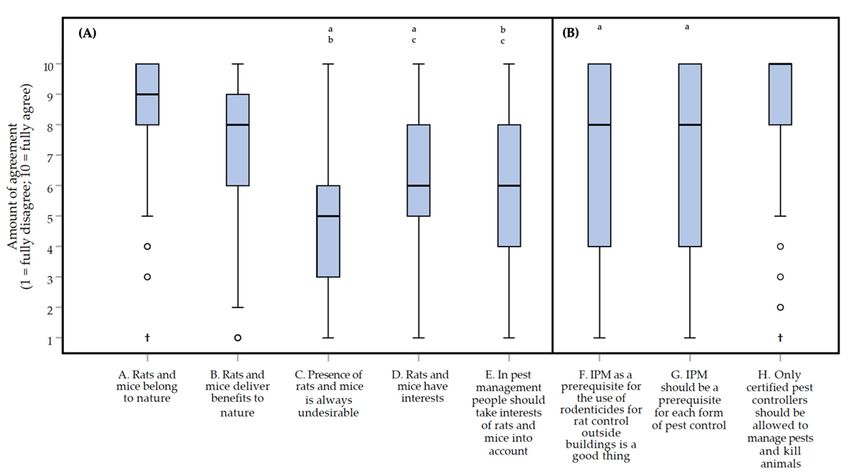
The box plots in Figure 1 show the responses to the statements about general attitudes of rats
and mice and IPM. There was a significant difference between the scores of the five statements (A–E,
Figure 1A) regarding the general attitude of liminal rodents (Friedman repeated measures test, df = 4:
X2 = 192.724, p < 0.0000005*, moderate effect, W = 0.373). The pairwise comparison of the five
statements showed that only the scores for statement E (‘In pest management, people should take interests
of rats and mice into account’) vs. statement C (‘Presence of rats and mice is always undesirable’), the scores
for statement E vs. those for statement D (‘Rats and mice have interests’), and the scores for statement C
vs. those for statement D were not significantly different from each other (Wilcoxon matched-pairs
signed-ranks test: E vs. C, Z = −2.494, p = 0.012, small effect, |r| = 0.155; E vs. D, Z = −1.405, p = 0.16,
zero or nearly zero effect, |r| = 0.087; C vs. D, Z = −3.484, p = 0.000414, small effect, |r| = 0.217).
Most respondents agreed with statements A that ‘Rats and mice belong to nature’ and B that ‘Rats and
mice deliver benefits to nature’. With a median score of 9 (on the 1 to 10 scale; IQR = 2) and 77.5% of
respondents giving a score of 8 or higher for statement A, and a median score of 8 (IQR = 3) and
79.8% of respondents giving a score of 6 or higher for statement B. Respondents tended to disagree
with statement C that ‘The presence of rats and mice is always undesirable’, with a median score of 5
(IQR = 3.5) and 55.8% of the respondents scoring between 3 and 6. Respondents tended to agree with
statement D that ‘rats and mice have interests’; with a median score of 6 (IQR = 3) and 64.3% of the
respondents scoring between 5 and 8. Respondents scored somewhat neutral for statement E that
‘In, pest management people need to take the interests of rats and mice into account’, with a median score
of 6 (IQR = 4) and 68.2% of respondents scoring between 4 and 8. Exact p values and effect sizes per
post-hoc comparison, can be found in Supplementary Table S2.
There was a significant difference between the scores of the three statements (F–H, Figure 1B)
regarding attitude towards IPM (Friedman repeated measures test, df = 2: X2 = 67.607, p < 0.0000005*,
small effect, W = 0.262). The pairwise post-hoc comparisons of the three statements showed that the
scores for statement H (‘Only certified pest controllers should be allowed to manage pests and kill animals’) vs.
those for statement F (‘IPM as a prerequisite for the use of rodenticides for rat control outside buildings is a
good thing’) or scores for statement H vs. those for statement G (‘IPM should be a prerequisite for each form
of a pest control’) were significantly different from each other (Wilcoxon matched-pairs signed-ranks
test: F vs. G, Z = −1.624, p = 0.105, small effect, |r| = 0.101; F vs. H, Z = −5.499, p < 0.0000005*, moderate
effect, |r| = 0.342; G vs. H, Z = −5.883, p < 0.0000005*, moderate effect, |r| = 0.366). Respondents were
relatively positive about IPM with a median score of 8 (IQR = 6) for the statements F and G. There was,
however, quite some variation, with 82.2% and 76.7% of respondents scoring between 4 and 10 for
statements F and G, respectively. Respondents fully agreed with the statement that ‘Only certified pest
controllers should be allowed to manage pests and kill animals’ (statement H) with a median score of 10
(IQR = 2). The exact p values and effect sizes per post-hoc comparison can be found in Supplementary
Table S3.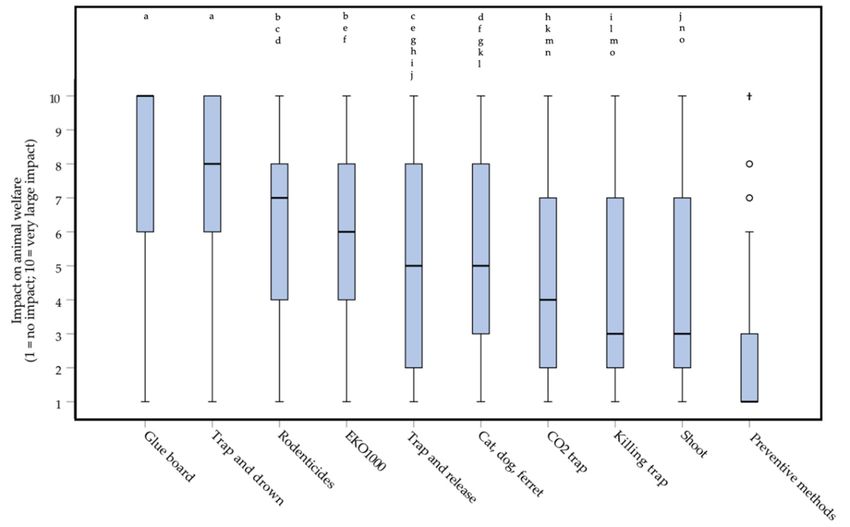
Animals 2020, 10, 1614 7 of 20
Animals 2020, 10, x 7 of 20
Figure
Figure 1. 1. Box
Box plots
plots presenting
presentingthetheamount
amountofofagreement
agreementwith withstatements
statements about
about thethe
general attitudes
general of
attitudes
rats (Rattus
of rats rattus
(Rattus rattus Rattus
andand norvegicus)
Rattus andand
norvegicus) micemice musculus)
(Mus(Mus (panel
musculus) (A), statements
(panel A–E)A–E)
(A), statements and IPM
and
(Integrated Pest Management)
IPM (Integrated Pest Management)regulations (panel(panel
regulations (B), statements F–H). F–H).
(B), statements The amount of agreement
The amount could
of agreement
be indicated
could on a 1 on
be indicated (fully
a 1 disagree) to 10 (fully
(fully disagree) to 10 agree) interval
(fully agree) rating rating
interval scale. scale.
Interests of ratsofand
Interests ratsmice
and
were defined as living, freedom, and welfare. Data were obtained through an online
mice were defined as living, freedom, and welfare. Data were obtained through an online survey survey among 129
Dutch
amongpest 129 controllers. Outliers andOutliers
Dutch pest controllers. extremeandcases are indicated
extreme cases are with o and †,with
indicated respectively. Differences
o and †, respectively.
between
Differencestwobetween
statements
twothat are not statistically
statements that are notsignificant aresignificant
statistically indicated are
with lower case
indicated letters
with lower above
case
the bars.
letters above the bars.
When
When looking
looking deeper
deeper intointo these
these results,
results, it it was
was found
found that that differences
differences in in agreement
agreement for for these
these
statements exist between different pest controller association memberships.
statements exist between different pest controller association memberships. There were significant There were significant
differences
differences (Kruskal–Wallis
(Kruskal–Wallis test, test, dfdf ==3)3)between
betweenpest pestcontroller
controllerassociation
association memberships
memberships forfor each
each of
of the three statements (Figure 2A, statement F: H = 22.973, p = 0.000100*,
the three statements (Figure 2A, statement F: H = 22.973, p = 0.000100*, small effect, η = 0.165; Figure small effect,
2 η 2 = 0.165;
Figure 2B, statement
2B, statement H = 20.642,
G: H =G:20.642, p < 0.0000005*,
p < 0.0000005*, small small η2 = η0.147;
effect,effect,
2 = 0.147; statement H: H = 13.425,
statement H: H = 13.425, p =
= 0.004100*,
p0.004100*, zero or nearly zero effect, η 2 = 0.090). After post-hoc testing, it was found that respondents
zero or nearly zero effect, η = 0.090). After post-hoc testing, it was found that respondents
2
being
being a member of
a member ofthe
theNVPB
NVPB(median
(medianofof 10,10,
IQR IQR = 2)=agreed
2) agreed significantly
significantly more morewithwith statement
statement F thanF
than respondents
respondents beingbeing
a member a member
of PLA..N. of PLA..N.
(median (median
of 5.5, IQRof 5.5, IQRU==5.75;
= 5.75; 322.5,UW==322.5,
1142.5,WZ== 1142.5,
−4.115,
Z = −4.115, p = 0.000023*, moderate effect, |r| = 0.475) or not being a member
p = 0.000023*, moderate effect, |r| = 0.475) or not being a member (median of 7, IQR = 5; U = 250.0, (median of 7, IQR =W5;
U = 250.0, W = 880.0, Z = −4.369, p = 0.000006*, large effect, |r| = 0.522). No
= 880.0, Z = −4.369, p = 0.000006*, large effect, |r| = 0.522). No significant differences were found significant differences were
found
between between respondents
respondents beingbeing
a membera member of NVPB
of NVPB and and respondentsbeing
respondents beingan anunspecified
unspecified member
member
(median of 7, IQR = 5; U = 194.5, W = 384.5, Z = −2.657, p = 0.007, small
(median of 7, IQR = 5; U = 194.5, W = 384.5, Z = −2.657, p = 0.007, small effect, |r| = 0.362). effect, |r| = Respondents
0.362). Respondents
being
being members
membersof ofthe
theNVPB
NVPB(median
(medianofof10, IQR= =2)2)also
10,IQR alsoagreed
agreed significantly
significantly moremorewith statement
with statement G,
than respondents
G, than respondents being a member
being a member of theofother association
the other (median
association of 6, IQR
(median = 6;
of 6, IQR U == 325.5, = 1145.5,
6; U =W325.5, W=
Z = −4.055, p = 0.000031*, moderate effect, |r| = 0.468) or not being
1145.5, Z = −4.055, p = 0.000031*, moderate effect, |r| = 0.468) or not being a member (median a member (median of 7, IQRof= 7;
7,
U = 289.0,
IQR = 7; UW= = 919.0,WZ==919.0,
289.0, −3.886, = 0.000067*,
Z =p −3.886, effect, |r| =effect,
moderatemoderate
p = 0.000067*, 0.464).
|r|Also, for this
= 0.464). statement,
Also, for this
no significant
statement, no differences
significant were found were
differences between found respondents being a member
between respondents beingofaNVPBmember andofunspecified
NVPB and
unspecified members (median of 7, IQR = 8; U = 184.5, W = 374.5, Z = −2.800, p = 0.005, small|r|effect,
members (median of 7, IQR = 8; U = 184.5, W = 374.5, Z = −2.800, p = 0.005, small effect, = 0.381).
|r|
After post-hoc
= 0.381). Aftertesting,
post-hocthere were
testing, no significant
there differences
were no significant (210.0 < U
differences < 608.0,
(210.0 < U 520.0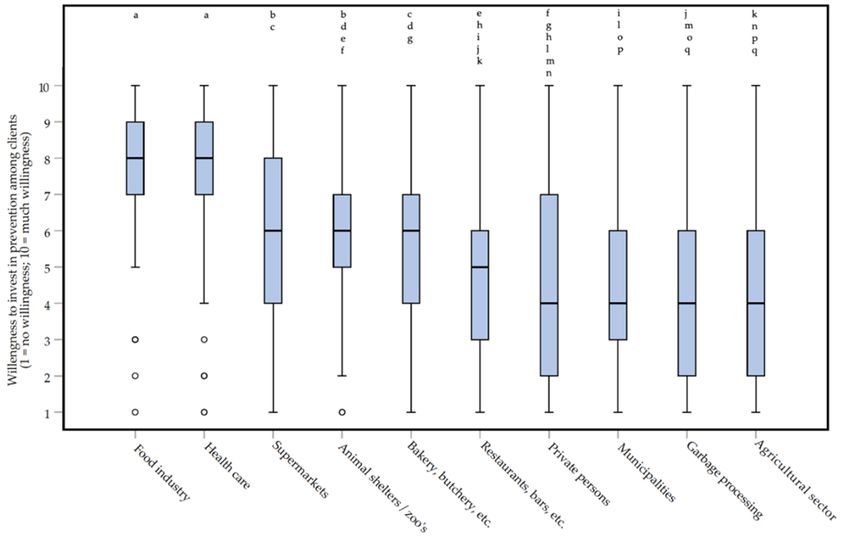
Animals 2020, 10, 1614                                                                                                       8 of 20
Animals 2020, 10, x                                                                                                          8 of 20

      Figure 2. Box plots presenting the amount of agreement with three statements (panel (A): statement F;
       Figure 2. Box plots presenting the amount of agreement with three statements (panel (A): statement
      panel (B): statement G) about the general attitudes of IPM (Integrated Pest Management). Amount
       F; panel (B): statement G) about the general attitudes of IPM (Integrated Pest Management). Amount
      of agreement could be indicated on a 1 (fully disagree) to 10 (fully agree) interval rating scale. Data
       of agreement could be indicated on a 1 (fully disagree) to 10 (fully agree) interval rating scale. Data
      were obtained through an online survey among the total 129 Dutch pest controllers about the treatment
       were obtained through an online survey among the total 129 Dutch pest controllers about the
      of rats (Rattus rattus and Rattus norvegicus) and mice (Mus musculus). Outliers and extreme cases
       treatment of rats (Rattus rattus and Rattus norvegicus) and mice (Mus musculus). Outliers and extreme
      are indicated with o and †, respectively. Statistically significant differences between two types of
       cases are indicated with o and †, respectively. Statistically significant differences between two types
      membership (PLA..N.: n = 40; NVPB: n = 35; Unspecified member: n = 19; No member: n = 35) are
       of membership (PLA..N.: n = 40; NVPB: n = 35; Unspecified member: n = 19; No member: n = 35) are
      indicated with * for each of the panels (A,B).
       indicated with * for each of the panels (A) and (B).
3.4. Animal Welfare
3.4. Animal Welfare
      At the beginning of the section about animal welfare, respondents were asked to indicate what
their At  the beginning
      understanding       ofof  the section
                              animal    welfare about     animal welfare,
                                                   is. Respondents            respondents
                                                                          could                 were asked
                                                                                  choose different       aspectsto (maximum
                                                                                                                    indicate what  of
their understanding        of animal     welfare    is. Respondents       could    choose    different
three) they consider being a part of animal welfare. As is shown in Figure 3A, ‘Natural behavior’ (in theaspects   (maximum        of
three) they
survey         consider
         mentioned         being a parttoofshow
                       as ‘possibility          animal     welfare.
                                                      natural          As is shown
                                                                 behavior’)   was theinaspect
                                                                                            Figure   3A, ‘Natural
                                                                                                   mostly   chosen behavior’
                                                                                                                       by 82.2% (inof
the  survey    mentioned      as  ‘possibility    to  show      natural   behavior’)     was   the  aspect
respondents, followed by ‘freedom from pain’, ‘freedom from hunger and thirst’, and ‘good health’. A number   mostly     chosen    by
82.2%
of      of respondents,
   23 respondents           followed
                       (17.8%    of the by   ‘freedom
                                          total) chosefrom onlypain’,  ‘freedom
                                                                  a single  aspectfrom   hunger
                                                                                      from   the and
                                                                                                  list.thirst’,
                                                                                                        ‘Naturaland   ‘good health’.
                                                                                                                    behavior’   was,
A this
in number
        case,ofchosen
                  23 respondents
                          by 20 (87.0%) (17.8%   of therespondents.
                                             of these       total) chose onlyOne arespondent
                                                                                      single aspect chosefromthethe   list. ‘Natural
                                                                                                                  option     ‘Other’,
behavior’indicating
thereby    was, in thisthat
                          case,
                              thechosen    by 20depends
                                   definition     (87.0%) of   onthese   respondents.
                                                                   the location     where  One
                                                                                             therespondent
                                                                                                  animals are.  chose    the option
                                                                                                                   A majority      of
‘Other’,  thereby    indicating     that   the  definition      depends     on   the   location
60.5% of the respondents indicated to consider the welfare of rats and mice in pest control often  where    the  animals      are. or
                                                                                                                                    A
majority of(see
sometimes     60.5%   of the
                    Figure     respondents
                            3B).                indicatedwere
                                   When respondents            to consider
                                                                     asked totheindicate
                                                                                  welfareon  of arats and
                                                                                                  1 (do     mice
                                                                                                          not     in pest
                                                                                                               want    to docontrol
                                                                                                                              more)
often  or  sometimes     (see  Figure    3B).  When      respondents      were   asked    to
to 10 (want to do a lot more) scale whether they want to do more for animal welfare in their indicate    on  a 1 (do   not  want
                                                                                                                          job,     to
                                                                                                                               there
do  more)   to 10  (want   to  do  a lot more)    scale    whether    they  want    to  do  more
was quite some variation. Some respondents would like to do (a lot) more, and some do not want to  for  animal   welfare     in their
job,more
do   thereatwas    quite some
             all. Almost    half ofvariation.   Some respondents
                                      the respondents        (49.6%) gave  would
                                                                             a score like  to do (a
                                                                                        between       lot) 7more,
                                                                                                   4 and     with aand     someofdo
                                                                                                                       median       5
not  want   to do
and an IQR of 4.   more    at all. Almost    half   of  the  respondents     (49.6%)     gave  a  score   between     4 and   7 with
a median of 5 and an IQR of 4.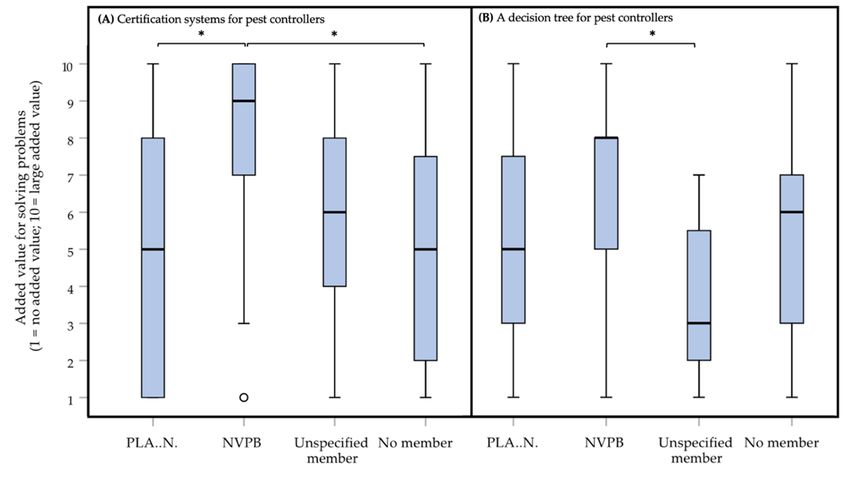
Animals 2020, 10, 1614                                                                                              9 of 20
 Animals 2020, 10, x                                                                                                  9 of 20

        Figure3.3.Panel
      Figure       Panel(A):
                         (A):bar
                               barchart
                                    chartpresenting
                                          presentingthethedefinition
                                                           definitionofofanimal
                                                                          animalwelfare
                                                                                  welfareaccording
                                                                                             accordingtotoDutch
                                                                                                           Dutchpest
                                                                                                                   pest
      controllers.
        controllers. Respondents could choose a maximum of three aspects being importantfor
                     Respondents     could   choose  a  maximum     of  three aspects    being  important    fortheir
                                                                                                                  their
      understanding
        understandingofofanimal
                            animalwelfare.
                                     welfare. The
                                               The numbers    show the
                                                   numbers show       the percentage
                                                                          percentage of of respondents
                                                                                           respondents whowho chose
                                                                                                               chose a
      a certain
        certain aspect.
                aspect. In
                         In the
                            the survey,
                                 survey, natural  behavior   was  mentioned    as the  ‘Possibility to show
                                          natural behavior was mentioned as the ‘Possibility to show natural natural
      behavior’.
        behavior’. Panel
                    Panel (B):
                           (B): pie
                                pie chart
                                     chart presenting
                                            presenting how
                                                        howoften
                                                              oftenthe
                                                                     thewelfare
                                                                          welfareofofrats   (Rattusrattus
                                                                                      rats(Rattus          andRattus
                                                                                                    rattusand   Rattus
      norvegicus) and mice (Mus musculus) is considered by Dutch pest controllers. The results were obtained
        norvegicus) and mice (Mus musculus) is considered by Dutch pest controllers. The results were
      from 129 Dutch pest controllers who participated in an online survey.
        obtained from 129 Dutch pest controllers who participated in an online survey.

       The box plots in Figure 4 show how important respondents found the welfare of rats and mice as
        The box plots in Figure 4 show how important respondents found the welfare of rats and mice
pest animals, and relative to the welfare of animals in other contexts. Respondents were somewhat
  as pest animals, and relative to the welfare of animals in other contexts. Respondents were somewhat
neutral (median score of 5, IQR = 4) about the importance of animal welfare for rodents as pest animals.
  neutral (median score of 5, IQR = 4) about the importance of animal welfare for rodents as pest
They found it not unimportant, nor important. Furthermore, there was quite some variation in their
  animals. They found it not unimportant, nor important. Furthermore, there was quite some variation
answers, with 55.0% of respondents scoring the importance between 4 and 7. This was in contrast
  in their answers, with 55.0% of respondents scoring the importance between 4 and 7. This was in
with the importance of animal welfare in other categories, for which the interquartile distance was
  contrast with the importance of animal welfare in other categories, for which the interquartile
1.3 to 2 times smaller. Respondents scored the importance of animal welfare differently depending
  distance was 1.3 to 2 times smaller. Respondents scored the importance of animal welfare differently
on the animal category (Friedman repeated measures test, df = 4: X2 = 260.596, p < 0.0000005*,         large
  depending on the animal category (Friedman repeated measures test, df = 4: Χ2 = 260.596, p <
effect, W = 0.505). It was found that respondents scored the importance of welfare for pest rodents
  0.0000005*, large effect, W = 0.505). It was found that respondents scored the importance of welfare
(‘Rats and mice as pest animals’ median of 5, IQR = 4) significantly (Wilcoxon matched-pairs signed-ranks
  for pest rodents (‘Rats and mice as pest animals’ median of 5, IQR = 4) significantly (Wilcoxon matched-
test) lower (p < 0.0000005*) than for the other animal categories; the associated effect sizes were large,
  pairs signed-ranks test) lower (p < 0.0000005*) than for the other animal categories; the associated
|r| > 0.5). Furthermore, the importance of welfare for ‘Laboratory animals’ was found to be less important
  effect sizes were large, |r| > 0.5). Furthermore, the importance of welfare for ‘Laboratory animals’ was
than for ‘Farm animals’ or ‘Companion animals’ (Wilcoxon matched-pairs signed-ranks test: ‘Laboratory
  found to be less important than for ‘Farm animals’ or ‘Companion animals’ (Wilcoxon matched-pairs
animals’ vs. ‘Farm animals’, Z = −4.553, p = 0.000001*, small effect, |r| = 0.283; ‘Laboratory animals’ vs.
  signed-ranks test: ‘Laboratory animals’ vs. ‘Farm animals’, Z = −4.553, p = 0.000001*, small effect, |r| =
‘Companion animals’, Z = −5.887, p < 0.0000005*, moderate effect, |r| = 0.367). The exact p values and
  0.283; ‘Laboratory animals’ vs. ‘Companion animals’, Z = −5.887, p < 0.0000005*, moderate effect, |r| =
effect sizes per post-hoc comparison, can be found in Supplementary Table S4.
  0.367). The exact p values and effect sizes per post-hoc comparison, can be found in Supplementary
       Respondents saw differences in the welfare impact of available control methods (Friedman
  Table S4.
repeated measures test, df = 9: X2 = 407.691, p < 0.0000005* , moderate effect, W = 0.351) (Figure 5).
        Respondents saw differences in the welfare impact of available control methods (Friedman
Post-hoc testing (Wilcoxon matched-pairs         signed-ranks test) showed that they think ‘Glue boards’
  repeated measures test, df = 9: Χ2 = 407.691, p < 0.0000005*, moderate effect, W = 0.351) (Figure 5). Post-
(median of 10, IQR = 4; maximal impact) and ‘Trap and drown’ (median of 8, IQR = 4) have a very
  hoc testing (Wilcoxon matched-pairs signed-ranks test) showed that they think ‘Glue boards’ (median
high impact on welfare (involving severe suffering), whereas ‘Killing trap’, ‘Shooting’, and ‘Preventive
  of 10, IQR = 4; maximal impact) and ‘Trap and drown’ (median of 8, IQR = 4) have a very high impact
methods’ had a much lower or almost no impact on welfare. The impact scores of ‘Glue boards’
  on welfare (involving severe suffering), whereas ‘Killing trap’, ‘Shooting’, and ‘Preventive methods’ had
and ‘Trap and drown’ were rated significantly higher than all other methods (−9.130 < Z < −4.786,
  a much lower or almost no impact on welfare. The impact scores of ‘Glue boards’ and ‘Trap and drown’
p < 0.0000005*, small to large effects, 0.297 < |r| < 0.569), but did not differ significantly from each
  were rated significantly higher than all other methods (−9.130 < Z < −4.786, p < 0.0000005*, small to
other (Z = −1.636, p = 0.10, small effect, |r| = 0.102). The impact score of ‘Preventive methods’ was rated
  large effects, 0.297 < |r| < 0.569), but did not differ significantly from each other (Z = −1.636, p = 0.10,
significantly lower than all other methods (−9.130 < Z < −5.568, p < 0.0000005*, moderate to large
  small effect, |r| = 0.102). The impact score of ‘Preventive methods’ was rated significantly lower than
effects, 0.346 < |r| < 0.569). The methods ‘Rodenticides’ and ‘EKO10000 scored a significantly higher
  all other methods (−9.130 < Z < −5.568, p < 0.0000005*, moderate to large effects, 0.346 < |r| < 0.569).
impact than the methods ‘CO2 trap’, ‘Killing trap’, and ‘Shooting’ (−6.671 < Z < −4.830, p < 0.0000005*,
  The methods ‘Rodenticides’ and ‘EKO1000′ scored a significantly higher impact than the methods ‘CO2
moderate effects, 0.301 < |r| < 0.416). The method ‘Cat, dog, ferret’ scored a significantly higher impact
  trap’, ‘Killing trap’, and ‘Shooting’ (−6.671 < Z < −4.830, p < 0.0000005*, moderate effects, 0.301 < |r| <
than ‘Shooting’ (Z = −4.915, p < 0.0000005*, moderate effect, |r| = 0.306).
  0.416). The method ‘Cat, dog, ferret’ scored a significantly higher impact than ‘Shooting’ (Z = −4.915, p
  < 0.0000005*, moderate effect, |r| = 0.306).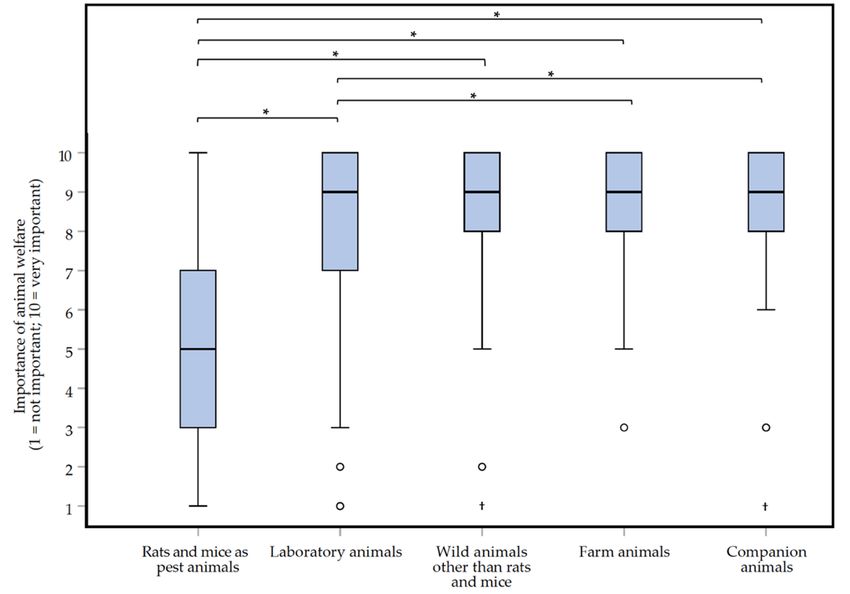
Animals 2020, 10, 1614 10 of 20
Animals 2020,
Animals 2020, 10,
10, xx 10 of
10 of 20
20
Figure
Figure
Figure 4.
Box
4. 4. Box
Box plots
plots
plots presentingthe
presenting
presenting thescored
the scoredimportance
scored importance of
importance of animal
animal welfare
animalwelfare for
welfarefor five
forfive different
fivedifferent
differentcategories
categories
categories of of
of
animals
animals according to 129 Dutch pest controllers participating in an online survey about
animals according to 129 Dutch pest controllers participating in an online survey about the treatment of
according to 129 Dutch pest controllers participating in an online survey about the
the treatment
treatment
of(Rattus
ratsof rats (Rattus
rats (Rattus rattusRattus
rattus rattus
and and Rattus
and Rattus norvegicus)
norvegicus) and mice
norvegicus) and(Mus
and micemusculus).
mice (Mus musculus).
(Mus musculus). The importance
The importance
The importance
could be could be
indicated
could be
indicated
onindicated on a
a 1 (not important)1 (not
on a 1 (not to important)
10 (very to
important) to 10 (very
important) important) interval
interval rating
10 (very important) rating
scale.
interval scale.
Outliers
rating Outliers and
and extreme
scale. Outliers extreme
cases are
and extreme
cases are
cases
indicated are indicated
indicated
with o and withwith
†, oo and
and †,
†, respectively.
respectively. respectively. Statistically
Statistically
Statistically significant
significantsignificant
differences differences
differences between
between between
two twocategories
two
animal animal
animal
categories
arecategories
indicatedare are indicated
indicated
with *. with *.
with *.
Figure
Figure
Figure Box
5. 5.
5. Box
Boxplots
plots
plotspresenting
presentingthe
presenting thewelfare
the welfareimpact
welfare impact of
impact ten methods
of ten
of methods
methods for forthe
for thecontrol
the controlof
control ofofrats
rats
rats (Rattus
(Rattus
(Rattus rattus
rattus
rattus
and Rattus
and Rattusnorvegicus)
norvegicus) and
and mice
mice (Mus
(Mus musculus),
musculus), according
according to 129
129 Dutch
Dutch pest
pest controllers
controllers
and Rattus norvegicus) and mice (Mus musculus), according to 129 Dutch pest controllers participating participating
participating
in an
in an
in an online
online
online survey.
survey.
survey. The
The
The impactcould
impact
impact couldbe
could beindicated
be indicatedon
indicated on aa 11 (no
on (no impact)
(noimpact)
impact)to to 10
to10 (very
10(very large
(verylarge
large impact)
impact)
impact) interval
interval
interval
rating
rating scale.
scale.
rating Outliers
Outliers
scale. Outliersandand extreme
andextreme cases
extremecases are
cases are indicated
are indicated with o
withooand
indicated with and †, respectively.
and†,†,respectively. Differences
respectively.Differences
Differences between
between
between
the
thethe
twotwo
two methods
methods
methods that
that are
that are
are notstatistically
not
not statisticallysignificant
statistically significant are
significant are indicated
are indicated with
indicated with letters
withletters above
lettersabove
abovethe the bars.
thebars.
bars.Animals 2020, 10, 1614 11 of 20
The control methods used by most respondents were ‘Killing trap’ (96.1% of respondents),
‘Rodenticides’ (88.4%) and ‘Preventive methods’ (87.6%). ‘Trap and release’ was used by 47.2% percent of
respondents, ‘EKO10000 by 35.7%, ‘CO2 trap’ by 18.6%, ‘Shooting’ by 17.1% and ‘Glue board’ by 10.9%.
Seven percent of respondents indicated using other methods than the ones mentioned in the list.
While ‘Rodenticides’ were used by almost 90% of respondents, this method was given a relatively
high welfare impact score (median of 7, IQR = 4). Its impact was scored significantly higher
(−8.625 < Z < −4.786, p < 0.0000005*, small to large effects, 0.298 < |r| < 0.537) than some commonly
used other methods (Figure 5), except when compared to ‘Trap and release’ (Z = −2.555, p = 0.010,
small effect, |r| = 0.159), ‘Cat, dog, ferret’ (Z = −2.938, p = 0.003, small effect, |r| = 0.183) or ‘EKO10000
(Z = −1.230, p = 0.220, zero or nearly zero effect, |r| = 0.077). The exact p values and effect sizes per
post-hoc test, can be found in Supplementary Table S5.
3.5. Decisions in Daily Practice
Besides the scoring of control methods on their welfare impact, respondents were asked to indicate
how important animal interests were for different real-life situations in rodent control. Respondents
indicated that in different situations, a different weight could be attributed to animal interests (Friedman
repeated measures test, df = 11: X2 = 636.188, p < 0.0000005*, moderate effect, W = 0.448) (Figure 6).
Post-hoc testing (Wilcoxon matched-pairs signed-ranks test) showed that whereas animal interests were
deemed of no or trivial importance in the management/control of ‘Mice in a hospital setting’ (median of 1,
IQR = 2), animal interests mattered much more when dealing with ‘Mice in a private backyard’ (median
of 7, IQR = 4.5) or ‘Rats in a ditch’ (median of 8, IQR = 4). For ‘Mice in a hospital kitchen’, the weight
of animal interests was scored significantly lower (−9.117 < Z < −5.874, p < 0.0000005*, moderate to
large effects, 0.366 < |r| < 0.568) than those for all other scenarios, except for ‘Mice in a supermarket’
(Z = −3.829, p = 0.000072, small effect, |r| = 0.238). The score for ‘Rats in a ditch’ was significantly higher
(−9.117 < Z < −7.405, p < 0.0000005*, moderate to large effects, 0.460 < |r| < 0.568) than for all other
scenarios, except when compared to ‘Rats along a golf court’ (Z = −2.288, p = 0.02, small effect, |r| = 0.142),
‘Rats in the sewers’ (Z = −3.660, p = 0.0002, small effect, |r| = 0.228), and ‘Mice in a private backyard’
(Z = −2.288, p = 0.00003, small effect, |r| = 0.252). The score for ‘Mice in a supermarket’ was significantly
higher (−8.749 < Z < −5.528, p < 0.0000005*, moderate to large effects, 0.366 < |r| < 0.568) than for all
other scenarios, except for ‘Mice in a hospital kitchen’ (Z = −3.829, p = 0.00007, small effect, |r| = 0.238)
and ‘Rats on a children’s farm’ (Z = −2.399, p = 0.02, small effect, |r| = 0.149). Scores with a median of 5,
were given to five of the scenario’s (‘Mice on a pig farm’, ‘Rats in a cow stable’, ‘Mice in an animal shelter’,
‘Rats at a garbage plant’, and ‘Rats in a private backyard’; Figure 5). There were no significant differences
between these scenarios (−3.800 < Z < −0.161, 0.00009 < p < 0.874, zero or nearly zero to small effects,
0.010 < |r| < 0.237). In Supplementary Table S6, the exact p values and effect sizes can be found. Besides
the differences between scenarios, the results indicated that respondents saw differences between rats
and mice. For example, the weight of interests of ‘Mice in a private backyard’ was scored significantly
higher than the interests of ‘Rats in a private backyard’ (Z = −6.804, p < 0.0000005*, moderate effect,
|r| = 0.424).Animals 2020, 10, 1614 12 of 20
Animals 2020, 10, x 12 of 20
Figure 6. Box
Figure plotsplots
6. Box presenting the importance
presenting of theof
the importance interests
the interests of rats rattus
of rats (Rattus (Rattusand Rattus
rattus andnorvegicus)
Rattus
andnorvegicus)
mice (Musandmusculus) in twelve different real-life scenarios in rodent control according to
mice (Mus musculus) in twelve different real-life scenarios in rodent control according129 Dutch
pest
tocontrollers,
129 Dutch pestparticipating
controllers, in an online survey.
participating Interests
in an online ofInterests
survey. rats andofmice were
rats and defined
mice as living,
were defined
freedom, andfreedom,
as living, welfare. and
Weight of interests
welfare. Weightcould be indicated
of interests could on
be aindicated
1 (do noton
weigh) to not
a 1 (do 10 (weigh
weigh)heavily)
to 10
(weigh
interval heavily)
rating scale.interval
Outliersrating scale. Outliers
and extreme and
cases are extremewith
indicated cases are †,
o and indicated with Differences
respectively. o and †,
respectively.
between the twoDifferences between
scenarios that thestatistically
are not two scenarios that are not
significant are statistically significant
indicated with are indicated
letters above the bars.
with letters above the bars.
3.6. Problems and Solutions in Daily Practice
3.6. Problems and Solutions in Daily Practice
In the survey, almost half of the respondents (45.7%) indicated encountering problems when
weighing In rodent interests
the survey, almost(e.g., animal
half of thewelfare,
respondents being(45.7%)
alive) against
indicated human interestsproblems
encountering (e.g., costs,whenfood
weighing
safety, rodent
hygiene). interestspercent
Fourteen (e.g., animal welfare, being
of respondents alive)
didn’t against
know andhuman
the rest interests
(40.3%)(e.g., costs, food
indicated to not
safety, hygiene).
encounter problems. Fourteen percent(64.9%)
The majority of respondents didn’t know
of the problems and the
indicated byrest (40.3%) indicated
respondents to not
(open response
encounter problems. The majority (64.9%) of the problems indicated by
question) were client-related. According to the respondents, a lot of clients lack the willingness torespondents (open response
question)
invest weremoney
sufficient client-related.
or effortsAccording
in preventive to themethods,
respondents, a lot being
the latter of clients lack the animal-friendly
a relatively willingness to
invest sufficient money or efforts in preventive methods, the latter being a
control method in the eyes of respondents (Figure 5). Furthermore, they think prevention is an effectiverelatively animal-friendly
control
control method
method. Whenin the eyes
they wereof asked
respondents (Figure5).
to indicate Furthermore,
what percentage they thinkcould
of nuisance prevention
be takenis away
an
effective control method. When they were asked to indicate what percentage of nuisance could be
by using preventive methods only, the average was 62.6%, with a standard deviation of 23.2%.
taken away by using preventive methods only, the average was 62.6%, with a standard deviation of
The extent to which clients are willing to invest in preventive methods differs across sectors
23.2%.
(e.g., food production, agricultural, health care, governments) where clients belong to (Friedman
The extent to which clients are willing to invest in preventive methods differs across sectors (e.g.,
repeated measures test, df = 9: X2 = 242.965, p < 0.0000005*, moderate effect, W = 0.342) (Figure 7).
food production, agricultural, health care, governments) where clients belong to (Friedman repeated
Post-hoc testing (Wilcoxon 2matched-pairs signed-ranks test) showed that respondents think that clients
measures test, df = 9: Χ = 242.965, p < 0.0000005*, moderate effect, W = 0.342) (Figure 7). Post-hoc
in food
testingindustry
(Wilcoxon andmatched-pairs
health care (medians
signed-ranksof 8 and
test)IQRs
showed of 2)that
invest significantly
respondents think more
that than
clientsclients
in
in other sectors (−8.703 < Z < −5.339, p < 0.0000005*, moderate to large
food industry and health care (medians of 8 and IQRs of 2) invest significantly more than clients in effects, 0.331 < |r| < 0.542).
Clients
otherin the agricultural
sectors (−8.703 < ZAnimals
Animals 2020,
2020, 10,
10, xx 13
13 of
of 20
20
Animals 2020, 10, 1614 13 of 20
respondents
respondents and and were
were scored
scored significantly
significantly higher
higher thanthan almost
almost all
all other
other possible
possible solutions
solutions provided
provided
(−8.384
(−8.384 < Z < −4.850, p < 0.0000005*, moderate to large effects, 0.301 < |r| < 0.522), except ‘Governmental
< Z < −4.850, p < 0.0000005*, moderate to large effects, 0.301 < |r| < 0.522), except ‘Governmental
< 0.0000005*,
psubsidies moderate to large effects, 0.301 < |r| < 0.522), except ‘Governmental subsidies for preventive
subsidies for
for preventive
preventive methods’
methods’ (Z
(Z == −2.954,
−2.954, pp == 0.003,
0.003, small
small effect,
effect, |r|
|r| == 0.184).
0.184). In
In Supplementary
Supplementary TableTable
methods’
S8, the (Z
exact = p−2.954,
values p =
and 0.003,
effectsmall
sizes effect,
can be |r| = 0.184).
found. In Supplementary Table S8, the exact p values
S8, the exact p values and effect sizes can be found.
and effect sizes can be found.
Figure 7. Box plots presenting the willingness to invest in prevention among clients in different sectors
Figure
Figure 7.7. Box
Box plots
plots presenting
presenting the
the willingness
willingness to to invest
invest in
in prevention
prevention among
among clients
clients in
in different
different
on a 1 (no willingness) to 10 (much willingness) rating scale. Willingness was indicated by 129 Dutch
sectors
sectors on a 1 (no willingness) to 10 (much willingness) rating scale. Willingness was indicated by
on a 1 (no willingness) to 10 (much willingness) rating scale. Willingness was indicated by 129
129
pest controllers, participating in an online survey about the treatment of rats (Rattus rattus and Rattus
Dutch
Dutch pest
pest controllers,
controllers, participating
participating in
in an
an online
online survey
survey about
about the
the treatment
treatment of
of rats
rats (Rattus
(Rattus rattus
rattus and
and
norvegicus) and mice (Mus musculus). Differences between the two clients that are not statistically
Rattus
Rattus norvegicus)
norvegicus) and mice
and with (Mus
miceletters musculus).
(Mus above
musculus). Differences
Differences between
between thethe two
two clients
clients that
that are
are not
not
significant are indicated the bars.
statistically significant are indicated with letters above the bars.
statistically significant are indicated with letters above the bars.
Figure 8. Box plots presenting the added value of different possible solutions for problems in practice
Figure
Figure 8.8. Box
Box plots
plots presenting
presenting the
the added
added value
value of
of different
different possible
possible solutions
solutions for
for problems
problems inin practice
practice
on a 1 (no added value) to 10 (large added value) rating scale. Solutions were scored by 129 Dutch
on
on a 1 (no added value) to 10 (large added value) rating scale. Solutions were scored by 129 Dutch
a 1 (no added value) to 10 (large added value) rating scale. Solutions were scored by 129 Dutch
pest controllers, participating in an online survey about the treatment of rats (Rattus rattus and Rattus
pest
pest controllers,
controllers, participating
participating in
in an
an online
online survey
survey about
about the
the treatment
treatment of
of rats
rats (Rattus
(Rattus rattus
rattus and
and Rattus
Rattus
norvegicus) and mice (Mus musculus). Differences between the two solutions that are not statistically
norvegicus)
norvegicus) and
and mice
mice (Mus
(Mus musculus).
musculus). Differences
Differences between
between the
the two
two solutions
solutions that
that are
are not
not statistically
statistically
significant are indicated with letters above the bars.
significant
significant are
are indicated
indicated with
with letters
letters above
above the
the bars.
bars.You can also read