Disaster Recovery Case Studies US 2005 Storms: Katrina, Rita and Wilma - Reinsurance // Property CAT

Page created by Tracy Washington
 
CONTINUE READING
Disaster Recovery Case Studies US 2005 Storms: Katrina, Rita and Wilma - Reinsurance // Property CAT
Reinsurance // Property CAT

Disaster Recovery Case Studies
US 2005 Storms: Katrina, Rita and Wilma
                                          In partnership with
Disaster Recovery Case Studies US 2005 Storms: Katrina, Rita and Wilma - Reinsurance // Property CAT
1

                                                                                                                                                                                 Introductory Commentary
                                                                                                                                                                                 Jonathan Gale, Chief Executive, Bermuda Reinsurance, XL Catlin

1   Introductory Commentary                                                                                                                                                      The important role of (re)insurance in the speed of physical and economic recovery after a major disaster,
                                                                                                                                                                                 especially when there is little to no coverage due to unavailability, insufficient capacity or lack of take up
    Jonathan Gale, XL Catlin
                                                                                                                                                                                 (predominantly because of economic reasons), has not really been studied in detail. The (re)insurance
2   Abstract                                                                                                                                                                     industry tends to focus on the potential for future events and events in the immediate past but we at
                                                                                                                                                                                 XL Catlin saw the need for a deeper understanding of the aftermath of disasters over a longer time frame, as
3   Background
                                                                                                                                                                                 well as an understanding of the impact that insurance penetration has on the pace of economic recovery.
4   Socioeconomic Impacts
                                                                                                                                                                                 Working with Cambridge Centre for Risk Studies at the University of Cambridge Judge Business School
4		        Economic Growth
                                                                                                                                                                                 (CCRS), we have identified 13 catastrophes across the world from 1998 to 2014 to be studied over a three-
4		        Labour Market                                                                                                                                                         year timeline to compare and contrast outcomes and establish some conclusions and recommendations.
                                                                                                                                                                                 Our original plan was to have one consolidated report released in 2020 but the Case Studies (this one
7		        Sectoral Impacts
                                                                                                                                                                                 covers Hurricane Katrina) produced by CCRS were so interesting and of such quality we thought it would be
7			Energy                                                                                                                                                                       beneficial to share these as they became available. CCRS will still issue a consolidated report in April 2020.
8			Housing
                                                                                                                                                                                 Our aim is for this work to be used as a tool by policymakers and governments worldwide when evaluating
10			Infrastructure                                                                                                                                                              disaster preparedness and seeking to fully understand, from the lessons learned by others, the impact of
                                                                                                                                                                                 displacement of populations; increasing personal debt levels; change in economic mix of industry; political
10			Construction
                                                                                                                                                                                 upheaval and overall time to recover, among other things.
10			Others
                                                                                                                                                                                 We also want to explain the marginal increased cost in relation to the value of rebuilding with resilience – what
12		       Social Impacts
                                                                                                                                                                                 we call “building back better” – over and above the cost of replacement. The (re)insurance industry needs
13		       Financial Markets                                                                                                                                                     to provide extra limit and contractual stipulations for “building back better” to minimize the impact of future
                                                                                                                                                                                 disasters.
14  Recovery
14         Disaster Management Efforts                                                                                                                                           Intuitively, we know the speed and scale of protection the (re)insurance industry provides dramatically
                                                                                                                                                                                 reduces the recovery time for communities which have suffered through extreme catastrophes. However, we
16		       Reconstruction and Recovery
                                                                                                                                                                                 believe that it is imperative that this be demonstrated in more detail with evidence and placed in front of the
18		 Insurance                                                                                                                                                                   right people to effect change.
19  Conclusions
                                                                                                                                                                                 Almost every event we’re focusing on in the 2020 report and associated Case Studies originates from
20  References                                                                                                                                                                   the world’s oceans. For the past three decades, XL Catlin has played a leading role in pushing for greater
                                                                                                                                                                                 understanding of our oceans, for example, supporting the Bermuda Institute of Ocean Sciences. We have
                                                                                                                                                                                 also sponsored independent scientific research into key ocean indicators including extensive work on coral
                                                                                                                                                                                 reefs, Arctic sea ice loss and raising awareness of increasing Ocean Risk, i.e., rising sea levels and sea surface
Report Citation:                                                                                                                                                                 temperatures, over-fishing, ocean deoxygenation, pollution and ocean acidity. This work has accelerated in
Cambridge Centre for Risk Studies and XL Catlin,                                                                                                                                 2018 with the inaugural Ocean Risk Summit held in Bermuda. The Summit, sponsored by XL Catlin and other
Disaster Recovery Case Studies, US 2005 Storms:                                                                                                                                  scientific and Bermuda-based partners, aimed to deepen understanding of Ocean Risk and bring together
Katrina, Rita, and Wilma, Sep 2018.                                                                                                                                              participants to try to tackle some of these broad ranging consequences.

Or                                                                                                                                                                               We are tying increased understanding and awareness of Ocean Risk together with the work by CCRS, making
                                                                                                                                                                                 a case for the societal benefit of increased (re)insurance penetration and, in September 2018, will be issuing
Mahalingam, A., Carpenter, O., Coburn, A.,                                                                                                                                       a special report detailing our own thoughts on the role governments could play in providing cover over and
Tuveson, M., Disaster Recovery Case Studies,                                                                                                                                     above the (re)insurance industry.
US 2005 Storms: Katrina, Rita, and Wilma,
Sep 2018.                                                                                                                                                                        The views, findings and opinions in this Case Study are those of the researchers at CCRS and not necessarily
                                                                                                                                                                                 those of XL Catlin. Notwithstanding this, we are proud to be associated with this project and are sure that
                                                                                                                                                                                 by gaining a greater level of understanding, we will ultimately develop more catastrophe business and, more
                                                                                                                                                                                 importantly, show the world the true value and social benefit of (re)insurance.
Disclaimer Information: The views contained in this report are entirely those of the research team of the Cambridge Centre for Risk Studies, and do not imply any
endorsement of these views by the organisations supporting the research, or our consultants and collaborators. The results of the research presented in this report are for
information purposes only. This report is not intended to provide a sufficient basis on which to make an investment decision.  The Centre is not liable for any loss or damage
arising from its use. Any commercial use will require a license agreement with the Cambridge Centre for Risk Studies.

Copyright © 2018 by Cambridge Centre for Risk Studies.
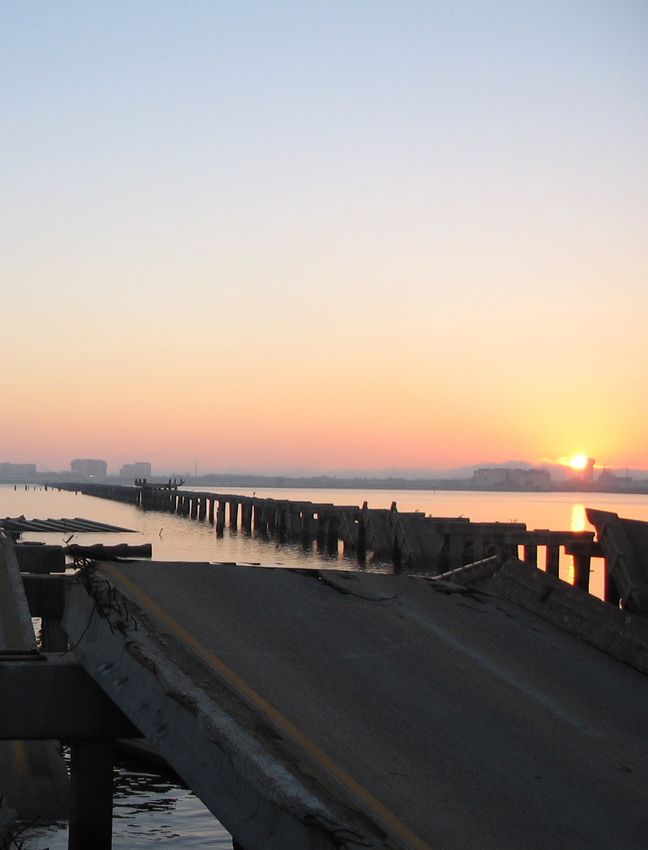
Disaster Recovery Case Studies US 2005 Storms: Katrina, Rita and Wilma - Reinsurance // Property CAT
2                                                                                                                                                                                                                                                                               3

Abstract                                                                                                                Background

Hurricane Katrina is considered as one of the    The storms such as Rita and Wilma that ensued made the                 The US Storms trio of 2005, viz., Katrina, Rita   Particularly, hurricane Katrina was one of the most devastating
                                                 negative effects pronounced. While at the national level, the                                                            hurricanes faced by the US in the last century and is the costliest
most expensive disasters in the history of the   impacts on GDP and unemployment were short-lived, their
                                                                                                                        and Wilma are the main events of focus in this    one ever to be recorded. Katrina made landfall along the Central
insurance industry.                              regional and local socioeconomic impacts were found to be very         case study.                                       Gulf Coast in Louisiana on Aug 29, 2005, as a Category-3
                                                 significant. The hurricane trio had a wide-range of effects on the                                                       hurricane with a windspeed of 125 MPH. It resulted in a storm
                                                 energy sector, housing, infrastructure, construction and, travel                                                         surge totalling 11 feet in New Orleans and 34 feet in Bay St. Louis
                                                 and tourism sectors in the Gulf states of the USA. Interestingly,                                                        and Waveland. In addition to this massive storm surge in these
                                                 the stock market had barely moved after the storms but the first                                                         areas, there were 8-15 inches of rainfall that occurred, which
                                                 CAT bond was triggered after Katrina. In addition to the impacts                                                         exacerbated the situation. These meteorological events led to
                                                 on the economy, several structural issues that were impediments                                                          breaches in three levees in New Orleans, which flooded more
                                                 to quick economic recovery were identified. The storms revealed                                                          than 80% of the total area. In effect, 23 coastal counties in four
                                                 several fundamental flaws in the management of hurricanes                                                                US states – Louisiana, Mississippi, Alabama and Florida were
                                                 characterized by inept disaster response and inefficiencies in                                                           affected, with a total span of 90,000 sq. miles. Figure 1 shows the
                                                 administration of aid after Katrina. The over-reliance on ex-post                                                        trajectory of Hurricane Katrina.
                                                 measures like federal disaster aid and the misuse of appropriated
                                                 funds by aid recipients only slowed the recovery process further.
                                                 Finally, inadequate risk differentiation of hazard zones, mispricing
                                                 of risks in coastal areas, lack of enforcement in the purchase of                                                          Figure 1. Trajectory of Hurricane Katrina before and after making landfall in Louisiana (Source: NOAA)

                                                 mandatory insurance and lack of incentives for improving private
                                                 insurance uptake were identified as some of the fundamental
                                                 problems plaguing the US, those of which warrant immediate
                                                 attention.

Cambridge Centre for Risk Studies
University of Cambridge Judge Business School

Trumpington Street
Cambridge, CB2 1AG
United Kingdom

enquiries.risk@jbs.cam.ac.uk
www.risk.jbs.cam.ac.uk
Disaster Recovery Case Studies US 2005 Storms: Katrina, Rita and Wilma - Reinsurance // Property CAT
4                                                                                                                                                                                                                                                                                                                                                                                                                5

                                                                                                                                                                                                                                                    Figure 3. Sectoral breakdown of changes in the employment sector of New Orleans
                                                                                                                                                                                                                                                                                                (Source: Dolfman and Bergman (2007))   New Orleans Tourism industry
Socioeconomic Impacts                                                                                                                                                                                                                                                                                                                  Over-the-year changes in employement, Jan 2004 - June 2006
                                                                                                                                                                                                                                                                                                                                         Change in
                                                                                                                                                                                                                                                                                                                                       employment
                                                                                                                                                                                                                                                                                                                                             5,000

                                                                                                                                                                                                                                                                                                                                                 0

                                                                                                                                                                                                                                                                                                                                            -5,000

                                                                                                                                                                                                                                                                                                                                           -10,000

                                                                                                                                                                                                                                                                                                                                           -15,000
Economic Growth                                                                                        Labour Market                                                                                                                The chief cause of the labour shortage, apart from migration of
                                                                                                                                                                                                                                                                                                                                           -20,000
                                                                                                                                                                                                                                    workforce to nearby cities, was the lack of housing facilities. In
At the national level, hurricanes (including the major ones) have                                      Local labour markets were the worst hit markets because of                                                                   fact, the demand shortages were quite pronounced that prices                                           -25,000
had very little impacts on economic growth and Katrina was no                                          the hurricanes. Over 600,000 in the Gulf region lost their jobs                                                              of houses rose by 10-20%. This includes damaged houses as
                                                                                                                                                                                                                                                                                                                                           -30,000
exception. The forecasters predicted lower GDP growth due                                              due to the storm event and this wiped out 11 years’ worth of                                                                 well. Moreover, it was not uncommon for roofless houses to be                                                 Jan Mar May Jul Sep Nov Jan Mar May Jul Sep Nov Jan Mar May
                                                                                                                                                                                                                                                                                                                                                           2004                    2005              2006
to the strength of the hurricane, however, ex-post the disaster                                        employment gains in total. The employment sector suffered                                                                    sold as-is in the second-hand housing market (Petterson et al.
there were little change to the actual GDP due to Katrina, Rita                                        a massive setback due to the storm and the inundation of the                                                                 2006). Due to the reduced supply of the housing materials and                                      New Orleans Professional Services sector
                                                                                                                                                                                                                                                                                                                                       Over-the-year changes in employement, Jan 2004 - June 2006
and Wilma. Figure 2 shows the graph of major US hurricanes and                                         commercial sectors that followed. Of all states that were affected,                                                          increased demand after the disaster, the total cost of building
                                                                                                                                                                                                                                                                                                                                         Change in
its impact on national GDP. It is clearfrom the figure that these                                      Louisiana suffered the worst hit. Particularly, 40% of New Orleans                                                           new houses had increased from $80/sq.ft to about $100/sq. ft).                                     employment
                                                                                                                                                                                                                                                                                                                                              500
hurricanes themselves are not severe detractors of economic                                            workforce were laid off or lost their workplace to the storm.                                                                All these factors further fuelled the wage increases, particularly in
                                                                                                                                                                                                                                                                                                                                                 0
growth for an economy of this size. It is noteworthy that while the                                    Consequently, the unemployment in the metropolitan region of                                                                 the construction sector. The quintessential feedback dynamics
effects of Katrina on economic growth at the national level is not                                     New Orleans rose from 5.8% to 14.8% within the span of a month                                                               of the macro-economy was at play here. It is to be noted that not                                        -500

significant, its regional impacts were devastating.                                                    (Petterson et al. 2006).                                                                                                     all sectors were affected in a similar fashion, which can be seen                                       -1,000

                                                                                                                                                                                                                                    from Figure 3. All sectors in New Orleans, except the construction                                      -1,500
The consensus is that Katrina resulted in economic damages of                                          The storms displaced a big fraction of the labour force for                                                                  sector (which gained from the disaster), were negatively affected.                                      -2,000
$108 billion to the US economy, of which about half of which were                                      a variety of reasons. For instance, after the event, the total                                                               The aggregate change in employment in New Orleans after                                                 -2,500
uninsured according to Swiss Re estimates. (Hallegatte 2008)                                           population of New Orleans decreased to half of its 2000 levels.                                                              Katrina is shown in Figure 5 (shown on page 6).                                                         -3,000
estimates that in addition to the direct losses report there were                                      Several homes were evacuated and only about half of those                                                                                                                                                                            -3,500
indirect losses which added another layer of 28% of the total                                          displaced returned to their base within three months after the                                                            A year after Katrina, the average real wages had increased                                                 -4,000
losses to the total damage estimates. Katrina was one of the                                           event. Six years after the event, the total population was only                                                           while the employment prospects were still bleak. During this                                                     Jan Mar May Jul Sep Nov Jan Mar May Jul Sep Nov Jan Mar May
                                                                                                                                                                                                                                                                                                                                                           2004                    2005              2006
most devastating hurricanes in the history of the US, particularly                                     75% of its 2000 levels, which marks a new equilibrium. The                                                                time, the construction sector got a boost in activity due to
                                                                                                                                                                                                                                New                                                                                                    New Orleans Port Operations industry
due to the significant damages at the regional levels and the                                          returns were slow in comparison to what was expected in a                                                                 the Orleans
                                                                                                                                                                                                                                Over-the-year
                                                                                                                                                                                                                                                 Tourism industry
                                                                                                                                                                                                                                      reconstruction
                                                                                                                                                                                                                                                changes and  house rebuilding
                                                                                                                                                                                                                                                        in employement,        efforts
                                                                                                                                                                                                                                                                         Jan 2004 - Juneon which New
                                                                                                                                                                                                                                                                                         2006                                          Over-the-year changes in employement, Jan 2004 - June 2006
losses incurred by the insurance sector.                                                               developed country. A key factor that drove the slow recovery                                                              Orleans
                                                                                                                                                                                                                                  Change in
                                                                                                                                                                                                                                            residents  engaged.   Job cuts  were  rampant   during                                       Change in
                                                                                                       of the labour force was the existing (now exacerbated) poverty                                                            this period consistent with the unfavourable macroeconomic
                                                                                                                                                                                                                                employment                                                                                             employment
                                                                                                                                                                                                                                      5,000                                                                                                  2,000
                                                                                                       of the areas in question. Figure 4 shows the recovery trends of                                                           situation of the city. Most of the job cuts were at the level of the                                        1,500
                                                                                                       the labour market in counties affected by Katrina and provides a                                                          local government,
                                                                                                                                                                                                                                          0             which were aggressive with their expenditure                                         1,000
                                                                                                       comparison across different disasters in the US. It is noteworthy                                                         cuts.  As
                                                                                                                                                                                                                                     -5,000
                                                                                                                                                                                                                                            a result, the job losses to the private sector were heavily                                        500
                                                                                                                                                                                                                                                                                                                                                 0
                                                                                                       that of all the natural disasters being compared, recovery in terms                                                       moderated. Figure 7 (see page 6) shows the distribution of
                                                                                                                                                                                                                                                                                                                                               -50
                                                                                                       of employment due to Katrina has been the slowest.                                                                        the-10,000
                                                                                                                                                                                                                                      change in employment a year after Katrina in both private                                              -1000
                                                                                                                                                                                                                                 and  public sectors. It is clear from the figure that the private
                                                                                                                                                                                                                                    -15,000                                                                                                 -1,500
                                                                                                                                                                                                                                                                                                                                            -2,000
                                                                                                                                                                                                                                      -20,000                                                                                               -2,500
Figure 2. Impacts of major hurricanes on country GDP (Source: Rutgers Real Estate)                     Figure 4. Impacts on the labour market in Katrina affected areas (Source: US Bureau of Labor Statistics)                                                                                                                             -3,000
                                                                                                                                                                                                                                      -25,000                                                                                               -3,500
                                                                                                                                                                                                                                                                                                                                            -4,000
                                                                                                                                                                                                                                      -30,000
    Real GDP (%Q/Q SAAR) five quarters before and after                                                  Employment in large areas affected by Katrina                                                                         Employment trends
                                                                                                                                                                                                                                     Jan Mar May Julbefore
                                                                                                                                                                                                                                                     Sep Nov and  after
                                                                                                                                                                                                                                                             Jan Mar May past
                                                                                                                                                                                                                                                                         Jul Sepdisasters
                                                                                                                                                                                                                                                                                 Nov Jan Mar                       May                             Jan Mar May Jul Sep Nov Jan Mar May Jul Sep Nov Jan Mar May
                                                                                                                                                                                                                                                                                                                                                            2004                    2005              2006
                                                                                                                                                                                                                              Index: Disaster date2004
                                                                                                                                                                                                                                                  = 100                              2005                   2006
    major hurricanes                                                                                    July 2005 - August 2006                                                                                                                                      Hurrican Andrew
                                                                                                                                                                                                                                New Orleans Professional Services sector
                                                                                                                                                                                                                              115                                   (Miami-Dade Cty)                                                   New Orleans Construction sector
      %                                                                                                300,000                                                                                                                  Over-the-year changes in employement, Jan 2004 - June 2006                                             Over-the-year changes in employement, Jan 2004 - June 2006
      6                                                                                                                                                                                                                       110                                                                                                        Change in
                                                                                                                                                                                                                                  Change in                                                                                            employment
                                                                                             Andrew    250,000                                                                                                                  employment
                                                                                                                                                                                                                              105                                                                                                            2,000
                                                                                                                                                                                                                                       500                                                           Northridge Earthquake
                                                                                                       200,000                                                                                                                                                                                             (los Angeles Cty)                 1,500
       4                                                                                                                                                                                                                      100           0
                                                                                                                                                                                                                                                                                                                                             1,000
                                                                                             Katrina                                                                                                                                     -500                                                        9/11 Attack, NYC
                                                                                                       150,000                                                                                                                 95                                                                                                              500
                                                                                                                                                                                                                                                                                              (Employment back in line
       2                                                                                                                                                                                                                               -1,000                                                        w/existing trend(                           0
                                                                                                       100,000                                                                                                                 90
                                                                                                                                                                                                                                       -1,500                                                                                                 -500
                                                                                                         50,000                                                                                                                85      -2,000                                                                                                -1,000
       0                                                                                                                                                                                                                                                                                                                                     -1,500
                                                                                                                                                                                                                                                                                                   Hurricane Katrina
                                                                                             Sandy              0                                                                                                              80      -2,500                                               (New Orleans metro area)                        -2,000
                                                                                                                    Jan Aug       Sep Oct Nov Dec                Jan     Feb     Mar     Apr May Jun              Jul   Aug            -3,000
      -2                                                                                                                            2005                                                   2006                                75                                                                                                           -2,500
             -5      -4      -3     -2      -1      0       1       2       3        4   5                                                                                                                                             -3,500                                                                                               -3,000
                           Time (in quarters) since major hurricanes                                                      Jefferson Parish            OrleansParish            Harrison County                                 70
                                                                                                                                                                                                                                       -4,000
                                                                                                                                                                                                                                    -12-9 -6 -3 0 3 6 9 12 15 18 21 24 27 30 33 36 39 42 45 48 51 54 57 60 63 66                            -3,500
                                                                                                                                                                                                                                                                                                                                                  Jan Mar May Jul Sep Nov Jan Mar May Jul Sep Nov Jan Mar May
                                                                                                                                                                                                                                             Jan Mar May Jul Sep Nov Jan Mar May Jul Sep Nov Jan Mar May                                                   2004                    2005              2006
                                                                                                                                                                                                                                                      2004                    2005              2006
Disaster Recovery Case Studies US 2005 Storms: Katrina, Rita and Wilma - Reinsurance // Property CAT
6                                                                                                                                                                                                                                                                                                                                                                                                                                                                 7

                                                                                                                                                                                                                                                                                  Sectoral Impacts

Figure 5. Total changes in the employment sector of New Orleans after Katrina (Source: Dolfman and                                                                                                                                                                                                                                                     Figure 8. Gulf of Mexico crude oil and natural gas production trends since 2005 (Source: EIA)
Bergman (2007))
                                                                                                     Figure 6. Trends in unemployment insurance claims (Source: Calculated Risk blog)
                                                                                                                                                                                                                                                                                  Energy
    New Orleans: Over-the-year changes in employment                                                  Unemployment Insurance weekly claims and recessions
                                                                                                      4 week moving average                                                                                                                                                       Most of the areas that were affected were quite key to the US         Crude oil and natural gas production in the federal offshore
    January 2004 - June 2006                                                                                                                                                                                                                                                                                                                            Gulf of Mexico (2005-2015)
                                                                                                                                                                                                                                                                                  national energy supply system. The location of impact being                Million barrels per day          Billion cubic feet per day
                                                                                                              700                             9/11                               Hurricane                                           Superstorm
      Change in employment                                                                                                                                                                                                                                                        close to the Gulf of Mexico makes it a prime spot for severe
            0                                                                                                                                                                    Katrina                                             Sandy
                                                                                                              600                                                                                                                                                                                                                                              Katrina               Erin   Gustav        Ida Bonnie       Lee    Isaac     Karen
     -10,000
                                                                                                                                                                                                                                                                                  disruptions to oil and gas production. After Katrina, over 50% of             (H5)                 (TS)    (H4)        (H2) (H3)         (TS)    (H1)      (TS)
                                                                                                              500                                                                                                                                                                 crude oil and natural gas production in the Gulf were considered     2.0
    -20,000
    -30,000                                                                                                   400
                                                                                                                                                                                                                                                                                  non-productive, referred to as a “shut-in”. The recovery was
    -40,000                                                                                                                                                                                                                                                                       moderate, with only a quarter shut-in by the end of 2005.            1.5
                                                                                                              300
    -50,000                                                                                                                                                                                                                                                                       Furthermore, more than 90% of the oil production were left
    -60,000                                                                                                   200                                                                                                                                                                 unusable after Katrina, only to be completely shut down after
                                                                                                                                                                                                                                                                                                                                                       1.0
    -70,000
                                                                                                              100                                                                                                                                                                 Rita, a month later. About $38 billion in revenues from production
    -80,000                                                                                                                                                                                                                                                                       of 153 million oil barrels were missed due to the shut-in process
                                                                                                                    0                                                                                                                                                                                                                                  0.5
    -90,000                                                                                                                                                                                                                                                                       (Petterson et al. 2006). Figure 8 shows the drop in crude oil and

                                                                                                                     00

                                                                                                                               01

                                                                                                                                          02

                                                                                                                                                    03

                                                                                                                                                                  04

                                                                                                                                                                        05

                                                                                                                                                                                 06

                                                                                                                                                                                       07

                                                                                                                                                                                                08

                                                                                                                                                                                                     09

                                                                                                                                                                                                            10

                                                                                                                                                                                                                     11

                                                                                                                                                                                                                           12

                                                                                                                                                                                                                                    13

                                                                                                                                                                                                                                           14

                                                                                                                                                                                                                                                  15

                                                                                                                                                                                                                                                          16

                                                                                                                                                                                                                                                                    17

                                                                                                                                                                                                                                                                             18
                                                                                                                  20

                                                                                                                            20

                                                                                                                                       20

                                                                                                                                                 20

                                                                                                                                                            20

                                                                                                                                                                       20

                                                                                                                                                                               20

                                                                                                                                                                                      20

                                                                                                                                                                                            20

                                                                                                                                                                                                 20

                                                                                                                                                                                                          20

                                                                                                                                                                                                                 20

                                                                                                                                                                                                                          20

                                                                                                                                                                                                                                20

                                                                                                                                                                                                                                         20

                                                                                                                                                                                                                                                20

                                                                                                                                                                                                                                                         20

                                                                                                                                                                                                                                                               20

                                                                                                                                                                                                                                                                         20
     -100,00                                                                                                                                                                                                                                                                      natural gas production in the Gulf of Mexico. The only other
                                                                                                               1/

                                                                                                                          1/

                                                                                                                                    1/

                                                                                                                                               1/

                                                                                                                                                          1/

                                                                                                                                                                   1/

                                                                                                                                                                            1/

                                                                                                                                                                                    1/

                                                                                                                                                                                           1/

                                                                                                                                                                                                 1/

                                                                                                                                                                                                        1/

                                                                                                                                                                                                                1/

                                                                                                                                                                                                                      1/

                                                                                                                                                                                                                               1/

                                                                                                                                                                                                                                     1/

                                                                                                                                                                                                                                              1/

                                                                                                                                                                                                                                                         1/

                                                                                                                                                                                                                                                              1/

                                                                                                                                                                                                                                                                         1/
                                                                                                              1/

                                                                                                                       1/

                                                                                                                                  1/

                                                                                                                                            1/

                                                                                                                                                       1/

                                                                                                                                                                  1/

                                                                                                                                                                            1/

                                                                                                                                                                                 1/

                                                                                                                                                                                         1/

                                                                                                                                                                                                1/

                                                                                                                                                                                                      1/

                                                                                                                                                                                                                1/

                                                                                                                                                                                                                     1/

                                                                                                                                                                                                                             1/

                                                                                                                                                                                                                                     1/

                                                                                                                                                                                                                                            1/

                                                                                                                                                                                                                                                     1/

                                                                                                                                                                                                                                                              1/

                                                                                                                                                                                                                                                                     1/
    -110,000
                Jan Mar May Jul Sep Nov Jan Mar May Jul Sep Nov Jan Mar May
                                                                                                                                                                                                                                                                                  hurricane in the tens years since Katrina to have made a visible     0.0
                                                                                                                                                                                                                                                                                                                                                         2005        2006    2007      2008       2009    2010      2011    2012     2013     2014      2015
                         2004                    2005              2006                                                                                                                                                                                                           impact was Gustav in 2008.

                                                                                                                                                                                                                                                                                  Due to the shut-in, spot prices of gas rose immediately by           Table 1. Recovery of retail gas prices after Katrina (CCRS calculations using MERIC data)
construction sector was the only beneficiary of the monstrous                                        Figure 7. Wage growth and health of the employment sector a year after Katrina
                                                                                                     Effects of Katrina on New Orleans
                                                                                                     (Source:      Dolfman and Bergman (2007))
                                                                                                                                                                                                                                                                                  30%. However, it recovered back to its baseline values within
hurricane, marked by increased year-on-year employment and                                                                                                                                                                                                                        a weeks’ time, which was faster than Harvey, and traded below
                                                                                                                                                                                                                                                                                                                                                        State                   Nov ‘14             Aug ‘15                Nov ‘15            Recovery
wage growth. On the other hand, the private accommodation                                              Second-quarter employment and wages, Orleans Parish, 2000                                                                                                                  baseline later (as shown in Figure 9). On the other hand, the
                                                                                                                                                                                                                                                                                                                                                                                                                                              (5 mos)
and food services sector of New Orleans had the largest negative                                                            Industry
                                                                                                                                                                     Average
                                                                                                                                                                     monthly
                                                                                                                                                                                       Percent of
                                                                                                                                                                                        Orleans
                                                                                                                                                                                                    Percent
                                                                                                                                                                                                   change in
                                                                                                                                                                                                                        Total
                                                                                                                                                                                                                       wages
                                                                                                                                                                                                                                           Percent of
                                                                                                                                                                                                                                            Orleans                Average
                                                                                                                                                                                                                                                                   weekly
                                                                                                                                                                                                                                                                                  retail gas prices increased by over 35% within the span of a
                                                                                                                                                                   employment            Parish   employment,                             Parish total
percentage change in employment followed by health care and                                                                                                        (thousands)        employment 1990–2000
                                                                                                                                                                                                                      (millions)
                                                                                                                                                                                                                                             wages                  wage
                                                                                                                                                                                                                                                                                  month and recovered over a period of five months after Katrina        Louisiana               $1.87               $2.50                  $2.21              11.2%
social assistance.                                                                                        All industries ...................................           266.5           100.0            –0.1          $2,088.3              100.0              $603               made landfall. The slower recovery in comparison to spot prices
                                                                                                                                                                                                                                                                                                                                                        Mississippi $1.87                           $2.51                  $2.13              15.1%
                                                                                                      Private.................................................
                                                                                                       Agriculture, forestry, fishing, and
                                                                                                                                                                       211.0             79.2           –2.3              1,572.8             75.3                 573
                                                                                                                                                                                                                                                                                  can be partly attributed to the delays in the supply chain. For
                                                                                                         hunting ...........................................              .1             (1)            45.1                  .3              (1)                322
Local unemployment levels had large variations, particularly due                                       Mining ...............................................
                                                                                                       Utilities ..............................................
                                                                                                                                                                         6.5
                                                                                                                                                                          .9
                                                                                                                                                                                         2.4
                                                                                                                                                                                           .3
                                                                                                                                                                                                       –38.3
                                                                                                                                                                                                       –61.7
                                                                                                                                                                                                                           109.0
                                                                                                                                                                                                                            13.7
                                                                                                                                                                                                                                              5.2
                                                                                                                                                                                                                                                .7
                                                                                                                                                                                                                                                               1,298
                                                                                                                                                                                                                                                               1,217
                                                                                                                                                                                                                                                                                  instance, the disruptions to the downstream gas transmission          Alabama                 $1.88               $2.51                  $2.12              15.5%
to large levels of displacement of residents and relocation by                                         Construction ......................................
                                                                                                       Manufacturing ...................................
                                                                                                                                                                         7.9
                                                                                                                                                                        11.3
                                                                                                                                                                                         3.0
                                                                                                                                                                                         4.3
                                                                                                                                                                                                        22.1
                                                                                                                                                                                                       –30.4
                                                                                                                                                                                                                            62.5
                                                                                                                                                                                                                           107.5
                                                                                                                                                                                                                                              3.0
                                                                                                                                                                                                                                              5.1
                                                                                                                                                                                                                                                                 610
                                                                                                                                                                                                                                                                 730              and distribution adds to the cost of the prices of fuel and this
                                                                                                       Wholesale trade ................................                  8.6             3.2           –17.8                86.3              4.1                770
communities to other towns and cities. However, at the national                                        Retail trade........................................
                                                                                                       Transportation and warehousing ......
                                                                                                                                                                        21.2
                                                                                                                                                                        13.0
                                                                                                                                                                                         8.0
                                                                                                                                                                                         4.9
                                                                                                                                                                                                       –14.9
                                                                                                                                                                                                       –22.7
                                                                                                                                                                                                                           103.6
                                                                                                                                                                                                                           116.9
                                                                                                                                                                                                                                              5.0
                                                                                                                                                                                                                                              5.6
                                                                                                                                                                                                                                                                 376
                                                                                                                                                                                                                                                                 692
                                                                                                                                                                                                                                                                                  is factored in with the retail prices. Table 1 shows the recovery
                                                                                                                                                                                                                                                                                                                                                       Figure 9. Changes in regional spot prices of gasoline after hurricanes make landfall (Source: EIA)
level, the labour market was not affected in the medium-term.                                          Information ........................................
                                                                                                       Finance and insurance......................
                                                                                                                                                                         5.4
                                                                                                                                                                        10.5
                                                                                                                                                                                         2.0
                                                                                                                                                                                         3.9
                                                                                                                                                                                                       –19.3
                                                                                                                                                                                                       –18.0
                                                                                                                                                                                                                            57.1
                                                                                                                                                                                                                           117.2
                                                                                                                                                                                                                                              2.7
                                                                                                                                                                                                                                              5.6
                                                                                                                                                                                                                                                                 810
                                                                                                                                                                                                                                                                 857              calculations for retail gas prices in three most affected states.
                                                                                                       Real estate and rental leasing ..........                         4.3             1.6            –8.8                26.5              1.3                475
                                                                                                       Professional and technical
                                                                                                         services ..........................................            13.4              5.0           –1.2               150.2               7.2                 861

In fact, the unemployment rates of the US dropped back to                                              Management of companies and
                                                                                                         enterprises .....................................               5.2              2.0          145.1                62.2               3.0                 916                                                                                  Changes in regional gasoline prices after hurricane fall
                                                                                                       Administrative and waste services ....                           17.2              6.4           29.3                75.8               3.6                 340
its projected baseline value within eight months following                                             Educational services .........................                    7.5              2.8          –15.1                79.9               3.8                 818                                                                                  Percent change from day of landfall
                                                                                                       Health care and social assistance ....                           26.6             10.0            8.1               185.4               8.9                 536
                                                                                                       Arts, entertainment, and recreation...                            8.3              3.1          144.0                42.3               2.0                 392
Katrina. This shows that the smoothing effect of the event                                             Accommodation and food services ...
                                                                                                       Other services, except public
                                                                                                                                                                        34.3             12.9           18.0               134.5               6.4                 302

across the country as well as the partial success of migrated                                            administration .................................                8.7              3.3             –.4               41.7               2.0                 368                                                                                  40%
                                                                                                       Port operations..................................                19.5              7.0          –28.7               225.9              11.0                 893
labourers in finding jobs elsewhere. People displaced did face                                         Tourism .............................................            42.6             16.0           31.2               176.8               8.0                 319                                                                                  30%
difficulties in finding jobs elsewhere but eventually adapted.                                        Federal government............................
                                                                                                      State government ...............................
                                                                                                                                                                        13.9
                                                                                                                                                                        18.5
                                                                                                                                                                                          5.2
                                                                                                                                                                                          6.9
                                                                                                                                                                                                         1.1
                                                                                                                                                                                                        21.4
                                                                                                                                                                                                                           160.0
                                                                                                                                                                                                                           153.3
                                                                                                                                                                                                                                               7.7
                                                                                                                                                                                                                                               7.3
                                                                                                                                                                                                                                                                   885
                                                                                                                                                                                                                                                                   637
                                                                                                                                                                                                                                                                                                                                                        20%
                                                                                                                                                                                                                                                                                                                                                                                                       Harvey
                                                                                                      Local government ...............................                  23.1              8.7            5.4               202.1               9.7                 673
Due to the localized impact of the hurricane, there was a spike                                          1
                                                                                                             Less than 0.1 percent.
                                                                                                                                                                                                                                                                                                                                                        10%
                                                                                                                                                                                                                                                                                                                                                          0%                                                                                            Sandy
in unemployment insurance claims shortly after the event, as
shown in Figure 6. However, this appears to be a rather small blip                                                                                                                                                                                                                                                                                     -10%
                                                                                                                                                                                                                                                                                                                                                                                                                                                        Katrina
                                                                                                     wage rose to $712, about 11.0 percent higher than the                                           Post-Katrina                                                                                                                                      -20%
compared to what was to follow in the aftermath of the global                                        New Orleans figure. Tourism maintained its importance                                                                                                                                                                                                                                                                                              Rita
                                                                                                     in the city’s economy, representing 16.0 percent of jobs                                        To gain a clear picture of the effect of Katrina, this section                                                                                    -30%                                                                                             Ike
financial crisis of 2007.                                                                            and 10.0 percent of total wages.                                                                presents a series of charts that display various monthly
                                                                                                        Despite the overall decrease in the city’s employment                                        time series of over-the-year employment changes from                                                                                              -40%
                                                                                                     base compared with 2000, jobs in professional and techni-                                       2004 to 2006. Monthly data from January 2004 to June                                                                                                        0    1     2    3      4     5    6     7      8   9   10 11 12 13 14 15
                                                                                                     cal services increased by 3.3 percent from 2000 to 2004.                                        2006 summarize employment and total pay (exclusive of
                                                                                                     With average weekly wages of $964, this was one of the                                          benefits) of workers covered by State and Federal unem-
                                                                                                     highest paying sectors among the city’s private establish-                                      ployment insurance. Coverage is broad and is estimated at
                                                                                                     ments and represented 7.9 percent of total wages, second                                        97.0 percent of all wage and salary employees working in
                                                                                                     only to health care and social assistance.                                                      New Orleans during the 2004–06 period.
                                                                                                        By the end of June 2005, private-sector employment in                                           The methodology presented compares employment
                                                                                                     New Orleans continued its decline. The second-quarter                                           levels in the current month with those of the same
                                                                                                     average figure of 191,701 jobs represented a further de-                                        month in the previous year. (The 42 data points are thus
                                                                                                     crease of about 3,500 jobs, or 1.8 percent, compared with                                       reduced to 30 in each chart.) This approach overcomes
                                                                                                     the figure for the same quarter the previous year.                                              problems associated with seasonal patterns in employ-

                                                                                                      Monthly Labor Review • June 2007
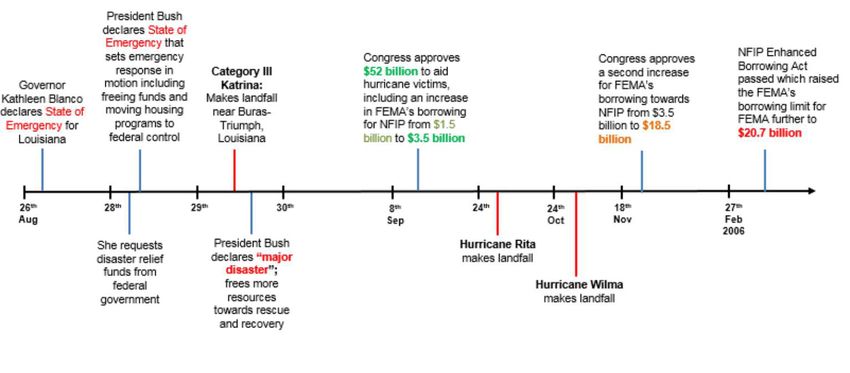
Disaster Recovery Case Studies US 2005 Storms: Katrina, Rita and Wilma - Reinsurance // Property CAT
8                                                                                                                                                                                                                                                                                                                                                                                         9

                                                                                                                                                                              Figure 11. Trends in total debt, home loans and credit card balance of New Orleans residents (Source:   Figure 12. Trends in house prices and new mortgage originated in the New Orleans Area around the time of
Housing                                                                                      The destruction of property, particularly houses led to an                       Gallagher and Hartley 2017)                                                                             Katrina (Source: Deryugina, Kawano, and Levitt 2014; Gallagher and Hartley 2017)

                                                                                             increase in demand for houses. This resulted in an increase in
The other important sector apart from Energy to be severely                                  average house prices and rents in the greater metropolitan
affected by the floods that ensued was the housing sector. The                               areas. Moreover, there was a marked increase in the number of                      Trends in total debt of New Orleans residents                                                            Changes in New Orleans housing prices
massive surge of displacement of people from their residences                                mortgage originations. The increase in mortgages imply a highly
                                                                                                                                                                                                                                                                                           120
to other towns and cities had significant implications for the                               levered housing market, which destabilizes the economy in the                                              Not flooded
                                                                                                                                                                                     70,000
macroeconomy, particularly in terms of GDP growth of the region                              long-run. The paucity of ex-ante protection measures only adds                                             Least flooded quartile
as well as the unemployment rates in the labour market.                                      to the economic stability concerns. Notably, high leverage in the                                          Most flooded quartile

                                                                                             housing sector was one of the key reasons for the housing market                        60,000                                                                                                100
The primary impact on the housing sector is linked to ownership                              collapse and the subsequent global financial crisis in 2007-08. The
of houses and possession of flood insurance. Between 80,000-                                 specific trends in the housing market are graphically presented in                      50,000
100,000 homeowners in New Orleans area alone did not have                                    Figure 12.
                                                                                                                                                                                                                                                                                             80
flood insurance. This resulted in external dependence on
                                                                                                                                                                                     40,000
federal and state-aid, which was slower to materialize and                                   Contrary to expectations, the total debt balance of New Orleans
therefore affected the spee as well as the quality of recovery.                              residents, particularly those who were adversely affected by the
Consequently, mortgage payments were affected due to the                                     floods, were reduced after Katrina. This observation however                            30,000                                                                                                  60
financial constraints imposed upon by the hurricanes. For                                    is consistent with the fact that homeowners used their pay                                            2003:1        2004:1       2005:1 2006:1               2007:1        2008:1                        01 Jan 2000                    01 Jan2005                          01 Jan 2010
                                                                                                                                                                                                                               Quarter of year
instance, 12% of housing loan borrowers in Louisiana were behind                             outs to pay off mortgages than opting to rebuild. It also serves
their loan repayments by over 90 days, as of December 2005.                                  as an explanation for the increase in credit card balances after                                                                                                                                           New Orleans         Control cities
                                                                                                                                                                                  Panel A
The delinquencies reported after the hurricanes were the highest                             the event, where homeowners chose to pay off their debts on
since the 1980s in the US (see Figure 10. Delinquency rates and                              mortgage by raising their credit balances.                                            10,000
                                                                                                                                                                                   Changes in New Orleans housing prices                                                                   Number of new mortgages originated by
foreclosure rates after Katrina (Source: Urban Institute) Figure                                                                                                                                                                                                                           local and nonlocal lenders
10). Interestingly, the foreclosure rates were still lower than the                          Furthermore, flood insurance contributed towards the reduction                           120                                                                                                  1,500
national average which led prime lenders to allow a 3-month grace                            of mortgage debts after the hurricane, which also is consistent                                 0

period (Petterson et al. 2006). Similarly, Fannie Mae allowed an                             with the timing of the pay outs. See Figure 11 for the change in
18-months grace period. These measures prevented premature                                   trends across these balance before and after the hurricane.
                                                                                                                                                                                   -10,000
                                                                                                                                                                                     100                                                                                                   1,000
liquidation of houses due to foreclosures and therefore averted a
market collapse, a year before the actual housing sector collapse
in 2007.                                                                                                                                                                           -20,000
                                                                                                                                                                                        80                                                                                                   500
                                                                                                                                                                                                   2003           2004         2005     2006               2007          2008
                                                                                                                                                                                                                               Quarter of year

                                                                                                                                                                                        60                                                                                                        0
                                                                                                                                                                                  Panel B 01 Jan 2000                            01 Jan2005                           01 Jan 2010                         2003:1      2004:1        2005:1        2006:1         2007:1       2008:1
                                                                                                                                                                                                                                                                                                                                    Quarter of year
Figure 10. Delinquency rates and foreclosure rates after Katrina (Source: Urban Institute)
                                                                                                                                                                                                 New Orleans            Control cities                                                                     Local        Non local
                                                                                                                                                                                      1,500

    Delinquencies skyrocketed after Katrina                                                    Immediately following Katrina, foreclosures declined                                   1,000

      Greater Katrina area           National                                                     Greater Katrina area    National
                                                                                                                                                                                        500
  Delinquency rate                                                                             Foreclosure rate
 30%                                                                                           1.8%                                                                                          0
                                                                                               1.6%
 25%
                                                                                               1.4%                                                                                    -500
 20%                                                                                           1.2%
                                                                                               1.0%                                                                                  -1,000
 15%
                                                                                               0.8%
 10%                                                                                           0.6%
                                                                                                                                                                                                   2003           2004         2005     2006               2007          2008
                                                                                               0.4%                                                                                                                            Quarter of year
    5%
                                                                                               0.2%
    0%                                                                                           0%
      -12 -10 -8 -6 -4 -2 0 2 4 6 8 10 12 14 16 18 20 22 24 26 28 30 32 34 36                       -12 -10 -8 -6 -4 -2 0 2 4 6 8 10 12 14 16 18 20 22 24 26 28 30 32 34 36
                          Months prior to and after Hurricane Katrina                                                 Months prior to and after Hurricane Katrina
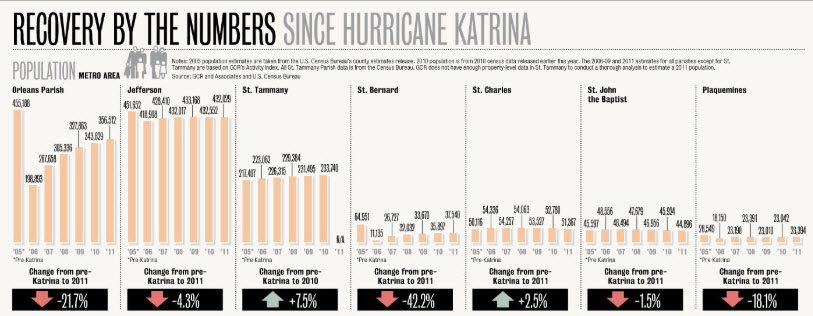
Disaster Recovery Case Studies US 2005 Storms: Katrina, Rita and Wilma - Reinsurance // Property CAT
10                                                                                                                                                                                                                                                                                                                                                       11

                                                                                                                                                                                                                                                   Table 3. Loss estimates and vital figures on the tourism sector in the Gulf States (Sources: Travel
Infrastructure                                                       Construction                                                                                            Travel and tourism                                                    Industry Association of America and Travel Business Roundtable)

                                                                                                                                                                             Tourism is an important sector for New Orleans and nearby areas.
As expected of a hurricane of such magnitude, it caused              Manufacturing and construction sectors in the region were                                               The popularity of the casinos and resorts makes tourism one of         Table 3: Estimated impact of Hurricane Katrina on local travel
extensive damage and destruction to infrastructure.. Total           severely affected. Sales of single-family houses increased                                              the major source of income for the local economy. About 20% of         and tourism
infrastructure damage estimates varied by industry:                  by 13%, a month after the disaster due to the rise in demand                                            the population in the Gulf states were employed in the tourism-
                                                                                                                                                                                                                                                                          No. of               Spending   Daily                           No. of jobs
• Energy: $18-21 billion                                             after the disaster (Petterson et al. 2006). Residential building                                        related sectors. New Orleans’ tourism sector accounts for $5
                                                                                                                                                                                                                                                                          counties             on tourism spending                        supported
• Government structures and equipment: $13-25 billion                permits were 6.7% lower and construction activity (indicating                                           billion in revenues annually, which is also the largest industry in
                                                                                                                                                                                                                                                                          affected             in 2004    losses
• Other industries: $16-32 billion                                   new starts) were lower by 5.6% but completion rates were                                                terms of employment in the city. Table 3 shows the estimates
• Rebuilding costs of damaged infrastructure such as roads,          unaffected, a month later. There were no major changes in  prices                                       of average daily losses in the tourism sector, in the four most        Total                        50               $18.3 B                $50 M               260,000
   bridges: $3.5 billion                                             of construction equipment except transitory price increases to                                          affect states, resulting from lower revenues and consumption by
                                                                                                                                                                                                                                                    Alabama                       3                $2.0 B                $5.5 M               30,000
                                                                     essential building materials (see Table 2 for details on the price                                      tourists after Katrina.
Debris removal alone accounted for 40% of the total costs. In        changes).                                                                                                                                                                      Mississippi                  15                $2.8 B                $7.7 M               38,000
addition to these damages, disruptions due to infrastructure                                                                                                                 Fisheries
                                                                                                                                                                                                                                                    Louisiana                    32               $13.5 B                $37 M               191,000
damages also persisted for quite some time. There were quite         Table 2. Impacts on Katrina on prices of building materials (Source: BLS Producer Price Index series)   Losses in the fishing industry varied by activity across the Gulf
a few instances where trains were halted for several miles in                                                                                                                region, with seafood industry suffering the biggest blow of $1.3
the US rail systems. In some cases, farm and industrial goods                                                                                                                billion and other losses arising from missed commercial trips.
                                                                      Table 1: Changes in prices of building materials
from Midwest suffered temporary access to foreign markets.                                                                                                                   Insurance had notable impact on the fisheries sector after the
Furthermore, they also resulted in supply disruptions for basic US                                                                                                           hurricanes (Petterson et al. 2006). Fish-processing firms were
                                                                                                                                Seasonally adjusted
food products and certain imports from abroad.                                                                                                                               more likely to be insured and hence reconstruction was expected
                                                                                                                                percent change from:
                                                                                                                                                                             to take place relatively quickly. Similarly, vessels were required
New Orleans is a very important US port, and part of a major                                                                    Aug to Sep              Sep to Oct           to have insurance but on the other hand fishermen were not
commercial waterway in the country. In fact, it is the fourth                                                                                                                required to have them. A complication to the recovery process
                                                                      Intermediate materials
largest in terms of tonnage. Hurricane Katrina damaged 12 wharfs                                                                        2.7                     3.0          of the fisheries sector was that some companies rejected claims
                                                                      less food & feed
and affected several transportation barges.                                                                                                                                  when vessels damaged by Katrina’s winds were also damaged by
                                                                      Plastic construction products                                     1.6                     7.4          Rita’s waters. The wind vs water was a very prominent debate and
                                                                                                                                                                             led to several litigations after the storms subsided.
                                                                      Softwood lumber                                                   2.8                    -1.2
                                                                      Plywood                                                          14.1                     5.1
                                                                      Steel mill products                                               3.7                     3.0
                                                                      Cement                                                            0.7                     1.2

                                                                     Others
                                                                     Businesses
                                                                     Businesses took a big hit due to disruptions caused by the floods.
                                                                     For instance, about 80,000 businesses in South West Louisiana
                                                                     were affected, particularly with the restaurants taking a major
                                                                     hit. New Orleans mayor announced permanent layoffs of 50%
                                                                     of non-essential workforce to cut expenses towards achieving
                                                                     an estimated savings of 25%. Furthermore, to boost activity,
                                                                     Louisiana temporarily offered 6-month interest-free loans to the
                                                                     value of $100,000 and helped businesses get back on their feet.
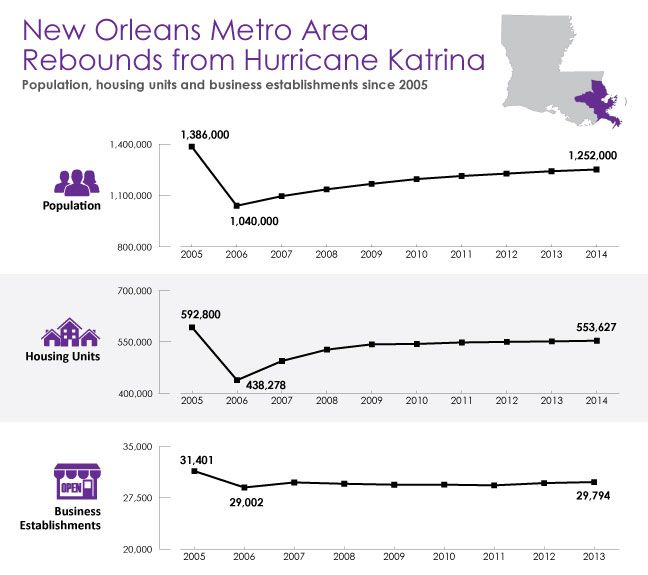
Disaster Recovery Case Studies US 2005 Storms: Katrina, Rita and Wilma - Reinsurance // Property CAT
12                                                                                                                                                                                                                                                                                                                                                                     13

                                                                       Figure 13. Displacement and migration of people after Katrina (Source: US Census Bureau)

Social Impacts                                                                                                                                                                 Financial Markets                                                                                      On the other hand, implied spreads widened for the 2% CAT
                                                                                                                                                                                                                                                                                      bonds after these hurricanes due to a sudden reduction in
In addition to the economic impacts, the social dimension of                                                                                                                   The impacts of Katrina on the stock markets were transitory                                            global reinsurance capital, which had implied an increase in the
the problem was also significant. Around 2000 were killed by                                                                                                                   and the markets continued to operate as usual very quickly.                                            risks of holding CAT bonds (see Figure 16). In effect, the lower
Katrina’s might. The numbers were the largest in Louisiana                                                                                                                     Therefore, there was only a lukewarm response to Katrina at the                                        capitalization of the insurers due to losses arising from the
followed by Mississippi and the other Gulf states. Additionally, 700                                                                                                           US stock market indices, which is evident from Figure 16, where                                        hurricanes was one of the primary factors of the widening of
were missing and 6000 were injured. As outlined earlier, Katrina                                                                                                               the price decline has not been signficant. Data shows that stock                                       these bond spreads. Furthermore, the first ever trigger of a CAT
succeeded in displacing several residents from their bases. In                                                                                                                 prices of insurance companies decline after hurricanes due to                                          bond was also observed after Katrina. It was a $190 million worth
6 months, over 43,000 apartments (approximately 24%) were                                                                                                                      losses from the event. In fact, the decline began before Katrina                                       security that was tied to the policies by Zurich Financial Services
destroyed and over 200,000 were left uninhabitable in the states                                                                                                               made landfall in anticipation of future losses to the insurers (Blau,                                  and issued by Swiss Re.
of Mississippi, Alabama and Louisiana. Following the storm, the                                                                                                                Ness, and Wade 2008). Evidence of short-selling by investors
demand for rentable houses had risen rapidly and far exceeded                                                                                                                  before hurricane Rita but not before Katrina. Investors may have
availability, which substantiates the massive relocation drive to                                                                                                              learnt from Katrina and then applied to the forthcoming disasters.
nearby states (see Figure 13).                                                                                                                                                 P&C insurance firms did not display significant cumulative
                                                                                                                                                                               abnormal returns for stock prices in the 20-day window (10 days
The storms led to displacement of 1.5 million people to different                                                                                                              each before and after landfall) during Katrina and Sandy; unlike
parts of the US (Petterson et al. 2006). In some cases, those                                                                                                                  some other hurricanes (Feria-Domínguez, Paneque, and Gil-
who were displaced chose to return to their original base.                                                                                                                     Hurtado 2017). Due to pricing and availability issues, the event
Homecoming after disasters typically depends on several factors                                                                                                                had also resulted in the introduction of new types of insurance
such as family and work, scale of event, extent of damage,                                                                                                                     products in the ILS markets. There has been an annual growth
reconstruction/ housing circumstances and finally, financial                                                                                                                   of 23% of non-life ILS markets since 2000 and Katrina has been
constraints. Family and work is one of the chief reasons for the                                                                                                               partly attributed for this drive in the US, given the losses to the
                                                                       Figure 14. Population trends in Katrina affected counties, after the event (Source: NOLA)
return effect in the US generally after natural disasters. Impacts                                                                                                             insurance sector.
after Katrina lasted over a year after Katrina and therefore
resulted in permanent relocation particularly for some with
financial constraints. Importantly, rent increases post-disaster
smothered any hope of return to New Orleans for homeowners,
who incidentally were mostly uninsured. Figure 15 illustrates
the sudden drop in new supply of houses, which in combination
with high housing demand led to rapid growth in rents in the New
Orleans area.                                                                                                                                                                  Figure 16. Stock market and CAT bonds market reactions to major events (Source: Wikipedia)

There was a structural change in population of most of the
                                                                                                                                                                                Market reactions to major events
counties since Katrina, with some counties never achieving                                                                                                                      S&P 500
                                                                                                                                                                                                                                                              Hurricane Harvey
the pre-disaster population. Ten years later, only 90% of              Figure 15. Trends in house supply and rents before and after Katrina (Picture source: Axiometrics)                           Hurricane Ivan                                              Aug 27, 2017
                                                                                                                                                                                                     Sep 16, 2004                                        Damage: (est)$150-200 B
the pre-storm population achieved in 40 of 72 New Orleans                                                                                                                      2500                 Damage: $23 B                   Hurricane Gustav                                          End of the
                                                                                                                                                                                                                                                                                             .com bubble
                                                                                                                                                                                                                                                                                                           Hurricanes
                                                                                                                                                                                                                                                                                                             Katrina
                                                                                                                                                                                                                                                                                                                            Global
                                                                                                                                                                                                                                                                                                                         financial crisis
                                                                                                                                                                                                                                                                                                                                                   Eurozone
                                                                                                                                                                                                                                                                                                                                                     crisis
                                                                                                                                                                                                                                      Sep 1, 2008       Hurricane Matthew
neighbourhoods (Plyer & Mack, 2015). For a selection of the             New supply and rent growth in New Orleans                                                                   Hurricane Frances
                                                                                                                                                                                                                   Hurricane Katrina Damage: $7 B
                                                                                                                                                                                                                    Aug 29, 2005                          Sep 28, 2016                20%                  Rita, Wilma
                                                                                                                                                                                      Sep 4, 2004                                                        Damage: $15 B
recovery trends in population across major counties, see Figure                   New supply          Rent growth
                                                                                                                                                                                                                   Damage: $108 B                                                     18%
                                                                                                                                                                               2000  Damage: $10 B                                         Hurricane Ike
                                                                                                                                                                                                                                                                                      16%
14.                                                                    3,000                                                                                            20%
                                                                                                                                                                                                   Hurricane Jeanne
                                                                                                                                                                                                     Sep 13, 2004
                                                                                                                                                                                                                                           Sep 7, 2008
                                                                                                                                                                                                                                          Damage: $38 B
                                                                                                                                                                                                    Damage: $8 B                                                     Hurricane Irma   14%
                                                                                                                                                                                                                                                                      Sep 10, 2017
                                                                                                                                                                               1500
                                                                                                                                                                                                                                                                        Damage:       12%
                                                                       2,500                                                                                            15%                                                                                          (est)$42-65 B    10%
                                                                                                                                                                                                                     Hurricane Wilma                             Hurricane Sandy      8%
                                                                       2,000                                                                                            10%    1000
                                                                                                                                                                                                                      Oct 24, 2005                                Oct 30, 2012
                                                                                                                                                                                                                     Damage: $29 B                               Damage: $75 B        6%
                                                                       1,500                                                                                            5%             Hurricane AllisonHurricane Charity                     Hurricane Irene                         4%
                                                                                                                                                                                500      Jun 6, 2001                                           Aug 21, 2011
                                                                                                                                                                                                         Aug 14, 2004                                                                 2%
                                                                                                                                                                                        Damage: $9 B Damage: $16 B Hurricane Rita             Damage: $17 B
                                                                       1,000                                                                                            0%                                                 Sep 20, 2005                                               0%
                                                                                                                                                                                                                          Damage: $12 B
                                                                                                                                                                                   0
                                                                         500                                                                                            -5%

                                                                            0                                                                                           -10%
                                                                                                                                                                                                                                                                                            2% cat bonds   Junk bonds (6-mo offset)        US $50B ILW (6-mo offset)
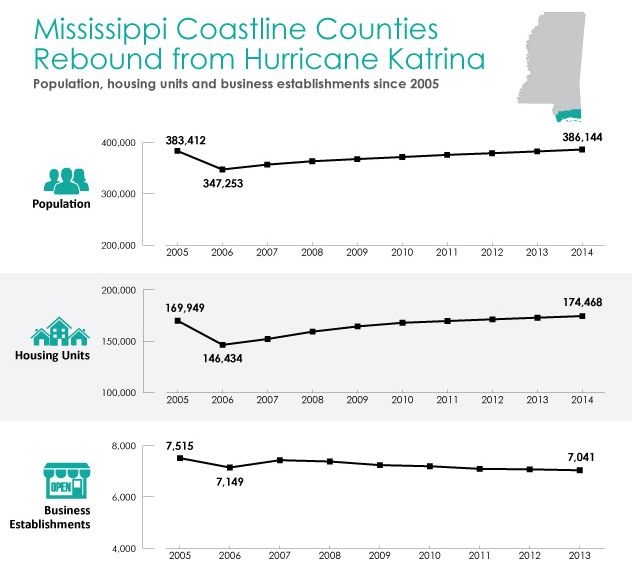
Disaster Recovery Case Studies US 2005 Storms: Katrina, Rita and Wilma - Reinsurance // Property CAT
14                                                                                                                                                                                                                                                                                                                         15

Recovery

Disaster Management Efforts                                            The major sources of funding after disasters in the US are NFIP,         Table 4. Major federal funding sources for recovery after Katrina (Source:
                                                                                                                                                                                                                        insurance.
                                                                                                                                                                                                                           Spader and
                                                                                                                                                                                                                                   However,
                                                                                                                                                                                                                                      Turnham
                                                                                                                                                                                                                                            the2014)
                                                                                                                                                                                                                                                extent of purchase of insurance has not
                                                                       Community Development Block Grant (CDBG), private insurance,
                                                                                                                                                                                                                                                                             Appropriations/Allocation
In the US, the state must first declare emergency and request          charitable donations and humanitarian aid.                               Federal Agency                           Program
                                                                                                                                                                                                                                                                             Authority ($)
the President of the country to initiate the relief efforts from the
federal government. The President then typically frees the funds       The NFIP program was established in 1968 to address lack of                                                       Hazard Mitigation Grant Program                                                     $1.9 Billion
allocated for reconstruction, recovery and relief to the state after   flood insurance. NFIP is now the primary source of residential           Federal Emergency Management
                                                                                                                                                                                         Individual and Households Program                                                   $684 Million
declaring a state of emergency. In the case of Katrina, these were     flood insurance in the country. It has over 5 million policies in        Agency
set in motion a few days before it made landfall because of the        force in US, representing nearly $1.25 trillion in terms of coverage.                                             Public Assistance for Permanent Work                                                $33 Million
pre-storm damages and the severity of the threat posed. On the         Private firms write policies and process claims on NFIP’s behalf,
                                                                                                                                                U.S. Dept. of Housing and Urban          Community Development Block Grant Program                                           $18.9 Billion
29th of August, Katrina made landfall which led to unanticipated       but bear none of the risk and they are not responsible for setting
                                                                                                                                                Development
damages. A week later Congress approved $52 billion in the             premium rates. There is a maximum residential limit of $250,000                                                   Capital Fund Emergency/Natural Disaster Funding                                     $29.8 Million
form of aid to the victims and increased the borrowing of the          for building coverage and $100,000 for contents coverage. Non-
                                                                                                                                                                                         Physical Disaster Business Loan                                                     $270 Million
Federal Emergency Management Agency (FEMA) for its National            residential policyholders can insure both structure and contents         Small Business Administration
Flood Insurance Program (NFIP) from $1.5 billion to $3.5 billion.      up to $500,000 each (only 5% of total policies). On the other hand,                                               Home Disaster Loan                                                                  $4 Billion
However, in the span of two months after Katrina, Rita followed by     CDGB is a very important tool that federal government used
                                                                                                                                                                                         GO Zone Low-Income Housing Tax Credits                                              $276 Million
Wilma made landfall thereby exacerbating the damages caused            to deliver disaster assistance for disaster-affected states and
by Katrina. Consequently, in November, the congress approved           localities. It was the largest source of funding for rebuilding and      U.S. Dept of Treasury                    GO Zone Tax-Exempt Private Activity                                                 $12.8 Billion
another increase to the NFIP program to $18.5 billion, which was       reconstruction efforts after Katrina (see Table 4 for an overview of
                                                                                                                                                                                         New Markets Tax Credits (GO Zone)                                                   $1 Billion
further increased to $20.7 billion within the next three months to     all the federal funding sources).
meet the needs. Figure 17 summarizes the timeline of disaster
management efforts during these storms.                                                                                                        The federal assistance programs by FEMA available to the               13 million citizens made individual donations of aid and $2 billion
                                                                                                                                               affected states are in the form of Individual Assistance (for          raised for emergency aid by Red Cross. The chief source of private
                                                                                                                                               housing damages), Public Assistance (Infrastructure and public         funding for rebuilding after a disaster in the US has been private
                                                                                                                                               works) and Hazard Mitigation (reduce vulnerability). Louisiana         been enough to cover the entire losses incurred by such severe
                                                                                                                                               was one of the major beneficiaries of these programs being the         natural disasters.
                                                                                                                                               worst affected of the US states after Katrina. See Figure 18 for an
                                                                                                                                               overview of funding available to the states under these different      Figure 18. Overview of the assistance programs available to Katrina-affected states (Source: FEMA)
                                                                                                                                               schemes.
Figure 17. Disaster management timeline during the US storms of 2005

                                                                                                                                               In the first four months after Katrina, $67 billion was appropriated
                                                                                                                                               by the Congress in the form of aid, which included $18 billion
                                                                                                                                               in flood insurance. Within six months, the Bush administration
                                                                                                                                               had disbursed $11.5 billion in Community Development Block
                                                                                                                                               Grants to five affected US states in the Gulf area. The Federal
                                                                                                                                               government approved $75 billion in immediate disaster relief and
                                                                                                                                               $45 billion in rebuilding funds and emergency aid. They also spent
                                                                                                                                               $120 billion in the Gulf region alone, of which $75 billion went to
                                                                                                                                               emergency relief operations.

                                                                                                                                               In addition to federal support, over 100 countries contributed to
                                                                                                                                               aid to meet humanitarian needs in the US, which was considered
                                                                                                                                               to be lacking at that time (Petterson et al. 2006). This included
                                                                                                                                               several Islamic nations who sent approximately $1 billion in aid
                                                                                                                                               directed towards Katrina affected victims. For instance, Libya
                                                                                                                                               sent $100 million to US despite tensions between the nations.
                                                                                                                                               Developing nations like Bangladesh also offered monetary aid to
                                                                                                                                               victims of the storm. However, in the end, the US government
                                                                                                                                               only accepted a fraction of the total aid offered. Furthermore,
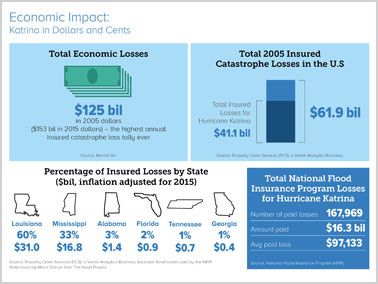
Disaster Recovery Case Studies US 2005 Storms: Katrina, Rita and Wilma - Reinsurance // Property CAT
16                                                                                                                                                                                                                                                                                                                                                       17

                                                                       Figure 19. Examples of recovery after Katrina measured in terms of certain metrics
Reconstruction and Recovery                                            (Source: US Census Bureau)                                                               rebuild themselves (Financial Services Roundtable, 2006).                                                  The silver lining in all of this is that the reconstruction efforts
                                                                                                                                                                Furthermore, insurance reimbursement was a key variable that                                               after the disaster showed higher productivity of labour force than
Data shows that the affected counties were slow to recover                                                                                                      affected post-disaster housing recovery decisions                                                          during previous non-disaster ones (Denhart 2010).
after the storms. In terms of directly measurable parameters
such as population, housing units and business establishments                                                                                               • Construction costs, insurance premiums: increased by 133%                                                    Importantly, the mismanagement and delays associated with the
of a region, the recovery has been lethargic. It has taken almost                                                                                             and 400% respectively after the event, particularly in high risk                                             disaster relief efforts highlighted the weakness in emergency
a decade to recover to pre-disaster levels in certain cases (see                                                                                              regions. These high costs influenced investment decisions and                                                response by the administration. These quickly escalated to
Figure 19 for examples).                                                                                                                                      crippled the reconstruction efforts of housing units therefore                                               allegations of inadequate response at the local, state and federal
                                                                                                                                                              affecting economic recovery (Louisiana Housing Finance                                                       levels and resonated with the public of the affected regions.
The terms of the CDBG aid for the Katrina-affected victims are as                                                                                             Agency, 2010)                                                                                                What started off as a natural disaster also triggered a political
below:                                                                                                                                                                                                                                                                     crisis of sorts. For instance, approval ratings of top government
                                                                                                                                                            • Supplementation mindset: The use of federal disaster                                                         officials plummeted. This was soon followed by resignation of
Option 1: Homeowners opting to rebuild on their property could                                                                                                assistance as a supplement to private property insurance,                                                    FEMA director considering the allegations of mismanagement.
receive a grant equal to 100% of their potential grant amount                                                                                                 instead of using them as post-disaster support also                                                          A survey of 680 randomly sampled respondents conducted in
                                                                                                                                                              considerably affected reconstruction efforts and recovery                                                    September of 2005, soon after Katrina made landfall, unravelled
Option 2: Homeowners opting to relocate to other areas in                                                                                                     (Herring and Rosenman 2016)                                                                                  the political dimension of the disaster. The results show that
Louisiana could receive a grant equal to 100% of the potential                                                                                                                                                                                                             most of them disapproved of the handling of relief efforts at all
grant amount                                                                                                                                                • Bias: More loans were being approved to wealthy                                                              levels of governance. It also highlighted the underlying currents
                                                                                                                                                              neighbourhoods than others, primarily by lenders to hedge                                                    of racial tensions in the region affected by Katrina (see Figure 21
Option 3: Homeowners opting to relocate outside of Louisiana                                                                                                  against missed repayments. This affected the speed of                                                        for the results).
could receive 60% of the potential grant amount (or 100% of the                                                                                               recovery at the micro-level
potential value if the homeowner was 65 or older)

One of the chief reasons for the slow recovery, apart from
socioeconomic identity of the region (characterized by the
poverty levels) is the mismanagement of funds and/or aid
received for rebuilding purposes. Figure 20. The various uses
of disaster relief funds from CDGB for non-rebuilding purposes
(Source: Spader and Turnham 2014) Figure 20 shows the various                                                                                               Figure 20. The various uses of disaster relief funds from CDGB for non-rebuilding purposes
                                                                                                                                                            (Source:Spader and Turnham 2014)
uses of CDBG funds. In some cases, it was reported that they
were used to buy football tickets or other items of leisure.
                                                                                                                                                            CDBG recipients’ use of funds
In addition to these, several other factors affect recovery from                                                                                                                     5%
                                                                                                                                                            purchase new home                       74%
natural disasters.
                                                                                                                                                              rent a place to live 3%
                                                                                                                                                                                        15%                                                Figure 21. Results from disaster management survey after Katrina (Source: Brodie et al. 2006)
                                                                                                                                                              pay for temporary 4%
The key factors that affected recovery from Katrina were                                                                                                                 housing      10%
identified to be the following:                                                                                                                                pay off mortgage 6%
                                                                                                                                                                          or loan           31%                                            Views of government response                                           Rating of President Bush’s handling
                                                                                                                                                                  pay for moving 3%                                                            to thehurricane and flooding                                           of situation
• FEMA structure: FEMA does not work top-down which                                                                                                                                     10%
                                                                                                                                                                         expense                                                               Too slow and there is no excuse                          76            Disapprove                         70
  implies that the local and state governments bear the initial                                                                                              purchase a vehicle 0% 3%
                                                                                                                                                                                                                                               Reasonable under circumstances                           17            Approve                            15
  responsibility of responding to the disaster. In the case of                                                                                               purchase furniture       10%
                                                                                                                                                                                                50%                                        Experience made you feel like government                               Rating of Governor Blanco’s
  Katrina, the failure at these levels resulted in the slow response                                                                                                pay everyday     7%
                                                                                                                                                                                                50%                                            cares about people similar to yourself                                 handling of situation
  after the event, which was also exacerbated by inefficiencies                                                                                                  living expenses
                                                                                                                                                                                    5%                                                         No                                                       61            Disapprove                         58
  in the management of Katrina at the Federal level (Moreteau                                                                                                     other puchase            27%
                                                                                                                                                                                                                                               Yes                                                      28            Approve                            27
  2010)                                                                  in the coastal areas at a relatively low cost. For instance, the
                                                                                                                                                                                                                                           Would government have responded more                                   Rating of Mayor Ray Nagin’s handling
                                                                         inability to price risks correctly in the case of government pools
                                                                                                                                                                                                                                               quickly if more residents had been                                     of situation
• Policy weakness: Existing policies during Katrina (and Sandy           have also encouraged property development in riskier coastal                                                           Option 1, Phase 1 &                            wealthy and White?                                                     Disapprove                         53
  even) were insufficient to aid quick recovery of infrastructure,       locations in the US which was a failure of policy (McAneney et                                                         Phase 2 (N=182)
                                                                                                                                                                                                                                               Yes                                                      68            Approve                            33
  houses and commercial business in affected areas (Nejat                al. 2016)                                                                                                              Option 2 & Option 3
                                                                                                                                                                                                (N=16)                                         No                                                       23
  and Ghosh 2016). It was noted that the mispricing of flood           • Socio-economic aspects: such as neighbours’ decision to
  insurance premiums provided wrong incentives to build houses           rebuild were found to be crucial to household decisions to
18                                                                                                                                                                                                                                                                                                                                                                              19

                                                                                                                                                                                                                                                                                                          Conclusions

                                                                        Figure 22. Total insured catastrophic losses for the US by year (Source: American Re)                                       Figure 24. Annual trends in the ratio of NFIP premiums to losses incurred (Source: Harvard Business
Insurance                                                                                                                                                                                           School)                                                                                               Hurricane Katrina was the costliest natural disaster in the history
                                                                                                                                                                                                                                                                                                          of the insurance industry, which also led to a structural deficit for
2005 was the worst year for the insurance sector, due to the large       U.S. insured catastrophic losses                                                                                             NFIP total premiums vs. losses                                                                      FEMA due to shortage of funds for its NFIP program. This disaster
                                                                                                                                                                                                      (1978 - 2012)                                                               17.7
number of pay outs associated with Katrina (see Figure 22). The               60                                                                                                            $55.3                                                                                                         revealed several issues with the management of catastrophes
total insured losses were twice as large as the next highest. About                                                                                                                                        8                                                                                              in the US and the extent of ex-ante protection measures such
                                                                              50                                                                                                                                                                                                         2012:
63% of flood insurance claims greater than 95% of total insured                                                                                                                                            7                                                                             Superstorm       as insurance. Less than 40% of the total losses were insured,
                                                                              40                                                                                                                                                                                                         Sandy
value between 1978 and 2012 occurred in 2005 (Kousky and                                                                                                                                                                                                  2005:                                           therefore exposing the affected to the repercussions due to a
                                                                                                                                                                                                           6                                              Hurricane Katrina,
                                                                              30                                                                                                        $27.5
Michel-Kerjan 2017). Of the total loss of $125 billion from Katrina,                                   $22.9
                                                                                                                                                                     $26.5
                                                                                                                                                                                                           5
                                                                                                                                                                                                                                                          Rita and Wilma                                  significant protection gap.
only about $41 billion were insured losses (see Figure 22). The               20                                      $16.9
                                                                                                                                                                                    $12.9                  4
insurance sector took losses to the amount of roughly 47-53% of               10 $7.5                                         $8.3 $7.4          $10.1 $8.3                                                                                                   2008:                                       At the national level, the impacts on GDP and unemployment
                                                                                                $4.7           $5.5                                           $4.6           $5.9                          3                                                  Hurricane
their market value, whereas the re-insurers’ figures were 44-52%                         $2.7                                             $2.6                                                                                                                Ike                                         were insignificant, and if any were only short lived. However, the
                                                                               0
in total. The capital markets absorbed rest of the losses. See                                                                                                                                             2                                                                                              regional and local socioeconomic impacts were very significant.
Figure 23 for an overview of the economic impacts and insured                                                                                                                                              1                                                                                              The energy sector was particularly affected due to the location of
losses by state due to Katrina.                                                    2005 was by far the worst year ever for insured catastrophic losses                                                                                                                                                    oil and natural gas production units. In addition to incurring losses
                                                                                   in the U.S. at more than twice 2004’s record. Includes $50.3 Billion                                                    0
                                                                                   per ISO/PCS plus $5 Billion offshore energy losses from                                                                                                                                                                due to lost income and revenue for businesses, it led to migration
Since 1973, flood coverage has been mandatory for federally                        Hurricanes Katrina and Rita                                                                                                                                                                                            and local unemployment in several sectors. The construction
insured mortgages in the US, however, only 40% of the victims                                                                                                                                                                                                                                             sector was largely spared, and in fact it was the only sector to
                                                                                                                                                                                                    Some of these were due to the incentives structure in the
in Louisiana and Mississippi had insurance to cover losses              Figure 23. Economic impacts and the insured losses due to Katrina                                                                                                                                                                 post profits immediately after the storm. The sudden reduction
                                                                        (Source: Insurance Information Institute)                                                                                   insurance sector. For instance, a few insurance companies had
(Kunreuther 2006). The percentage of homeowners with flood                                                                                                                                                                                                                                                in supply of houses due to the damages triggered an inflationary
                                                                                                                                                                                                    doubled their rates for certain categories and some refused to
insurance in Louisiana parishes varied from 7% in Tangipahoa to                                                                                                                                                                                                                                           trend in house prices and rents. This effect led to permanent
                                                                                                                                                                                                    issue new property insurance for those along the coast (Smith
58% in St. Bernard’s. This number was only 60% in Orleans Parish,                                                                                                                                                                                                                                         relocation of residents in some of the areas and therefore was a
                                                                                                                                                                                                    2012). The lack of funds to defray the disaster-related expenses
one of the main parishes in the state. The lack of enforcement of                                                                                                                                                                                                                                         chief factor in the slower recovery. The financial sector had mixed
                                                                                                                                                                                                    also slowed down reconstruction and recovery. Therefore, some
the mandatory flood insurance is one of the reasons for such low                                                                                                                                                                                                                                          reactions. Except for stocks of insurance companies, the stock
                                                                                                                                                                                                    states had to step-in to fill the role of providing the necessary
levels of flood insurance in the US. The lessons were not learnt in                                                                                                                                                                                                                                       markets were largely unaffected. During this time, the first ever
                                                                                                                                                                                                    funds to enable reconstruction. Mississippi organized a “Wind
the US, since only 20% of NYC homeowners had flood insurance                                                                                                                                                                                                                                              trigger of a CAT bond was witnessed.
                                                                                                                                                                                                    Pool” (property insurance of last resort) at a very heavy price.
during Sandy, despite Hurricane Irene the previous year in that
                                                                                                                                                                                                    They purchased reinsurance from global markets at 398% and
region. As a result, US still has a significant protection gap that                                                                                                                                                                                                                                       The storms, particularly Katrina, revealed several fundamental
                                                                                                                                                                                                    268% premium increases on residential & commercial property
remains to be filled. The uptake of insurance is determined by                                                                                                                                                                                                                                            flaws in the management of hurricanes through the delays
                                                                                                                                                                                                    policies to meet the demands and promote economic welfare.
several factors, of which poverty levels is one of the main ones.                                                                                                                                                                                                                                         and operational mismanagements. Consequently, the inept
                                                                                                                                                                                                    Such measures proved to be very costly for the States.
Districts in the US with high poverty were found to have lower                                                                                                                                                                                                                                            disaster response and inefficiencies in administration of aid by
flood insurance coverage, as expected (Masozera, Bailey, and                                                                                                                                                                                                                                              the government negatively affected the speed of recovery of
Kerchner 2007).                                                                                                                                                                                                                                                                                           the economy. The economic recovery was further delayed due
                                                                                                                                                                                                                                                                                                          to over-reliance on ex-post measures like federal disaster aid
There was a total of 1.7 million different claims for vehicle, houses                                                                                                                                                                                                                                     (with large lead times), which was exacerbated by the misuse of
and business damages were made in the six affected states,                                                                                                                                                                                                                                                appropriated funds by recipients.
of which 1.2 million were personal property claims (Insurance
Information Institute, 2010). The volume of claims from these                                                                                                                                                                                                                                             While it is plausible that the US could benefit from a larger share
were so high while the premiums collected were low such that the                                                                                                                                                                                                                                          of insured losses through higher insurance penetration, bigger
National Flood Insurance Program (NFIP) went into $17-18 billion                                                                                                                                                                                                                                          policy issues need to be first addressed.
debt (see Figure 24 for a measure).
                                                                                                                                                                                                                                                                                                          Inadequate risk differentiation of hazard zones, mispricing of
Sandy pushed these further to $24 billion, only to be raised to                                                                                                                                                                                                                                           risks in coastal areas, lack of enforcement in the purchase of
$27 billion after Harvey. There were a total of 168,000 claims                                                                                                                                                                                                                                            mandatory insurance and lack of incentives for improving private
paid with a total value of $16.3 billion that resulted in an average                                                                                                                                                                                                                                      insurance uptake are some of the fundamental problems facing
amount of $97,000 per claim. This is the highest for any disaster                                                                                                                                                                                                                                         the US that warrant attention.
in the US. During Katrina, the average premium shortfalls were
approximately $800 million a year. This shortfall had to be
borrowed from federal government that had severe economic
knock-on effects for the macroeconomic and policymaking
(Bingham et al. 2006). Despite the FEMA aid and a massive federal
bailout of over $50 billion by 2008, status quo was not reached.
20                                                                                                                                                                                                                                                                                                                       21

References

Bingham, Kevin, Mark Charron, Gerald Kirschner, Richard Messick,       Herring, Chris, and Emily Rosenman. 2016. “Engels in the              Acknowledgements
and Shama Sabade. 2006. “The Role of Actuarial Soundness in            Crescent City: Revisiting  the Housing Question in Post-Katrina
the National Flood Insurance Program.” American Institute for          New Orleans.” ACME: An International Journal for Critical             Cambridge Centre for Risk Studies gratefully acknowledges the
Research:2001-2006 Evaluation of the National Flood Insurance          Geographies 15 (3): 616–38.                                           expertise provided by our research team, collaborators, and
Program.                                                                                                                                     subject matter specialists. Any misinterpretation in use of the
                                                                       Kousky, Carolyn, and Erwann Michel-Kerjan. 2017. “Examining           advice provided is entirely the responsibility of the Cambridge
Blau, Benjamin M, Robert A Van Ness, and Chip Wade. 2008.              Flood Insurance Claims in the United States: Six Key Findings.”       Centre for Risk Studies.
“Short Selling Capitalizing on Catastrophe : Katrina Insurance         Journal of Risk and Insurance 84 (3): 819–50. doi:10.1111/
Stocks Around Hurricanes and Rita.” The Journal of Risk and            jori.12106.
                                                                                                                                             Cambridge Centre for Risk Studies Project Team
Insurance 75 (4): 967–96.
                                                                                                                                             Oliver Carpenter, Research Assistant
                                                                       Kunreuther, Howard. 2006. “Disaster Mitigation and
                                                                                                                                             Dr Andrew Coburn, Director of Advisory Board
Brodie, Mollyann, Erin Weltzien, Drew Altman, Robert J. Blendon,       Insurance: Learning from Katrina.” The Annals of the
                                                                                                                                             Arjun Mahalingam, Research Assistant
and John M. Benson. 2006. “Experiences of Hurricane Katrina            American Academy of Political and Social Science 604: 208–27.
                                                                                                                                             Dr Stephen Platt, Senior Risk Researcher
Evacuees in Houston Shelters: Implications for Future Planning.”       doi:10.1177/0002716205285685.
                                                                                                                                             Dr Michelle Tuveson, Executive Director
American Journal of Public Health 96 (8): 1402– 8. doi:10.2105/
AJPH.2005.084475.                                                      Masozera, Michel, Melissa Bailey, and Charles Kerchner. 2007.
                                                                       “Distribution of Impacts of Natural Disasters across Income           Cambridge Centre for Risk Studies Research Team
Denhart, Hazel. 2010. “Deconstructing Disaster: Economic and           Groups: A Case Study of New Orleans.” Ecological Economics 63         Professor Daniel Ralph, Academic Director
Environmental Impacts of Deconstruction in Post-Katrina New            (2–3): 299–306. doi:10.1016/j.ecolecon.2006.06.013.                   Simon Ruffle, Director of Research and Innovation
Orleans.” Resources, Conservation and Recycling 54 (3): 194–204.
doi:10.1016/j.resconrec.2009.07.016.                                   McAneney, John, Delphine McAneney, Rade Musulin, George               James Bourdeau, Research Assistant
                                                                       Walker, and Ryan Crompton. 2016. “Government-Sponsored                Jennifer Copic, Research Associate
Deryugina, T, L Kawano, and S Levitt. 2014. “The Economic              Natural Disaster Insurance Pools: A View from down-Under.”            Dr Jennifer Daffron, Research Associate
Impact of Hurricane Katrina on Its Victims: Evidence from              International Journal of Disaster Risk Reduction 15. Elsevier: 1–9.   Ken Deng, Research Assistant
Individual Tax Returns.” NBER Working Paper Series, no. 20713:         doi:10.1016/j.ijdrr.2015.11.004.                                      Tamara Evan, Research Assistant
1–47. doi:10.3386/w20713.                                                                                                                    Jay Chan Do Jung, Risk Researcher
                                                                       Moreteau, Oliver. 2010. “Catastrophic Harm in United                  Eireann Leverett, Senior Risk Researcher
Dolfman, Michael L, and Bruce Bergman. 2007. “The Effects of           States Law : Liability and Insurance.” The American Journal of        Olivia Majumdar, Research Assistant
Hurricane Katrina on the New Orleans Economy.” Monthly Labor           Comparative Law 58: 69–95. doi:10.5131/ajcl.2009.0031.69.             Kelly Quantrill, Research Assistant
Review 130 (6): 3–17. http://search.ebscohost.com/login.aspx?di                                                                              Dr Andy Skelton, Senior Risk Researcher
rect=true&db=bth&AN=26962930%5C nfile:///D:/Google Drive/              Nejat, Ali, and Souparno Ghosh. 2016. “LASSO Model of                 Andrew Smith, Research Assistant
Emergency Management Courses/Royal Roads Programme/                    Postdisaster Housing Recovery: Case Study of Hurricane Sandy.”        Kayla Strong, Research Assistant
DEMN 504/The effects of Hurricane Katrina on the New Orleans           Natural Hazards Review 17 (3): 4016007. doi:10.1061/(ASCE)
economy.pdf.                                                           NH.1527-6996.0000223.

Feria-Domínguez, José, Pilar Paneque, and María Gil-Hurtado.           Petterson, John S, Laura D Stanley, Edward Glazier, and James
2017. “Risk Perceptions on Hurricanes: Evidence from the U.S.          Philipp. 2006. “A Preliminary Assessment of Social and Economic
Stock Market.” International Journal of Environmental Research and     Impacts Associated with Hurricane.” American Anthropologist,
Public Health 14 (6): 600. doi:10.3390/ijerph14060600.                 New Series 108 (4): 643–70.
                                                                       http://www.jstor.org/stable/4496510.
Gallagher, Justin, and Daniel Hartley. 2017. “Household Finance
after a Natural Disaster: The Case of Hurricane Katrina.” American     Smith, James Patterson. 2012. Hurricane Katrina: The Mississippi
Economic Journal: Economic Policy 9 (3): 199–228. doi:10.1257/         Story. University Press of Mississippi.                                                                                                 MAKE YOUR WORLD GO
pol.20140273.
                                                                       Spader, Jonathan, and Jennifer Turnham. 2014. “CDBG Disaster
Hallegatte, Stéphane. 2008. “An Adaptive Regional Input-Output         Recovery Assistance and Homeowners’ Rebuilding Outcomes
Model and Its Application to the Assessment of the Economic            Following Hurricanes Katrina and Rita.” Housing Policy Debate.                                                                          The information contained herein is intended for informational purposes only. Insurance coverage in
                                                                                                                                                                                                               any particular case will depend upon the type of policy in effect, the terms, conditions and exclusions
Cost of Katrina.” Risk Analysis 28  (3): 779–99. doi:10.1111/j.1539-   Taylor & Francis. doi:10.1080/10511482.2013.862839.                                                                                     in any such policy, and the facts of each unique situation. No representation is made that any specific
                                                                                                                                                                                                               insurance coverage would apply in the circumstances outlined herein. Please refer to the individual
6924.2008.01046.x.                                                                                                                                                                                             policy forms for specific coverage details.

                                                                                                                                                                                                               XL Catlin, the XL Catlin logo and Make Your World Go are trademarks of XL Group Ltd companies.
                                                                                                                                                                                                               XL Catlin is the global brand used by XL Group Ltd’s (re)insurance subsidiaries.
                                                                                                                                                                                                               XL Reinsurance America, Inc. Information accurate as of June 2018.
You can also read