DISCIPLINED GROWTH + SHAREHOLDER RETURNS - OUR 10 YEAR JOURNEY AGM PRESENTATION MAY 8, 2019 - Parex Resources Inc.
←
→
Page content transcription
If your browser does not render page correctly, please read the page content below

DISCIPLINED GROWTH +
SHAREHOLDER RETURNS

OUR 10 YEAR JOURNEY

AGM PRESENTATION
MAY 8, 2019

                       AGM PRESENTATION | MAY 2019   1
WHAT PAREX HAS ACCOMPLISHED IN 10 YEARS

Parex as of:                                                    Inception                  Today
Production(boe/d)                                                              Nil             ~52,000           Since inception
2P Reserves (MMboe)(1)                                                         Nil                     186
                                                                                                                 Parex has delivered
                                                                                                                 Material growth and
Working Capital (US$ MM)(2)                                                $105                     $207
                                                                                                                 Value creation
Bank Debt (US$MM)(2)                                                           Nil                         Nil
                                                                                                                 while maintaining
Market Capitalization (C$MM)(3)                                            $175                ~$3,039
(1) Parex’ working interest, as per the independent reserve report prepared by GLJ Petroleum Consultants
                                                                                                                 Financial discipline
    effective Dec. 31, 2018
(2) As at March 31, 2019
(3) Assuming C$20.63 share price and 147.3 outstanding shares at May 7, 2019

  November 2019 is our 10 year anniversary

                                                                                                                       AGM PRESENTATION | MAY 2019   2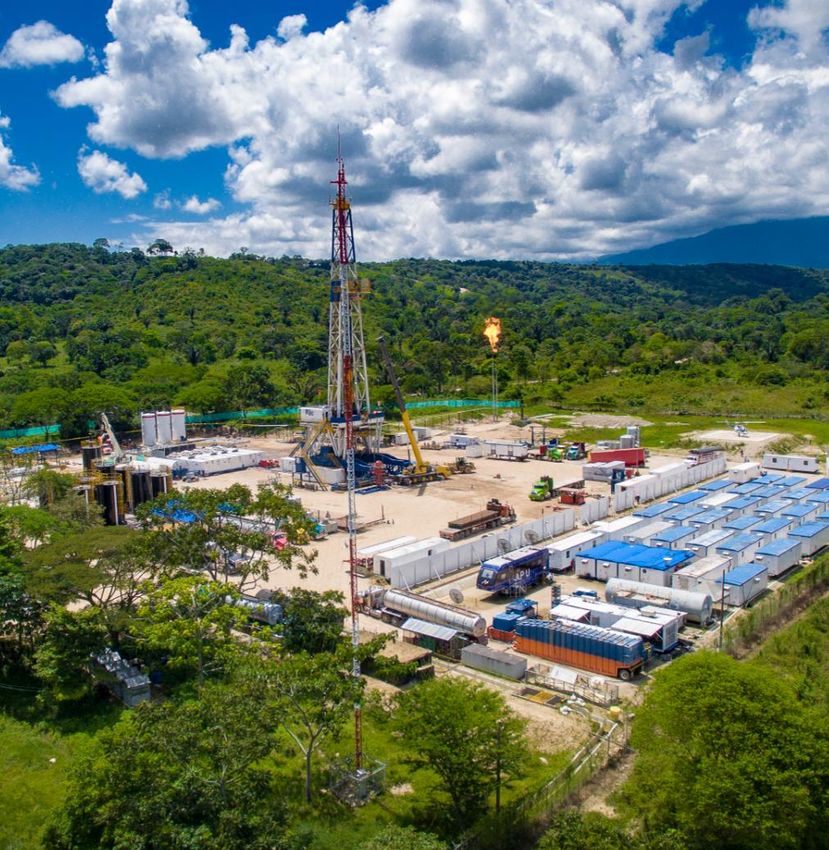
WHAT PAREX HAS ACCOMPLISHED IN 10 YEARS
PRODUCTION PER SHARE (DEBT ADJUSTED)
2P RESERVES PER SHARE (DEBT ADJUSTED)
450
1600
BOE/MILLION WA BASIC SHARES
400
1400
MBOE/MM BASIC SHARES
350
300 1200
250 1000
200 800
150 600 CFO at $65/bbl
100 400 CFO at $60/bbl
50 200
0 CFO at $55/bbl
0
2010 2011 2012 2013 2014 2015 2016 2017 2018 2019E Returning
2010 2011 2012 2013 2014 2015 2016 2017 2018capital
(Shares repurchases)
PAREX ACREAGE PRICE PERFORMANCE
Spin-out Bid Round Farm-in Acquisition Divested/Relinquished Farm-out
Parex TSX TTEN
2,500 CFO at $50/bbl Parex 509
600
2,000 BRENT Exploration
500
NET ACRES (000)
1,500 400
300 Development
1,000
200
500 Maintenance
100
-
0
(500)
(1,000)
2009 2010 2012 2013 2014 2015 2016 2017 2018 2019YTD
Delivered Shareholder Value
AGM PRESENTATION | MAY 2019 3
WHERE ARE WE TODAY?
1. 50,000 bopd milestone achieved
2. 3rd largest producer in Colombia
3. No debt and positive Q1’19 WC of US$207MM
4. High margin operation
    o Q1’19 funds flow netback→ US$28/boe @ Brent $64/bbl            CFO at $60/bbl
                                                                     CFO at $55/bbl
5. Ability to grow within cash flow:                                                         Returning capital
                                                                                             (Shares repurchases)
    o 2017 Production growth: 20% self-funded
    o 2018 Production growth: 25% self-funded                        CFO at $50/bbl
    o 2019E Production growth: ~20% self-funded                         BRENT                   Exploration

6. Capital allocation discipline                                                               Development

    o Balanced capital program and return of capital                                           Maintenance

7. Focused management
    o Ability to grow within a single country → Colombia

                             Continue to Deliver Shareholder Value
                                                                                  AGM PRESENTATION | MAY 2019       4
OUR BUSINESS IS LOW COST
                                Parex Cash Netback(1)                                                                                        2019 Target Cash Netbacks(2)
          $80                          $74.97            $75.84                                                                                                                            $75
          $75                                                                                                                                                                 $70
                      $67.27                                              $68.32
          $70                                                                                                                                                       $65
                                                                                           $63.83
          $65                                                                                                                                      $60
          $60
                                                                                           ($11.50)
          $55
          $50                                                                               ($6.39)
          $45
USD/BOE

                                                                                            ($5.71)
          $40                                                                               ($4.06)
          $35                                                                               ($3.18)
          $30                                                                               ($5.34)
          $25
          $20
          $15
          $10
           $5                                                                                                                        (3)
                       $28.10           $31.62            $36.68           $31.39            $27.65      Cash Netback                             $24-26          $27-29    $30-32        $33-35
           $0
                     Q1 2018          Q2 2018           Q3 2018          Q4 2018           Q1 2019                                                               2019 GUIDANCE

                 Cash Netback         Tax       G&A-Finance          Transportation        Opex        Royalties      Differential         Brent Price
                (1) Cash netbacks are a non-GAAP measure defined as funds flow from operations per barrel of oil
                (2) 2019 target cash netbacks are based on production guidance mid-point excluding hedges and decommissioning & environmental liabilities.
                (3) Q2 2018 tax and cash netback adjusted to exclude a $137.5 million one-time voluntary tax restructuring during the three months ended June 30, 2018
                See advisories at the end of this presentation
                                                                                                                                                                           AGM PRESENTATION | MAY 2019   5
2019 PLAN: HIGH NETBACKS ENABLE SHAREHOLDER RETURNS
                 $900
                 $850
                 $800           2018YE
                 $750           Working
                 $700           Capital
                                                                                                                                                                              Optionality
                 $650       CFO at $75/bbl                                                                                                                                    (+/- ~$400)
MILLIONS (USD)

                 $600
                            CFO at $70/bbl
                 $550
                 $500       CFO at $65/bbl
                 $450       CFO at $60/bbl                                                                                                                        ~$226(1)
                 $400        CFO at $55/bbl                                               Capex: ~$215
                 $350
                 $300
                 $250            CFO at                                                                        ~$75                        ~$15
                                 $50/bbl
                 $200
                 $150
                                 BRENT                                              ~$50
                 $100                                     ~$75
                  $50
                   $0
                          SOURCES OF CASH            MAINTENANCE               DEVELOPMENT                EXPLORATION                   BUS DEV.                        NCIB(1)           COLUMN1

                    (1)   Normal issuer course bid assumes up to ~14.2 million shares repurchased at ~$21/share on average using a 2019E USD-CAD average rate of 1.32

                                                                                                                                                                                  AGM PRESENTATION | MAY 2019   6
INDUSTRY LEADING FREE CASH FLOW RETURN

                                           Capital allocation strategy for “optionality”
                                 ~27%

                                            o Projects must “compete” for capital internally
                                            o Returning capital to shareholder
                                            o Investment/capital strategy has not changed
                                              just because we have significant FCF

In 2019, we plan to grow production by 20%, drill 16 exploration wells, buy-back 15
         mm shares AND remain debt free with increased working capital
                                                                      AGM PRESENTATION | MAY 2019   7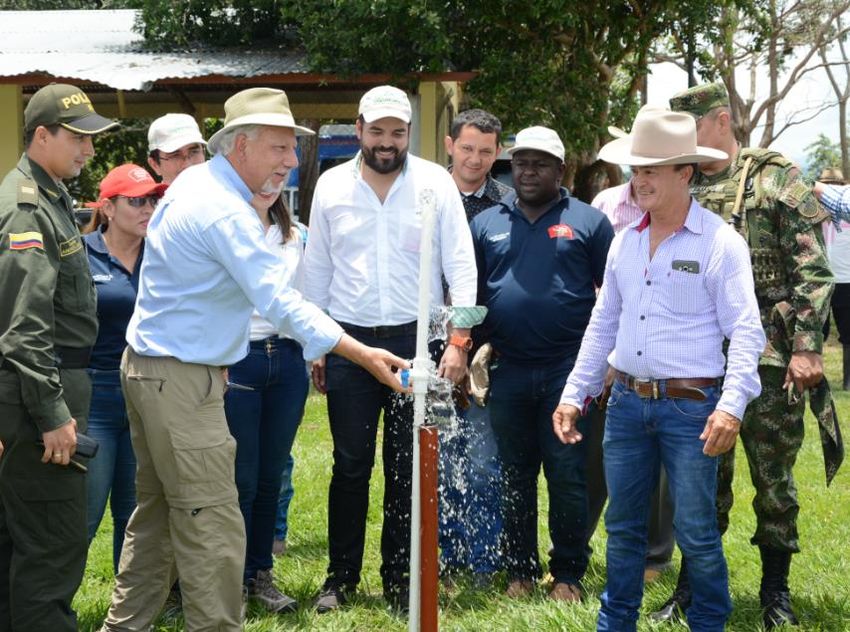
FINDING & DEVELOPING CONVENTIONAL OIL RESERVES CREATES VALUE

                                                                                                                                                             $9
                                                                                                                   Proved+
                                                                                                                                                             $8
                                                                                        Proved +                 Probable+
2018 Year-End                                                     Proved                Probable                   Possible                                  $7
FD&A USD/boe(1)                                                    $7.03                   $7.29                      $7.59                                  $6

                                                                                                                                      2P FD&A (USD/BOE)(1)
Recycle Ratio (FD&A)(1)                                                4.5x                       4.3x                         4.1x
                                                                                                                                                             $5
                                                                                                                                                             $4
After Tax NPV10% -                      CAD/sh(2)                 $21.25                     $30.18                     $40.69
Working Capital - CAD/Sh(3)                                          $1.92                     $1.92                      $1.92                              $3

Total CAD/Sh(3)                                                   $23.17                     $32.10                     $42.61                               $2
(1)   Per the independent reserve reports prepared by GLJ Petroleum Consultants Ltd. effective Dec. 31 of the reported year,                                 $1
      including Future Development Cost. Recycle Ratio is calculated using Q4 2018 Funds Flow From Operations
      per barrel divided by annual F&D or FD&A as applicable.
(2)   Based on GLJ Petroleum Consultants Ltd. price forecast, as at January 1, 2019, which assumes $70.30/bbl over 2019-2023                                 $0
(3)   Working Capital of US$219 million (CAD 298 million) and 155 million shares at December 31, 2018
                                                                                                                                                                  2016             2017                2018
See advisories at the end of this presentation
                                                                                                                                                                         1 Year $/boe   3 Year $/boe

                                                                                              Solid Reserve Base
                                                                                                                                                                                  AGM PRESENTATION | MAY 2019   8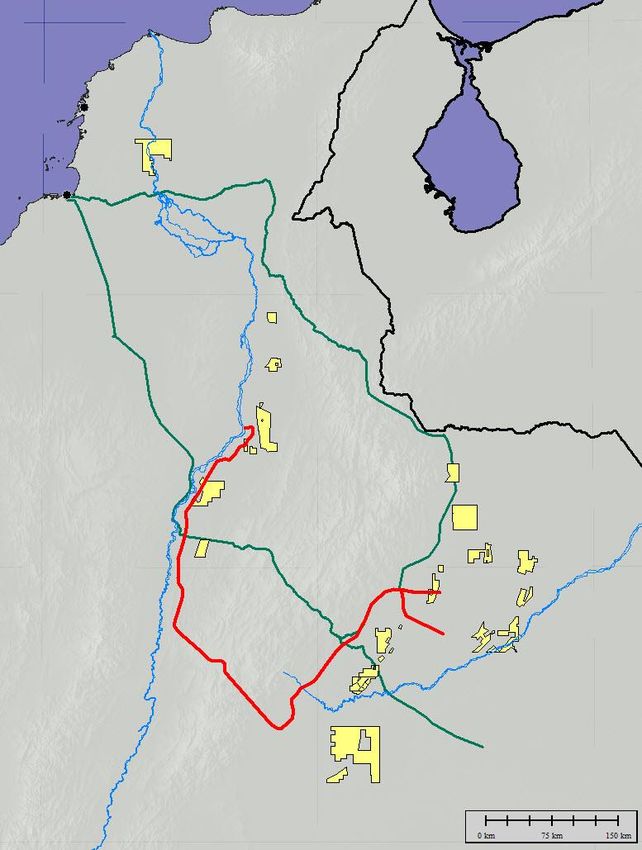
DIVERSIFIED 2019 DRILLING PROGRAM
          46 Gross Wells Planned
Llanos Basin             Expl. Wells   Dev. Wells
                                                       Lower Magdalena
o   Merecure                 1             -
o   Capachos                 1             -                                VIM-1

o   SoCa                     4            17
o   CPO-11                   1             -                                          Fortuna
                                                                             Playon

Middle Magdalena                                                                       DeMares
                                                    Middle Magdalena                                     Capachos
o Aguas Blancas              3            12                                    Aguas Blancas

o DeMares/Playon             3             -                                                                        Merecure
o Fortuna                    2            1
                                                                                                SoCa
                                                                                                                       Llanos Basin
                                                                                                CPO-11
VIM-1: Lower Magdalena
o La Belleza                 1
                                                                 COLOMBIA
Total Wells Planned          16           30
                                                                                                         AGM PRESENTATION | MAY 2019   9
FOUNDATION FOR GROWTH: APPRAISE, DEVELOP & GENERATE FCF
                                                                                                                                                    ODL Offloading
                                                                                      Faults
                                                                                      GLJ 3P (2018YE)
                 NET WORKING INTEREST PRODUCTION                                      Exploration Wells                            LLA-32
                                                                                      Pipeline                           Carmentea
                               (SOCA AREA)
         50
                                                                                                                                        Calona
         45                                                                                                        AZOGUE                Kananaskis

         40
                                                                                     LLA-34
                                                                                                                                                        Max
                                                                                     Chachalaca                             Tilo
                                                                                                           Chiricoca
         35
                                                                                  GUACO                   Tigana                   Tarotaro
         30
MBOE/D

                                                                                                                          Tua
         25
                                                                                                                                   Aruco
         20                                                                         Jacana                    Curucucu
                                                                                                                    Jacamar
         15                                                                                           Tigui
                                                                                                     Totor
         10                                                                    Bacano
                                                                                  Faults                          Cabrestero
                                                                                                           GLJ 3P (2018YE)
                                                                                                     o Akira                                    2019 Exploration

         5
                                                                                                                                              SoCa Area
         -                                                                                                                                    Llanos Basin
              2012   2013   2014   2015      2016   2017   2018 Q1 2019   As per the independent reserve report prepared by GLJ. effective Dec. 31/18

                                   3-5 Years of Significant FCF Generation
                                                                                                                         AGM PRESENTATION | MAY 2019                 10
CAPACHOS DEVELOPMENT AND EXPLORATION POTENTIAL
Guadalupe
depth structure
Capachos (50% WI, Operator)
• Located in the Arauca District near the Venezuelan border ANDINA NORTE-1
• Producing at restricted rate of ~5,000 gross bopd
o Capachos-2: Guadalupe on production
ANDINA-1
o Andina-1: Guadalupe on production ANDINA-2
o Andina-2: Guadalupe on production
• Phase-1 gas processing facility on line in Q2/19
CAPACHOS-2
• Drilling Andina Norte-1 exploration well
CAPACHOS SUR-2
Legacy well Parex wells Exploration
Facility/Pad Flowline
Successful Operation in a Challenging Area
AGM PRESENTATION | MAY 2019 11CAPACHOS EXPLORATION POTENTIAL
• Andina Norte prospect drilled the northern Andina-2 Andina-1
Andina Norte Prospect
fault compartment
o Well is cased and currently testing
Mirador
Prospective Zones Andina-1 Andina-2
Mirador
Mirador Untested Untested Guadalupe
Guadalupe Producing ~1,000 bopd -
(restricted) Guadalupe
Upper Guad. Untested 1,606 bopd &
0.8 MMcf/d
(gross) Une
Lower Guad. 2,570 bopd & 2,195 bopd & Une
1.2 MMcf/d (gross) 0.9 MMcf/d
(gross)
Une 2,545 bopd & Untested
8.7 MMcf/d (gross)
AGM PRESENTATION | MAY 2019 12WE GIVE BACK TO THE COMMUNITIES WHERE WE OPERATE
What we do and how we impact the community
At Capachos, we established open dialog with
stakeholders
• Arauca’s leaders visited our Casanare operations to
assess our performance record (social initiatives,
economic impact & environmental stewardship)
• We targeted our social investments towards
Community priorities (e.g. water access & housing)
• Garnered local support from community leaders and
formed key partnerships with institutions
US$400,000 funding the upgrade of the rural aqueduct system to
• Committed to uphold ethnic groups’ rights provide clean water supply coverage for ~1,200 people
• Built strong relationships through the procurement of
local goods & services
Open Dialog + Transparency + Partnerships = Tailored Initiatives & Community Buy-in
AGM PRESENTATION | MAY 2019 13CORPORATE ESG INITIATIVES
Water for All (US$1.6 Million) Home Improvement (US$4.9 Million) Projects for Taxes (US$340,000)
• Invest in clean water supply infrastructure • Align with local development plans • Government of Colombia program to rebuild rural areas
• Ministry of Mines & Energy’s and ANH awarded initiative • Parex supplies building materials • Companies invest up to 50% of taxes in projects
• Show O&G projects contributing to clean water provision • Communities provide assurance of good use of materials • Parex was the 1st program participant
US$15 million invested in projects since 2014
Investments focused on economic development and improvement of local infrastructure/services.
AGM PRESENTATION | MAY 2019 14VIDEO – INSTALLATION OF WEATHER RADAR IN CARIMAGUA
Installation
of weather
radar
capable of
delivering
early
warning
signs for
weather
conditions
Covers ~1.2
million
people
AGM PRESENTATION | MAY 2019 15BEYOND 2019: ASSET REPLENISHMENT FOR FUTURE GROWTH
Trucking
(1) Parex Blocks
1. Fortuna Cartagena
Pipeline
o Acquired Q4/18
o 3 wells planned in 2019 River
Terminal Covenas
(1)
2. CPO-11
o Acquired Q4/18
3. Merecure FORTUNA
o Acquired Q1/19
4. ANH Bid Round Q2/19
o Expect to be active participant
o Regular quarterly Bid Round to follow
Mercure
Why we like these and timing of activity
✓ Material prospect sizes
✓ Wide variety of play types
✓ Accessible operating areas for 2019-2020 drilling
CPO-11
(1) Subject to regulatory approval
See advisories at the end of this presentation
AGM PRESENTATION | MAY 2019 16WHERE ARE WE GOING FROM HERE?
2019 2020 - 2022
Our focus
Is on Profitable
Production growth Deliver top quartile Future Growth
& Delivering
& free cash flow per share growth
Shareholder Returns
New growth: Replenish &
exploration & tight oil diversify portfolio
Shareholder return: Return free cash
Share buybacks flow to shareholders
AGM PRESENTATION | MAY 2019 17THANK YOU FOR THE SUPPORT
On behalf of our Board of Directors
and the team at Parex, we thank
all our stakeholders for their
continued support.
Investor Relations
Contact us:
Mike Kruchten
Sr. VP, Capital Markets & Corporate Planning
Tel: +1 (403) 517-1733
AGM PRESENTATION | MAY 2019 18MANAGEMENT TEAM
Dave Taylor, CEO & President Ken Pinsky, Chief Financial Officer
Mr. Taylor is responsible for creating, planning, implementing and integrating the strategic direction His geologically Over 25 years of in-depth financial experience, with the last 16 years holding senior financial roles in the upstream O&G
driven, business-minded focus on exploration, production and business development activities has been successfully sector focusing on corporate finance , governance, taxation and investor relations. Mr. Pinsky served as CFO of Petro
applied in prior companies over his 35 year career. From 2015 to 2017, he served as President and EVP Exploration & Andina from 2008 to 2009, prior to that, he was CEO of Argent Energy Trust from 2001 to 2004, Director of Finance for
BD (2009-2015) at Parex. Mr. Taylor was VP Business Development of Petro Andina (2007-2009). Prior to that, he was the Atlanta Exploration Group of Companies from 1997-2001. He began his career at Price Waterhouse in 1987, he is
VP Exploration and Int’l Operations with Husky Energy and VP Exploration for Renaissance Energy. He has also held currently a member of the Canadian Institute of Chartered Accountants and a Chartered Financial Analyst.
various management, business development and senior technical positions with Chauvco, Imperial Oil and Exxon
Production Research. Mr. Taylor holds a MSc. and a BA in Geology. He is a member of APEGGA, CSPG, AAPG, and is a
former Director of Geoscience BC.
Eric Furlan, Chief Operating Officer Ryan Fowler, Sr. VP Exploration & Business Development
Mr. Furlan has worked in a variety of roles ranging from field operations to reservoir development planning and
execution since the beginning of his career. He served as SVP of Engineering from 2017 to 2018 and VP of Mr. Fowler is accountable for leading his team in identifying and securing top-tier exploration and development
Engineering from 2012 to 2017 at Parex. Prior to Parex, Mr. Furlan was the General Manager of Development at opportunities. He has close to 30 years of experience in exploration and production activities. He served as VP
Petro Andina. He has also held leadership and senior technical positions with Chevron Corporation in Canada and Exploration for Parex (2012-2017), New Ventures Exploration Manager for Petro Andina and then Parex (2008-2012).
internationally. He holds a Bachelor of Applied Science in Chemical Engineering and he is a member of APEGGA. Prior to that, Mr. Fowler held management positions in Northern Alberta production and Int’l New Ventures at Husky
Energy and various senior technical positions at Husky Energy, Canadian 88 Energy, and Rigel O&G focused after
starting his career as a geologist at Amoco Canada. He holds a Bachelor of Applied Science in Geological Engineering.
Mike Kruchten, Sr. VP Capital Markets & Corporate Planning Lee DiStefano, President & Country Manager Colombia
Mr. Kruchten is responsible for investor relations, enterprise risk management, financial forecasting and strategic As the President and Country Manager of Parex Resources , Mr. DiStefano is responsible for Parex’ exploration,
planning. Previously, He was VP Capital Markets & Corporate Planning (2009-2019) and Manager, Corporate Planning production, and marketing activities in Colombia. Prior to joining Parex Colombia in 2011, Mr. DiStefano enjoyed a 30-
and Investor Relations of Petro Andina Resources and Parex (2008-2009) . Prior to joining Petro Andina, Mr. Kruchten year long int’l career serving in Country Manager roles with Amoco in Peru and Brazil, for Canadian Hunter in Argentina
had several financial leadership roles with BP in Calgary, Aberdeen and Dubai and began his career as a gas and as Exploration Manager Latin America/Far East for Noble Energy. Prior to assuming the Country Manager positions
economist with Union Gas (Enbridge) in 1994. He holds a Bachelor of Economics degree, a Masters in Economics, an with Amoco, Mr. DiStefano performed various exploration related functions for Amoco in Colombia, Trinidad,
MBA and a Certified Professional in Investor Relations (CPIR) designation Guatemala, Spain, New Zealand, India and northeastern China. He holds MSc. Geology, a BA in Geology and an MBA.
Josh Share, VP Corporate Services
Mr. Share joined Parex in 2019 as VP Corporate Services. He has over 15 years of experience in Human Resources in
the energy sector, with broad expertise in leading int’l and domestic HR, Communications and Corporate Services
functions. His int’l experience includes operations and new entry in various countries. Mr. Share began his HR
career at Nexen, gaining experience in Total Rewards and Talent Acquisition before moving to BP Canada, then
transferred to BP in the US and assumed roles of increasing responsibility across the Upstream Segment becoming
HR Director for Western Hemisphere. In 2014, Mr. Share returned to Nexen as General Manager, HR Business
Partners. Later, he took on the role of General Manager - Total Rewards & HR Programs, followed by VP, HR,
Communications & Corporate Services for Nexen/CNOOC Int’l businesses. He holds a Bachelor of Education degree
from the University of Winnipeg and a Master of Business Administration from the Haskayne School of Business.
AGM PRESENTATION | MAY 2019 19ADVISORIES
This presentation is provided for informational purposes only as of May 8, 2019 is not complete, and
may not contain certain material information about Parex Resources Inc. ("Parex" or the "Company"),
including important disclosures and risk factors associated with an investment in Parex. This
presentation does not take into account the particular investment objectives or financial circumstances
of any specific person who may receive it and does not constitute an offer to sell or a solicitation of an
offer to buy any security in Canada, the United States or any other jurisdiction. The contents of this
presentation have not been approved or disapproved by any securities commission or regulatory
authority in Canada, the United Sates or any other jurisdiction, and Parex expressly disclaims any duty on How to reach us
Parex to make disclosure or any filings with any securities commission or regulatory authority, beyond
that imposed by applicable laws. PARE X RESOURCES INC.
2700 Eighth Avenue Place, West Tower
Forward-Looking Statements and FOFI
Certain information regarding Parex set forth in this document contains forward-looking statements that 585 8th Avenue SW Calgary
involve substantial known and unknown risks and uncertainties. The use of any of the words "plan", AB T2P 1G1 Canada
"expect", “prospective”, "project", "intend", "believe", "should", "anticipate", "estimate" or other similar
words, or statements that certain events or conditions "may" or "will" occur are intended to identify
forward-looking statements. Such statements represent Parex' internal projections, estimates or beliefs Tel: 403-265-4800
concerning, among other things, future growth, results of operations, production, future capital and
other expenditures (including the amount, nature and sources of funding thereof), plans for and results Fax: 403-265-8216
of drilling activity, business prospects and opportunities. These statements are only predictions and
actual events or results may differ materially. Although the Company’s management believes that the
Email: investor.relations@parexresources.com
expectations reflected in the forward-looking statements are reasonable, it cannot guarantee future Website: www.parexresources.com
results, levels of activity, performance or achievement since such expectations are inherently subject to
significant business, economic, competitive, political and social uncertainties and contingencies. Many
factors could cause Parex' actual results to differ materially from those expressed or implied in any Mike Kruchten
forward-looking statements made by, or on behalf of, Parex.
In particular, forward-looking statements contained in this document include, but are not limited to,
Sr. Vice President, Capital Markets & Corporate Planning
statements with respect to the performance characteristics of the Company's oil properties; the
Company's vision, strategy and values; Parex' estimated 2019 capital budgets, including the expected
allocation of such budget to the number of wells and capital expenditures for each of
development/appraisal in existing fields, exploration, appraisal and maintenance;
AGM PRESENTATION | MAY 2019 20ADVISORIES
the Company's forecasted 2019 average production; the Company's estimated average daily production for full year 2019; the Company's planned capital program, including anticipated amounts focused on
existing discoveries and the appraisal programs and the timing of drilling key exploration prospects, seismic programs and development drilling; anticipated cash flow, cash flow per share, funds flow from
operations netback, capital expenditures, percentage of cash flow growth, cash netbacks, and funds flow from operations for 2019; the Company's exploration, development and appraisal program for 2019
including anticipated number and type of wells, drill ready prospects, the focus of development/appraisal drilling and the potential for drilling of additional follow-up appraisal wells and facilities in 2019;
exploration prospects; the Company's exploration schedule; the Company's drilling plans and production capability/potential; anticipated drilling locations, including the Company's delineation and drilling
plans; the Company's plans to target additional growth opportunities; the Company's future plans for its business, including plans to complete further acquisitions and increase production; financial and
business prospects and financial outlook; and activities to be undertaken in various areas. Statements relating to "reserves" or "resources" are forward-looking statements, as they involve the implied
assessment, based on estimates and assumptions that the reserves and resources described exist in the quantities predicted or estimated and can be profitably produced in the future.
• These forward-looking statements are subject to numerous risks and uncertainties, including but not limited to, the impact of general economic conditions in Canada and Colombia; industry conditions including
changes in laws and regulations including adoption of new environmental laws and regulations, and changes in how they are interpreted and enforced, in Canada and Colombia; competition; lack of availability
of qualified personnel; the results of exploration and development drilling and related activities; risks related to obtaining required approvals of regulatory authorities, in Canada and Colombia and partner and
community approvals in Colombia; risks associated with negotiating with foreign governments as well as country risk associated with conducting international activities; volatility in market prices for oil;
fluctuations in foreign exchange or interest rates; environmental risks; changes in income tax laws, tax rates and/or incentive programs relating to the oil industry; changes to pipeline capacity; ability to access
sufficient capital from internal and external sources; failure of counterparties to perform under the terms of their contracts; risk that Parex’ evaluation of its existing portfolio of assets and exploration and
development opportunities is not consistent with its expectation’s; that production test results may not be indicative of long-term performance or ultimate recovery and other factors, many of which are beyond
the control of the Company. Readers are cautioned that the foregoing list of factors is not exhaustive. Additional information on these and other factors that could effect Parex' operations and financial results
are included in reports on file with Canadian securities regulatory authorities and may be accessed through the SEDAR website (www.sedar.com).
• Although the forward-looking statements contained in this document are based upon assumptions which management believes to be reasonable, the Company cannot assure investors that actual results will be
consistent with these forward-looking statements. With respect to forward-looking statements contained in this document, Parex has made assumptions regarding, among other things: current commodity
prices and royalty regimes; availability of skilled labour; timing and amount of capital expenditures; future exchange rates; the price of oil, including the anticipated Brent oil price; the impact of increasing
competition; conditions in general economic and financial markets; availability of drilling and related equipment; effects of regulation by governmental agencies; receipt of partner, regulatory and community
approvals; royalty rates; future operating costs; effects of regulation by governmental agencies; uninterrupted access to areas of Parex' operations and infrastructure; recoverability of reserves and future
production rates; the status of litigation; timing of drilling and completion of wells; on-stream timing of production from successful exploration wells; operational performance of non-operated producing fields;
pipeline capacity; that Parex will have sufficient cash flow, debt or equity sources or other financial resources required to fund its capital and operating expenditures and requirements as needed; that Parex'
conduct and results of operations will be consistent with its expectations; that Parex will have the ability to develop it's oil and gas properties in the manner currently contemplated; current or, where applicable,
proposed industry conditions, laws and regulations will continue in effect or as anticipated as described herein; that the estimates of Parex' reserves volumes and the assumptions related thereto (including
commodity prices and development costs) are accurate in all material respects; that Parex will be able to obtain contract extensions or fulfill the contractual obligations required to retain its rights to explore,
develop and exploit any of its undeveloped properties; and other matters.
• Management has included the above summary of assumptions and risks related to forward-looking information provided in this document in order to provide shareholders with a more complete perspective on
Parex' current and future operations and such information may not be appropriate for other purposes. Parex' actual results, performance or achievement could differ materially from those expressed in, or
implied by, these forward-looking statements and, accordingly, no assurance can be given that any of the events anticipated by the forward-looking statements will transpire or occur, or if any of them do, what
benefits Parex will derive. These forward-looking statements are made as of the date of this document and Parex disclaims any intent or obligation to update publicly any forward-looking statements, whether as
a result of new information, future events or results or otherwise, other than as required by applicable securities laws. The forward-looking statements contained in this presentation are expressly qualified by
this cautionary statement.
AGM PRESENTATION | MAY 2019 21ADVISORIES
• This document also contains a financial outlook, in particular the information set forth on slides 2 and 4-6. Such financial outlook has been prepared by Parex' management to provide an outlook of the
Company's activities and results. The financial outlook has been prepared based on a number of assumptions including the assumptions discussed above and assumptions with respect to the costs and
expenditures to be incurred by the Company, capital equipment and operating costs, foreign exchange rates, taxation rates for the Company, general and administrative expenses and the prices to be paid for
the Company's production. Management does not have firm commitments for all of the costs, expenditures, prices or other financial assumptions used to prepare the financial outlook or assurance that such
operating results will be achieved and, accordingly, the complete financial effects of all of those costs, expenditures, prices and operating results are not objectively determinable. The actual results of
operations of the Company and the resulting financial results will likely vary from the amounts set forth in the analysis presented in this presentation, and such variation may be material. The Company and its
management believe that the financial outlook has been prepared on a reasonable basis, reflecting the best estimates and judgments, and represent, to the best of management's knowledge and opinion,
Parex's expected expenditures and results of operations. However, because this information is highly subjective and subject to numerous risks including the risks discussed above, it should not be relied on as
necessarily indicative of future results. Except as required by applicable securities laws, Parex undertakes no obligation to update such financial outlook.
Oil and Gas Information
• The estimates of Parex' December 31, 2018 reserves set forth in this presentation have been prepared by GLJ Petroleum Consultants Ltd. ("GLJ") as of December 31, 2018 with a preparation date of February
7, 2019 (the "GLJ 2017 Report") in accordance with National Instrument 51-101 – Standards of Disclosure for Oil and Gas Activities ("NI 51-101") and the Canadian Oil and Gas Evaluations Handbook (the
"COGEH") and using GLJ's forecast prices and costs as at January 1, 2019. The estimates of Parex' December 31, 2017 reserves set forth in this presentation have been prepared by GLJ as of December 31, 2017
with a preparation date of February 2, 2018 in accordance with NI 51-101 and the COGEH and using GLJ's forecast prices and costs as at January 1, 2018. The estimates of Parex' December 31, 2016 reserves
set forth in this presentation have been prepared by GLJ as of December 31, 2016 with a preparation date of February 6, 2017 in accordance with NI 51-101 and the COGEH and using GLJ's forecast prices and
costs as at January 1, 2017. The estimates of Parex' December 31, 2015 reserves set forth in this presentation have been prepared by GLJ as of December 31, 2015 with a preparation date of February 5, 2016
in accordance with NI 51-101 and the COGEH and using GLJ's forecast prices and costs as at January 1, 2016. The estimates of Parex' December 31, 2014 reserves set forth in this presentation have been
prepared by GLJ as of December 31, 2014 with a preparation date of February 13, 2015 in accordance with NI 51-101 and the COGEH and using GLJ's forecast prices and costs as at January 1, 2015. The
estimates of Parex' December 31, 2013 reserves set forth in this presentation have been prepared by GLJ as of December 31, 2013 with a preparation date of February 20, 2014 in accordance with NI 51-101
and the COGEH and using GLJ's forecast prices and costs as at January 1, 2014. The estimates of Parex' December 31, 2012 reserves set forth in this presentation have been prepared by GLJ as of December 31,
2012 with a preparation date of February 28, 2013 in accordance with NI 51-101 and the COGEH and using GLJ's forecast prices and costs as at January 1, 2013. The estimates of Parex' December 31, 2011
reserves set forth in this presentation have been prepared by GLJ as of December 31, 2011 with a preparation date of February 1, 2012 in accordance with NI 51-101 and the COGEH and using GLJ's forecast
prices and costs as at January 1, 2012. The estimates of Parex' December 31, 2010 reserves set forth in this presentation have been prepared by GLJ as of December 31, 2010 with a preparation date of
January 31, 2011 in accordance with NI 51-101 and the COGEH and using GLJ's forecast prices and costs as at January 1, 2011.
• “Proved" or "1P" reserves are those reserves that can be estimated with a high degree of certainty to be recoverable. It is likely that the actual remaining quantities recovered will exceed the estimated proved
reserves.
• "Probable" reserves are those additional reserves that are less certain to be recovered than proved reserves. It is equally likely that the actual remaining quantities recovered will be greater or less than the
sum of the estimated proved plus probable" reserves.
• “Possible” reserves are those additional reserves that are less certain to be recovered than probable reserves. There is a 10 percent probability that the quantities actually recovered will equal or exceed the
sum of proved plus probable plus possible reserves. It is unlikely that the actual remaining quantities recovered will exceed the sum of the estimated proved plus probable plus possible reserves.
AGM PRESENTATION | MAY 2019 22ADVISORIES
• "2P" means Proved Plus Probable reserves.
• "3P" means Proved Plus Probable Plus Possible reserves.
• Estimates of the net present value of the future net revenue from Parex' reserves do not represent the fair market value of Parex' reserves. The estimates of reserves and future net revenue from individual
properties or wells may not reflect the same confidence level as estimates of reserves and future net revenue for all properties and wells, due to the effects of aggregation.
• This presentation contains certain oil and gas metrics, including F&D, FD&A, FD&A/boe, reserves life index (or RLI), operating netbacks, cash netbacks, funds flow from operations netback, CAGR, and recycle
ratios, which do not have standardized meanings or standard methods of calculation and therefore such measures may not be comparable to similar measures used by other companies and should not be
used to make comparisons. Such metrics have been included herein to provide readers with additional measures to evaluate the Company's performance; however, such measures are not reliable indicators of
the future performance of the Company and future performance may not compare to the performance in previous periods and therefore such metrics should not be unduly relied upon. Management uses
these oil and gas metrics for its own performance measurements and to provide investors with measures to compare the Company's operations over time.
• Readers are cautioned that the information provided by these metrics, or that can be derived from the metrics presented herein, should not be relied upon for investment or other purposes. A summary of the
calculations of such metrics are as follows:
o Finding and development (“F&D”) costs are calculated by dividing capital expenditures by the change in reserves within the applicable reserves category. F&D costs, including FDC, include all capital
expenditures in the year as well as the change in FDC required to bring the reserves within the specified reserves category on production.
o Finding, development and acquisition ("FD&A”) costs represent the costs of property acquisition, exploration, and development incurred. The aggregate of the exploration and development costs
incurred in the most recent financial year and the change during that year in estimated future development costs generally will not reflect total finding and development costs related to reserves
additions for that year.
o FD&A costs are calculated as capital expenditures plus net acquisition costs plus change in FDC. FD&A per boe is calculated as FD&A costs divided by reserves additions for the applicable period.
o Funds Flow from Operations per boe is calculated by dividing Funds Flow from Operations by sales volume for the period.
o Operating netback is calculated as oil & gas revenue less expenses (royalties, production and transportation) divided by production for the period.
• "BOEs" may be misleading, particularly if used in isolation. A BOE conversion ratio of six thousand cubic feet of natural gas to one barrel of oil equivalent (6 mcf: 1 bbl) is based on an energy equivalency
conversion method primarily applicable at the burner tip and does not represent a value equivalency at the wellhead. Given that the value ratio based on the current price of crude oil as compared to natural
gas is significantly different from the energy equivalency of 6:1, utilizing a conversion on a 6:1 basis may be misleading as an indication of value.
• All of Parex’ crude oil reserves disclosed herein are located in Colombia. The Company has light, medium and heavy crude oil and natural gas liquids product types. The recovery and reserve estimates of
reserves provided in this document are estimates only, and there is no guarantee that the estimated reserves will be recovered. Actual reserves may eventually prove to be greater than, or less than, the
estimates provided herein. All evaluations and reviews of future net revenue contained in GLJ's reports are stated prior to any provision for interest costs or general and administrative costs and after the
deduction of royalties, development costs, production costs, well abandonment costs and estimated future capital expenditures for wells to which reserves have been assigned.
AGM PRESENTATION | MAY 2019 23ADVISORIES
Certain information in this document may constitute "analogous information" as defined in NI 51-101. Such information includes production estimates, drilling results, test rates, reserves estimates and other
information retrieved from other publicly available sources. Management of Parex believes the information is relevant as it may help to define the reservoir characteristics and production profile of lands in
which Parex may hold an interest. Parex is unable to confirm that the analogous information was prepared by a qualified reserves evaluator or auditor and is unable to confirm that the analogous information
was prepared in accordance with NI 51-101. Such information is not an estimate of the production, reserves or resources attributable to lands held or to be held by Parex and there is no certainty that the
production, reserves or resources data and economic information for the lands held or to be held by Parex will be similar to the information presented herein. The reader is cautioned that the data relied upon
by Parex may be in error and/or may not be analogous to such lands held or to be held by Parex.
• Certain other information contained in this presentation has been prepared by third-party sources, which information has not been independently audited or verified by Parex. No representation or warranty,
express or implied, is made by Parex as to the accuracy or completeness of the information contained in this document, and nothing contained in this presentation is, or shall be relied upon as, a promise or
representation by Parex.
• This presentation contains references to type well production and economics, which are derived, at least in part, from available information respecting the well economics of other companies and, as such,
there is no guarantee that Parex will achieve the stated or similar results, capital costs and return costs representative per well.
• References in this presentation to initial production test rates, initial "flow" rates, initial flow testing, and "peak" rates are useful in confirming the presence of hydrocarbons, however such rates are not
determinative of the rates at which such wells will commence production and decline thereafter and are not indicative of long term performance or of ultimate recovery. While encouraging, investors are
cautioned not to place reliance on such rates in calculating the aggregate production for Parex. Parex has not conducted a pressure transient analysis or well-test interpretation on the wells referenced in this
presentation. As such, all data should be considered to be preliminary until such analysis or interpretation has been done.
Financial Matters
• The Company discloses several financial measures that do not have any standardized meaning prescribed under International Financial Reporting Standards ("IFRS"). These financial measures include
operating netbacks, cash netbacks, funds flow netbacks, funds flow per share, free cashflow, and funds flow from operations. Management believes that these financial measures are useful supplemental
information to analyze operating performance and provide an indication of the results generated by the Company’s principal business activities. Investors should be cautioned that these measures should not
be construed as an alternative to net income or other measures of financial performance as determined in accordance with IFRS. Parex’s method of calculating these measures may differ from other
companies, and accordingly, they may not be comparable to similar measures used by other companies. Please see the Company’s most recent Management’s Discussion and Analysis, which is available at
www.sedar.com for additional information about these financial measures.
AGM PRESENTATION | MAY 2019 24AGM PRESENTATION | MAY 2019 25
You can also read