Discussion Paper Best Practices in Electric Mobility - UNIDO
←
→
Page content transcription
If your browser does not render page correctly, please read the page content below

Discussion
          Paper
          Best Practices in
          Electric Mobility

Discussion Paper
Best Practices in
Electric Mobility

                                                                                              i
     I N C L U S I V E A N D S U S TA I N A B L E I N D U S T R I A L D E V E L O P M E N T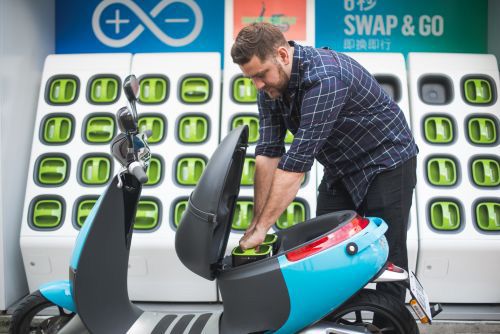
© UNIDO 2019. All rights reserved.

This document has been produced without formal United Nations editing. The designations employed and
the presentation of the material in this document do not imply the expression of any opinion whatsoever on
the part of the Secretariat of the United Nations Industrial Development Organization (UNIDO) concerning
the legal status of any country, territory, city or area or of its authorities, or concerning the delimitation of its
frontiers or boundaries, or its economic system or degree of development. Designations such as “developed”,
“industrialized” or “developing” are intended for statistical convenience and do not necessarily express a
judgement about the stage reached by a particular country or area in the development process. Mention of
firm names or commercial products does not constitute an endorsement by UNIDO.
Discussion Paper
 Best Practices in
 Electric Mobility

      Vienna, 2019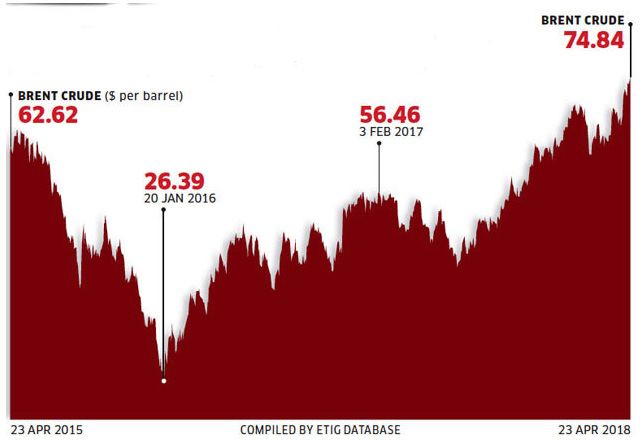
List of Abbreviation
2-W    Two Wheeler
AC     Alternating Current
ASEAN	Indonesia, Thailand, Malaysia, Singapore, Philippines, Vietnam, Brunei, Cambodia,
       Myanmar (Burma), Laos
AT&C   Aggregate Technical & Commercial
BEV    Battery Electric Vehicle
CARB   California Air Resources Board
CDFI   Community Development Financial Institution
CLMV   Cambodia, Laos, PDR, Myanmar and Vietnam
CPUC   California Public Utilities Commission
DC     Direct Current
EESL   Energy Efficiency Services Limited
EU     European Union
EUR    Euro
EV     Electric Vehicle
EVSE   Electric Vehicle Suplly equipment
GEF    Global Environment Facility
GHG    Greenhouse Gas
HEV    Hybrid Electric Vehicle
ICE    Internal Combustion Engine
IMPT   Indonesia, Malaysia, the Philippines, Thailand
JEVA   Japanese Electric Vehicle Association
LAPD   Los Angeles Police Department
LCO    Lithium Cobalt Oxide cathode
LDV    Light Duty Vehicle
LFP    Lithium-iron-phosphate
Li-ion Lithium Ion
MBCDC  Multibank Community Development Corporations
MITI   Ministry of International Trade and Industry, Japan
NCA    Nickel-cobalt-aluminium
NMC    Nickel-manganese-cobalt
NMH    Nickel Metal Hydride
OEM    Original Equipment Manufacturer
PHEV   Plug in Hybrid Electric Vehicle
PHV    Plug-in Hybrid
PLDV   Passenger Light Duty Vehicle
PLEVs  Personal Light Electric Vehicles
PPP    Public Private Partnership
R&D    Research and Development
RE     Renewable Energy
RFID   Radio-Frequency Identification
RGGI   Regional Greenhouse Gas Initiative
ROEV   Roaming for EV Charging
TCO    Total Cost of Ownership
UK     United Kingdom
UNIDO  United Nations Industrial Development Organisation
US/USA United States of America
USD    United States Dollar
VAT    Value Added Tax
ZEV    Zero Emission Vehicle
Acknowledgment
The discussion paper on “Best Practices in Electric Mobility” is the outcome of the collaborative efforts of
the United Nations Industrial Development Organization and PricewaterhouseCoopers (PwC) Pvt. Ltd.
The team extends its profound thanks to Ms. Rana Ghoneim and Ms. Katarina Barunica Spoljaric for guidance
during the execution of the assignment. The team recognizes and extends its sincere gratitude to them for
the invaluable inputs provided during many interactions and deliberations. The team also appreciates the
support provided for coordination with the project teams in China, Malaysia and South Africa.
We would like to acknowledge the project teams of UNIDO programmes for taking out time to discuss the
specifics of the programme in the following countries:
• China: Mr. Ju Wang, and Ms. Xin Yang
• South Africa: Ms. Ashanti Mogosetsi, Mr. Conrad Kassier, Mr. Hiten Parmar
• Malaysia: Mr. Ahmad Zairin Bin Ismail
We would also like to acknowledge the in-house team of PwC for the support and guidance for bringing
the discussion paper to fruition.Foreword United Nations Industrial Development Organization (UNIDO) is implementing many programmes in association with Global Environment Facility (GEF) for development of electric mobility. The programmes have been running in China, South Africa and Malaysia under the 5th and 6th replenishment cycle of GEF. The objective of this paper is to provide a global assessment of practices, challenges, drivers and emerging best practices in major electric vehicle markets. The key leanings will form the inputs for designing further programmes in electric mobility by UNIDO and GEF. At this stage some countries have gained considerable experience in encouraging and adopting electric mobility. There is however no country that has reached 100% electric mobility. For countries that are yet to start their journey in electric mobility, global experience in the sector will form the basis for designing programmes to encourage uptake of electric vehicles. Additionally, countries that have considerable electric vehicles deployed on their roads can learn from their counterparts. The paper seeks to address the challenges that are faced by countries in employing EVs and setting up charging infrastructure. Exemplary programmes are discussed and best practices to overcome the barriers. We assess the key learnings for integrating the power sector with transport and incorporating electric mobility in the urban planning concept of transit oriented development. The paper also presents case studies from the e-mobility programmes UNIDO is implementing in association with GEF in China, South Africa and Malaysia. The case studies have been developed through detailed study of programme documents and in depth interviews with local teams in the countries.
Executive Summary
The world is making significant inroads to convert their transport sector to electric. Rising GHG emissions,
higher cost of crude oil and a reduction in battery costs have contributed to the rise of electric vehicles.
The shift to electric mobility is crucial to reduce emissions and governments across the world need to take
actions to encourage the adoption of EVs in every mode of transport.

In 2018, there were more than 5 million1 EVs on the road, with a significant increase of 2 million EVs in the
same year. China leads the world in volume of electric cars sold and Norway leads in the market share of
EVs in the new vehicle sales. China and USA have the largest number of public EVSEs installations.

The transition to electric mobility is faced with many challenges that need to be addressed by all stakeholders.
The barriers are across economic, regulatory, technical and informational domains as highlighted below.

     Economic Barriers               Regulatory Barriers             Technical Barriers             Informational Barriers

    Business viability issues       Characterization of EV          Charger standards and           Lack of awareness
    High Economic
         upfront EV Barriers
                      cost             Regulatory
                                    charging   activity Barriers     Technical
                                                                    protocol      Barriers
                                                                              issues             Informational
                                                                                                    Range anxietyBarriers
                                    Tariff related issues           Grid stability issues
       Business viability issues     Characterization of EV         Battery standards
                                                                   Charger  performanceand       Lack of awareness
       High upfront EV cost          charging activity              issues issues
                                                                   protocol                      Range anxiety
                                     Tariff related issues         Grid stability issues
                                                                   Battery performance
                                                                   issues
Despite the challenges, there are many opportunities now to encourage EV adoption across the world. The
developments in technology and changing government priorities have provided the required impetus to
e-mobility. The drivers for e-mobility are presented in the following infographic:

    Reduction in         Evolving battery    Evolving charging       Increase in           Rising crude         Increasing
    battery prices         technology            methods             Renewable               oil prices        government
                                                                       Energy                                    support

Changes in fuel and technology lead to many changes in the trade relations of countries. Co-operation
between countries can lead to many green “free” trade agreements that will reduce the cost of imports
between countries to encourage EVs. However, many countries with an automobile manufacturing base
would want to protect their domestic industry by raising import duties. Oil rich countries will also have to
find an alternate source of income with the reducing dependence on oil. In turn, requirement for cobalt,
nickel, lithium and other minerals will increase, as they are key elements in batteries that are currently in
circulation. The largest reserves of metals and minerals required for battery production are found in weak
states with poor governance records, which can lead to instability in the countries.

The local and national government take many steps to encourage electric mobility. As a first step, the
government should declare a well-defined roadmap or strategy that sets the mission and objectives for
the country to achieve electric mobility. The roadmap should have clear and well-defined objectives
for deployment of EVs and EVSE. The development of the roadmap should involve private and public
stakeholders during the formulation period to create a holistic policy and ensure their active participation.
For effective implementation, the government should follow by taking concrete legislative action and
setting a stringent monitoring mechanism. The local government at the city and state level can take the
programme further and supplement the initiatives taken at a central level. Due to the high capital cost of
EVs, financial incentives are necessary. The most effective incentives reduce the upfront cost of EV and can
be availed easily by consumers. Additionally, it is essential for governments to provide information about
EVs and the associated benefits, incentives and policies to the end consumer.

1      Global EV Outlook, 2019, IEA
The utilities are required to play an active role in providing a network of charging stations. In some regions utilities are not allowed to set up charging stations, however as in the case of California, allowing utilities to set up charging infrastructure has led to an increase in investment of EVSEs. A concern with the rising level of electric vehicles is that the pollution is being transferred to the power plants, since significant amounts of electricity is still produced by fossil fuel based thermal power plants. However, EVs can enable the transition to renewable energy as the batteries can act as storage for the power generated at by RE sources. Smart Charging can enable the bidirectional flow of current and help utilities manage EV load at times of peak demand. Countries should enable smart charging to take advantage of EVs in grid management. Additionally, countries should also allow the charging activity to not be considered as a resale of electricity but as a service to enable private sector investment in the sector. Transit Oriented Development is a concept in urban development and planning that encourages public transport. It focuses on the creation of pedestrian oriented pathways with easy connectivity to transit services to the rest of the city from transport hubs such as metro stations and bus stands. Governments should enable electrifying public transport services, car fleets and personal use vehicles to electric at such hubs. The technology of electric vehicles is constantly evolving, with faster charging methods and higher capacity batteries. It is important to ensure interoperability of the charging stations. This will ensure that all EV users have access to a robust charging network and there is less variability and easier adoption. Since EVSE business models are highly dependent on the utilization of the charging station, incentives must be provided in the short term till the business is viable for private players to invest. Additionally, there is no fixed EVs to EVSEs ratio in regions where there are a considerable number of EVs. It is essential for countries developing their plan to consider the residential and personal chargers while deciding on number of EVSEs. Without new business models emerging that create new relationships between private drivers, fleet managers, city managers, energy providers, the auto industry and central government, it will be difficult to scale up electric vehicles. Demand aggregation or bulk procurement is one of the most common model followed for adoption of electric vehicles for a public or private fleet. Outright purchase and collaborative procurement are some popular demand aggregation methods. In order to save the maintenance and operating hassle, some agencies also prefer leasing the vehicles in their fleet. Electric car sharing is also gaining popularity. It saves the hassle of owning a car (parking charges, fuel costs, etc.). In addition, since shared cars have greater utilisation percentage or average driving distance per day if compared to an owned car, the payback period for owning an electric car reduces significantly. For charging infrastructure deployment, governments are employing several business models. In China, a government agency installed substantial number of fast charging stations in order to overcome the hurdle of range anxiety from the mind of EV owners. Battery swapping stations are also becoming a popular concept. Swapping stations provide reduced charging times as well as increased battery life. Lastly, innovative financing mechanisms are required to mobilize the e-mobility ecosystem. Some of the common financing mechanisms for EVs and related charging infrastructure are Low interest rate loans, fee- bate mechanisms, green bonds, and microloans. Sometimes, multibank arrangement, operated by a group of banks to pool funding and provide lending, is also undertaken. Small business micro-loans can also be used to fund e-mobility ecosystem. Microloans are small-business loans offered at attractive interest rates to help businesses access capital for items like machinery or fixtures. These loans can facilitate funding for electric vehicle charging equipment and installation costs. It is clear that governments need to take concrete action to encourage electric mobility to take advantage of the benefits of the technology. International co-operation is essential to the development of electric mobility. Experiences from across the world and the understanding gained from these experiences have to be incorporated in further programmes across countries.
Table of Contents
1.      Overview of global electric mobility..................................................................................... 1
        1.1. Electric Mobility Landscape....................................................................................................1
        1.2. Key Barriers in EV adoption....................................................................................................2

2.      Drivers for Electric Vehicles (EV) adoption............................................................................ 4
        2.1. Reduction in battery prices.....................................................................................................4
        2.2. Evolving battery technology...................................................................................................5
        2.3. Evolving EVSE (Electric Vehicle Supply Equipment) technology............................................7
        2.4. Promotion of renewable energy.............................................................................................7
        2.5. Rising crude oil prices.............................................................................................................8
        2.6. Government support..............................................................................................................9

3.      Geopolitical implications for Electric Vehicles (EV) adoption................................................ 10
        3.1. International Trade..................................................................................................................10
        3.2. Energy Security.......................................................................................................................10
        3.3. Access to strategic resources..................................................................................................10
        3.4. Economic shocks and financial instability...............................................................................10

4.Analysis of Policy Initiatives in Electric Mobility................................................................... 11
  4.1. Key Learnings from Electric Mobility Roadmaps....................................................................11
		     Set a well-defined Electric Mobility roadmap.........................................................................12
  4.2. Key Learnings of Policy Initiatives in deployment of Electric vehicles....................................13
		     4.2.1. Local administration has to implement the national strategy......................................13
		     4.2.2. Involve stakeholders in policy formation and implementation....................................14
		     4.2.3. Set clear targets for implementation of electric mobility.............................................15
		     4.2.4. Incentives should be specific and easily available.......................................................15
		     4.2.5. Spread awareness about electric vehicles....................................................................18
  4.3. Key Learnings of Policy Initiatives to support convergence of energy and transport
		sectors.....................................................................................................................................18
		     4.3.1. Allow utilities to own EVSEs.........................................................................................19
		     4.3.2. Reduce Carbon Emission of Power Sector...................................................................19
		     4.3.3. Enable Smart Charging................................................................................................20
  4.4. Key Learnings of Policy Initiatives to support Transit Oriented Development.......................20
		     4.4.1. Electrify Ride Hailing Services......................................................................................21
		     4.4.2. Allow electric vehicles in last mile connectivity............................................................21

5.      Analysis of infrastructure and technology requirements for Electric Vehicles adoption....... 22
        5.1. Enable Interoperability of Charging Stations..........................................................................22
        5.2. Financial incentives should be given in the short term...........................................................22
        5.3. Apt ratio of public EVSE to EVs needs to be decided............................................................24
        5.4. EVSE should be incorporated into the Building Code Regulations.......................................24
        5.5. Characterization of the role of electricity................................................................................25
        5.6. Smart Charging should be encouraged..................................................................................25
        5.7. Battery Technology.................................................................................................................28
6. Analysis of Business Models.................................................................................................. 27
6.1. Bulk aggregation for fleets.....................................................................................................27
6.2. E-Car Sharing..........................................................................................................................28
6.3. State led charging models......................................................................................................29
6.4. Battery Swapping....................................................................................................................30
6.5. Second Life of Battery............................................................................................................31
7. Analysis of financing approaches........................................................................................... 32
7.1. Global Financing Mechanisms................................................................................................32
7.2. Low interest rate loans............................................................................................................32
7.3. Revolving Loan Fund (RLF).....................................................................................................32
7.4. Fee bate mechanism..............................................................................................................33
7.5. Green Bonds...........................................................................................................................33
7.6. Collaborative fund..................................................................................................................33
7.7. Multibank funding with a Loan-Loss Reserve..........................................................................34
7.8. Small business microloans......................................................................................................34
8. Recommendations 35
8.1. National Roadmaps and Policies............................................................................................35
8.2. Infrastructure and Technology................................................................................................35
8.3. Business Models for Deployment...........................................................................................36
8.4. Financing Electric Mobility......................................................................................................36
List of Figures
Figure 1. Electric car stock (BEV and PHEV) 2013-18 (in millions) �������������������������������������������������������� 1
Figure 2. EVSE Deployment ������������������������������������������������������������������������������������������������������������������ 1
Figure 3. Key Barriers in EV Adoption ��������������������������������������������������������������������������������������������������� 2
Figure 4. Drivers for EV adoption ���������������������������������������������������������������������������������������������������������� 4
Figure 5. Cost breakdown of BEV ��������������������������������������������������������������������������������������������������������� 4
Figure 6. Falling Li-ion Battery Prices ���������������������������������������������������������������������������������������������������� 5
Figure 7. Comparitive Analysis of Different Battery Types �������������������������������������������������������������������� 5
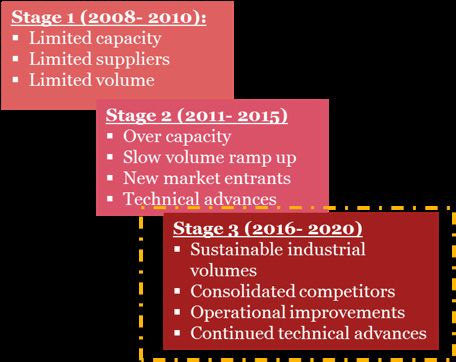
Figure 8. Stages of Li-ion Battery Development ����������������������������������������������������������������������������������� 6
Figure 9. Li-ion battery energy density ������������������������������������������������������������������������������������������������� 6
Figure 10. Charging Methods for EVs ����������������������������������������������������������������������������������������������������� 7
Figure 11. Case Study: CHINA fast DC charger deployment ����������������������������������������������������������������� 7
Figure 12. Global Renewable Energy Consumption ������������������������������������������������������������������������������� 8
Figure 13. Historical Crude oil prices ������������������������������������������������������������������������������������������������������ 8
Figure 14. Opportunities for Electric Mobility in Small Island Developing States ���������������������������������� 9Figure 15. Components of e-mobilty roadmaps ������������������������������������������������������������������������������������� 11
Figure 16. Planning Process for Policy Framework ���������������������������������������������������������������������������������� 12
Figure 17. Role of local administration ���������������������������������������������������������������������������������������������������� 14
Figure 18. Needs of EV stakeholders ������������������������������������������������������������������������������������������������������ 14
Figure 19. Types of Incentives for EVs ����������������������������������������������������������������������������������������������������� 16
Figure 20. Norway’s Incentives for e-mobility ����������������������������������������������������������������������������������������� 17
Figure 21. Methods of Raising Awareness for e-mobility ������������������������������������������������������������������������ 18
Figure 22. Requirements for Smart Charging ������������������������������������������������������������������������������������������ 20
Figure 23. Regulations for Electrifying Ride Hailing Services ������������������������������������������������������������������ 21
Figure 24. Types of Smart Charging �������������������������������������������������������������������������������������������������������� 26
Figure 25. Battery Subchemistry ������������������������������������������������������������������������������������������������������������� 26
Figure 26. Strategies for Demand Aggregation �������������������������������������������������������������������������������������� 27
Figure 27. Examples of efforts to encourage electrifying fleets through bulk procurement and
aggregating demand.............................................................................................................. 27
Figure 28. Examples of EV leasing ���������������������������������������������������������������������������������������������������������� 28
Figure 29. Examples of electric car sharing ��������������������������������������������������������������������������������������������� 29
Figure 30. China’s “Ten-cities, One-thousand vehicles” program ���������������������������������������������������������� 29
Figure 31. Gogoro battery swapping stations in Taiwan ������������������������������������������������������������������������� 30
Figure 32. Better Place battery swapping stations in Israel �������������������������������������������������������������������� 30
Figure 33. Application for Second life of EV Batteries ���������������������������������������������������������������������������� 31
Figure 34. Financing of e-mobility ���������������������������������������������������������������������������������������������������������� 32
Figure 35. GEF Focal Areas ��������������������������������������������������������������������������������������������������������������������� 32
Figure 36. Case Study – USA ������������������������������������������������������������������������������������������������������������������ 33
Figure 37. California’s “Clean Car Discount” program ��������������������������������������������������������������������������� 33
Figure 38. Examples of green bonds ������������������������������������������������������������������������������������������������������ 33
Figure 39. Japans Collaborative Fund ���������������������������������������������������������������������������������������������������� 34
Figure 40. Examples of micro loans �������������������������������������������������������������������������������������������������������� 34
List of Tables
Table 1. Electric Mobility Roadmaps ��������������������������������������������������������������������������������������������������� 11
Table 2. Examples of e-mobility targets ���������������������������������������������������������������������������������������������� 15
Table 3. Effective Policies for reducing carbon emmission ������������������������������������������������������������������ 19
Table 4. Interoperability Initiatives in USA ������������������������������������������������������������������������������������������� 22
Table 5. Global View of Subsidies/Incentives for EV Charging Infrastructure �������������������������������������� 23
Table 6. Ratio of EV’s to EVSE �������������������������������������������������������������������������������������������������������������� 241. Overview of global electric mobility
Over the last few years, electric mobility has once again been the subject of lively discussions due to
new, more powerful, rechargeable batteries and the high volatility on the oil markets. Strategic objectives
such as reducing the dependency on oil, more efficient energy transformation, significant CO2 reductions
and lowering local emissions from transport are important drivers of electric mobility. Electric mobility is
therefore a prominent topic in environmental, economic and social terms. Electric mobility could prove to
be the silver bullet for the mobility of tomorrow: vehicles that do not locally emit any pollutants or CO2
protect the environment and resources, especially if the electricity used comes from renewable energy
sources. In addition, they run quietly. This could ensure that our cities remain livable
1.1. Electric Mobility Landscape
The total number of electric cars in the world has crossed the 5 million mark in 20182, with an
increase of about 2 million e-cars in 2018 alone. China is the leader in electric car sales, followed
by Europe and the United States. China has the largest fleet of electric LCV with 57% of the
world’s stock. Norway has the highest share of electric cars in its transport sector sales at 46%.
Other transport modes such as 2-W and buses are also becoming electric. In 2018, the global stock of 2-W
was about 260 million and 460,000 electric buses were plying on international roads.
Electric car stock (BEV and PHEV) 2013-18 (in millions)
6
4
2
0
2013 2014 2015 2016 2017 2018
US Europe China Others
Figure 1. Electric car stock (BEV and PHEV) 2013-18 (in millions)
China and Japan have the maximum number of chargers installed to cater the available number of electric
vehicles. China has around 130,508 AC chargers and 83,395 fast DC chargers installed as of 2017. The chart
below provides a snapshot of number of publicly accessible AC and DC chargers by country for the year
2017. As evident from the graph, China has the highest number of AC as well as DC chargers, mainly due to
governmentEconomic
aggressive deploymentRegulatory
Barriers
policies and rebates. Whereas,
Barriers
countries suchInformational
Technical Barriers
as Norway and Sweden
Barriers
focus on home based charging, hence the number of public chargers are very low.
Business viability issues Characterization of EV Charger standards and Lack of awareness
EVSE E Deployment
High upfront EV cost charging activity protocol issues Range anxiety
Tariff related Deployment
E VSissues Grid stability issues 1000
15000 Battery performance
0 issues 800
AC DC BEVs 600
Chargers Chargers (1000)
400
5000
0 200
0 in
Reduction Evolving battery Evolving charging Increase in Rising crude 0 Increasing
battery prices technology methods Renewable oil prices government
Energy support
Figure 2. EVSE Deployment
2 Global EV Outlook, 2019, IEA
11.2. Key Barriers in EV adoption
Electric vehicle ecosystem is ready to proliferate in a major way; however, there is a long way to go before
this paradigm shift in transportation sector becomes a reality. Electric mobility market is still in its infancy
and point to many barriers for it to become a common mode of transportation. Barriers in EV adoption have
been discussed below:
Economic Barriers
• Business viability issues
• High upfront EV cost
Regulatory Barriers
• Characterization of EV charging activity
• Tariff related issues
Technical Barriers
• Charger standards and protocol issues
• Grid stability issues
• Battery performance issues
Informational Barriers
• Lack of awareness
• Range anxiety
Figure 3. Key Barriers in EV Adoption
1.2.1. Economic Barriers
Purchase Price of EVs
EVs have a higher price tag than conventional ICE cars due to the high price of the battery. This is a
significant hindrance for potential consumers.
Business Viability issues
EVS E Deployment 1000
EVs have a15000
high cost of acquisition in comparison to conventional ICE cars. Even though EVs have very low
operating 0costs, fleet operators that use traditional ICE vehicles will face higher capital cost to replace them
800
with EVs. It is difficult to offer EVs at the same rate as ICE vehicles or even deploy the vehicles at a higher
600
cost. AC DC BEVs
Chargers Chargers (1000)
400
5000
In the current scenario, it is challenging to construct a profitable business case for public EV charging
stations for0several reasons. These include high initial investments, low and uncertain near-term demand 200
for public charging
0 and high cost of electricity to public charging stations as compared to home charging. 0
As the penetration of electric vehicles is very low, utilization of initial Charging Stations would also be low,
resulting in negative Total Cost of Ownership (TCO) and revenues for the Charging Station Operators/
Owners.
21.2.2. Regulatory Barriers
Characterization of EV charging activity
The characterization of EV charging activity either as sale of electricity or service has been a point of
contention. Internationally, majority of the countries have characterized EV charging as a service, and
hence, have kept the market open for all the players without the requirement of obtaining any license from
Government authorities.
Tariff issues
For public charging stations, the cost of electricity constitutes a major component of overall cost of charging
electric vehicles. It may range from 30% to 60% of the overall cost depending upon the cost of various
components, viz. cost of equipment, land cost and electricity tariff. If charging stations are charged the
tariff applicable for commercial use (which is generally higher than the average cost of supply in order to
subsidize various categories of consumers and high AT&C losses), it would force them to charge high rates
from consumers. This would make electric vehicles less attractive than ICE vehicles at present scenario, as
the initial cost of electric vehicles is already higher than the ICE vehicles.
1.2.3. Technical Barriers
Charger Standards and Protocols
There is a lack of single agreed charger standard in many countries, which result in lack of inter-operability.
Grid Stability related issues
Normal EV charging behavior will put extra load on the grid at peak hours. Charging profiles on traditional
or ‘unmanaged’ EV charging stations (primarily residential and office premises) typically see peaks in the
mid-day and early-evening periods, which overlap with peak loads on the grid. EV charging during peak
demand hours carries the risks related to management of electricity distribution network. Hence, utilities
are likely to become increasingly concerned with managing of charging activity of electric vehicles, to avoid
any adverse impact on the electricity grid.
Higher EV uptake would need to be supported by strengthening of distribution & sub- transmission network.
However, EVs can have a positive impact on grid stability, if EV charging is done during off-peak hours.
Battery Performance Issues
While Lithium ion batteries are the most suited to this application, there have been concerns about the
safety of the battery in high temperatures and life cycle of the battery.
1.2.4. Informational Barriers
Awareness
There is lack of awareness about electric vehicles, their performance, the incentives and regulations in place
for their use.
Range Anxiety
The range of e-cars is limited by the size of the battery, which is generally lesser than ICE cars. Range
anxiety, is the one of the most significant barriers to the rapid uptake of electric vehicles.
3• Grid stability issues
• Battery performance issues
Informational Barriers
2. Drivers for Electric Vehicles (EV) adoption
• Lack of awareness
• Range anxiety
Globally, following major market drivers are responsible for the transition to electric mobility ecosystem
across developed and developing nations. The studied key variables have been illustrated below:
Reduction in battery prices
Evolving battery technology
Evolving EVSE (Electric Vehicle Supply Equipment) technology
Promotion of renewable energy
Rising crude oil prices
Government Support
Figure 4. Drivers for EV adoption
2.1. Reduction in battery prices
The fairly higher cost of electric vehicles has held the market back from fully competing with conventional
vehicles. The cost of batteries is the primary factor behind EVs’ high sticker price. The battery cost contributes
as high as 45-50% of total medium battery electric vehicle (BEV) cost.
The figure below illustrates cost breakdown of a fully electric vehicle. A Li-ion battery pack costs around
45% of the total cost of a battery operated electric vehicle (BEV)
Electric power steering, 3% Electric AC, 5%
Electrical accessories, 1%
Regenerative breaks, 3%
Body, 3%
Li-ion battery pack, 45
Motor/generator, 20%
Power electronics, 20%
Figure 5. Cost breakdown of BEV
Source: IRENA, PwC analysis
However, in the last few years, battery prices have fallen much rapidly than expected. The battery prices
have dropped around 73-75% since 2010 and so is their contribution in the overall BEV cost. The analysts
forecast prices for lithium-ion battery modules to tumble below $200/kWh by 2019, enabling previously
“uneconomical applications” such as battery storage enabled solar powered EV charging stations to surge.
4The figure below presents BNEF (Bloomberg New Energy Finance) Li-ion battery price survey from 2010
to 2018.
Falling Li-ion b at ter y p rices ( US D/ kW h)
1400
1200
1000
USD/kW
800
h
600
400
200
2010 2011 2012 2013 2014 2015 2016 2017 2018
Year
Figure 6. Falling Li-ion Battery Prices
2.2. Evolving battery technology
As the disruption took place in the Li-ion battery space, electric car market began to accept the newer
technology. Battery OEMs moved from lead acid or Nickel Metal Hydride batteries towards the Li-ion
technology for transportation purposes. The major reason behind the acceptance of Li-ion batteries was the
manifold increase in their overall performance. The figure below presents a concise comparative analysis
among different types of prevalent battery technologies used for powering electric vehicles.
Figure 7. Comparitive Analysis of Different Battery Types
5Initially, Li-ion batteries were considered unsuitable for large-scale storage (required in electric vehicles)
due to their limited capacity and therefore, suffered from having handful of suppliers. Slowly, over the
years, as technology progressed and new Li-ion battery packs started to come in (Li-phosphate and Li-
Nano phosphate batteries), suppliers started to take interest and slow ramp-up of the technology started.
Li-ion also evolved as new market entrants such as NMH and other alternatives started to prosper. Finally,
after 2016, Li-ion batteries were prepared to be used for transportation purposes due to their operational
improvements and commercial affordability. The figure below explains the three stages of Li-ion battery
development throughout the years.
Figure 8. Stages of Li-ion Battery Development
The figure below illustrates how the Li-ion battery energy density increased as years passed.
E ner g y d ensit y ( Wh/ kg )
300
250
200
150
100
50
1990 1995 2000 2005 2010 2015 2020
Figure 9. Li-ion battery energy density
Source: https://www.omicsonline.org/articles-images/advances-automobile-engineering-
Lithium-ion-batteries-6-164-g003.png
62.3. Evolving EVSE (Electric Vehicle Supply Equipment) technology
Today’s technology supports two charging methods: an alternating current (AC) on-board charger (slow and
fast charging) and a direct current (DC) off-board charger (fast charging), as illustrated in the figure below.
Figure 10. Charging Methods for EVs
At home or at work locations, vehicles are typically charged using an AC wall box, which takes about eight
hours. When on the road, people can use public AC charge posts or DC fast chargers, depending on
their needs and the type of electric vehicle. DC fast chargers typically cost more than AC slow chargers,
but charging time per session is considerably lower in case of DC charging as DC chargers produce much
more power. This difference in service capability results in higher overall return on investment from DC
fast chargers. DC fast chargers also ensure efficient use of high-cost parking spaces in urban areas. Hence,
deployment of fast charging network is one of the most critical factors in the faster deployment of electric
vehicles.
Case Study: CHINA fast DC charger deployment
CAUSE
Many stakeholders in China, including the central government, local governments, and utilities, have
been active in quickly building a fast DC charging infrastructure network in the country. In 2017, China
had around 83,000 publicly accessible fast chargers and 130,000 publicly accessible slow chargers.
EFFECT
• Fast charging infrastructure deployment resulted in huge electric vehicle uptake.
• In 2017, China had the largest electric car stock i.e. 40% of the global total, with an auto market share
of 0.2%.
• Electric cars sold in the Chinese market more than doubled the amount delivered in the United
States, the second-largest electric car market globally.
Figure 11. Case Study: CHINA fast DC charger deployment
2.4. Promotion of renewable energy
Globally, energy transition towards renewable energy continues to move forward at a fast pace, owing to
continuously slashing prices, technology enhancements and an increasingly supporting policy environment.
Global renewable energy generation capacity reached 2,356 GW by the end of 2018. This represents
a yearly growth of around 8%, according to new data released by the International Renewable Energy
Agency (IRENA).
Renewable energy generated from hydropower plants comprises slightly lesser than half of the global
renewable generation mix3. Wind and solar account for a majority of the remaining capacity. In fact,
additional renewable energy capacity addition is in the form of wind and solar energy was 84% of new RE
3 IRENA, Renewable Capacity Highlights, 2019
7capacity in 2018. The figure below provides the details of proportion of renewable electricity generation in
global energy mix4, ranging for a period of 15 years from 2001 to 2015.
Global Renewable Energy Consumption
18.2
18
% of total final energy
17.8
17.6
consumption
17.4
17.2
17
16.8
16.6
16.4
16.2
Figure 12. Global Renewable Energy Consumption
The growing renewable energy generation fits perfectly with the e-mobility ecosystem. Electricity used for
powering the batteries can be fueled from renewable based energy to make the transport ecosystem carbon-
free. Promoting renewable energy, thus, would give huge impetus to the electric vehicle deployment.
2.5. Rising crude oil prices
The recent spike in oil prices has given new momentum to global e-vehicles programmes that aim to reduce
oil imports, cut emissions and boost energy security.
Falling Li-ion b at ter y p rices ( US D/ kW h)
1400
1200
1000
800
600
400
Figure 13. Historical Crude oil prices
200
2010 2011 2012 2013 2014 2015 2016 2017 2018
4 World Bank Open Data Year
82.6. Government support
More than 160 countries have declared their Intended Nationally Determined Contributions (INDCs) to
reduce GHG emissions as a part of the preparation for COP21 Paris Climate Conference in December
2015. Transport has been identified as a key sector for reducing emissions by a majority of the nations5.
Additionally, there has been a focus on the vehicles and fuels utilized for transport with a heavy emphasis
on converting to electric vehicles. Additionally, many initiatives such as EV30@30 by the Clean Energy
Ministerial in which countries such as Canada, China, India, Finland and Norway have set an objective to
reach a 30% sales share for EVs by 2030.
Since the introduction of electric vehicles, governments of different countries have taken various steps at
national and local level for promoting electric mobility. The governments have adopted various programs
and are increasingly working for development of electric vehicles and the associated charging infrastructure
through subsidies, grants and public-private partnerships.
Opportunities for Electric Mobility in Small Island Developing States
Small Island Developing States (SIDS) are heavily dependent on fossil fuels for electricity generation
and transport. SIDS are more vulnerable to changes in environment as they are small in size, less
resources and might be easily affected by natural hazards.
SIDS can leverage the benefits of EVs to maintain the ecological balance and reduce costs. A detailed
review of the opportunities that adoption of EVs would have on the state are highlighted below:
Island nations do not have large distances to be covered
• This eliminates the range anxiety of EVs
Reducing pollution
• With almost zero tailpipe emissions, EVs can drastically reduce the GHG emissions from transport
Reduce dependency on fossil fuels
• EVs will reduce the requirement of fossil fuels for transport, thus reducing the import of the same
for the nations
Increasing Renewable Energy
• SIDS have to preserve the ecological balance and thus, EVs with technologies such as V2G and
second life of batteries can reduce.
• SIDS usually have an abundance of Sun and Wind that can be utilized to produce electricity and
the batteries can also work as backup during natural hazards/events.
Megapower, a company in Barbados has effectively managed to increase EVs in region, an eastern
Caribbean island nation. The company provides EVs, charging infrastructure and solar energy to the
region. They have sold more than 200 EVs and 50 charging stations in Barbados. They are integrating
renewable energy into EV network by setting up solar carports which combines solar power with
charging stations. They also sell used EV batteries that can be used for energy storage of renewable
power.
Figure 14. Opportunities for Electric Mobility in Small Island Developing States
5 Transport in Nationally Determined Contributions (NDCs), GIZ
93. Geopolitical implications for Electric Vehicles
(EV) adoption
A rapid transition to EVs would increase the risk of disruption, especially against the current backdrop of
rising trade barriers and resource nationalism. EV adoption is likely to influence geopolitics through several
interrelated mechanisms, including international trade, energy security and competition over strategic
resources. EVs will also have second and third order effects with geopolitical or human security implications,
in large part because of a declining tax base in oil producing countries. In each case, EVs have the potential
to be a catalyst for greater cooperation, or a source of conflict.
3.1. International Trade
• Rise of “Green” Free Trade Agreements: EV costs must fall rapidly if sales are to grow to deliver a
transport sector compliant to targets and mandates set by various countries. Fast growth requires an
expansion of global supply chains, regulatory cohesion and market integration, which could prompt a
rise in “green” free trade agreements.
• Strategic trade tensions: Countries with an automobile manufacturing base will need to accelerate
their transition to electric mobility. In case they are not able to adapt to the new technology, they risk
losing market share and car-making jobs. To protect domestic industries, they raise import tariffs on
EVs, which will affect global trade and take up of EVs.
3.2. Energy Security
• Reduction of revenue in oil states: Electrification could result in reduced public revenues from oil
in producing countries, many of which are in regions already at risk of instability. If oil declines and
batteries rise as geopolitical drivers, the world will look very different.
• Transnational energy infrastructure: China is investing heavily in EVs and the Belt and Road initiative
to reduce its reliance on the US for protection of oil supply chains. It is also a way to bring Chinese EVs
and clean energy to the global market. The EU, China and Japan want to avoid the impact of volatile
oil markets on economic growth. This could all lead to faster phase out of combustion vehicles.
3.3. Access to strategic resources
• Increased competition for Rare-earth elements: The need for cobalt, nickel, lithium and other
minerals could lead to an increased competition for access to them.
• Regional instability: The largest reserves of metals and minerals required for battery production are
found in weak states with poor governance records. Investment in resource extraction can lead to
environmental degradation, civil unrest and instability.
3.4. Economic shocks and financial instability
The estimated oil revenue for the oil industry that will be wiped out by 2040 is USD 19 trillion, by the
adoption of electric cars. Large-scale loss of oil industry revenue would mean lower tax revenues for
governments reliant on the oil industry. Lower oil industry revenues leads to poor returns for institutional
investors including pension funds. This is followed by decline in institutional investment in oil and the
industry less able to raise capital.
104. Analysis of Policy Initiatives in Electric Mobility
The governments of many countries have recognized the benefits provided by electric vehicles and have
implemented policies aimed at transitioning the base of their country’s automobile sector from conventional
fossil fuel to electricity. As the transition to electric mobility involves multiple stakeholders, the policies act
as a guide for them to direct their actions to enable the uptake of electric mobility. The policy initiatives
that have been implemented intend to overcome a range of barriers that are faced in the uptake of electric
mobility such as high initial cost of vehicles, range anxiety, high charging times and consumer awareness.
It is due to these policies that many countries have been able to successfully deploy electric vehicles. This
section aims to discuss the key learnings of the policy initiatives of the governments of a few countries
across the world
4.1. Key Learnings from Electric Mobility Roadmaps
As a first step towards the transition of the automotive sector to electric, many countries establish a national
roadmap or policy to implement e-mobility. A national roadmap is a vision document that defines a set
target and the proposed strategies to support the expansion of the EV market. The roadmap generally has
the following components:
The need for electric The initiatives and
Procurement
mobility in the methodology Barriers to electric
EV Targets programmes for EV
country required for EV and mobility
EVSE deployment and EVSE
Figure 15. Components of e-mobilty roadmaps
A few examples of electric mobility roadmaps are elaborated below:
Title Country Key Features
The National Germany The German Federal Government had laid out electromobility as a major
Electromobility component of the Integrated Energy and Climate Programme (2007).
Development In lieu of achieving the intended targets, the National Electromobility
Plan, 2009 Development Plan was developed in August 2009. The Plan represents
Germany’s approach to electric mobility as a cross sectoral initiative and
involves all relevant industries to draft the plan. The plan envisages that
Germany will become the lead market and provider of electro-mobility
by 2020, and will have 1 million electric vehicles on the road by then.
Proposed measures include financial incentives, R&D, development of
an enabling framework, integration of renewables and standardization
of technology.
2014 Automobile Japan Though Japan has included electric vehicles in their strategic plans
Industry since the 1970s, the Automobile Industry Strategy sets out the latest
Strategy roadmap for achieving electric mobility. The plan includes a target
for ‘next-generation vehicles’ and ‘electric vehicles’ accounting for
passenger vehicle market. It contains the strategy to promote ‘next-
generation’ vehicles and development of research, development and
human resources.
11Zero-Emission California, The then Governer of California, Edmund G. Brown Jr. signed an
Vehicle USA executive order, commanding all state entities to work with private
Executive Order, sector and all appropriate levels of government to put at least 5 ZEVs
2018 on on California roads by 2030 and 200 hydrogen fueling stations and
250,000 zero-emission vehicle chargers, including 10,000 direct current
fast chargers, by 2025
National Lao PDR The vision of EST Strategy is to “manage and promote the land
Environment transport to be convenient, connected, safe, modern, barrier free,
Strategy 2020 sustainable and environment friendly.” The first goal of the action
and Action Plan plan is the promotion of goods and passenger transportation using
electricity, domestic potential energies and low-emission energies.
Table 1. Electric Mobility Roadmaps
Set a well-defined Electric Mobility roadmap
As per International Energy Association, the policy pathway for sustainable transport begins with the
planning stage that results in the development of the policy framework and action plan. The steps included
in the planning stage are defined below:
Identify and address
Understand the current
Involve key stakeholders challenges to achieving Develop policy
transport ecosystem,
at all stages of the objectives. Secure framework and action
decide the desired
process to foster necessary resources for plan (including key
outcome, and define
partnerships and address achieving the objectives
objectives to transition steps, responsibilities
their concerns across technical, financial
from current to future and milestones)
and institutional sectors
situation
Figure 16. Planning Process for Policy Framework
Japan has been successful in implementing electric mobility roadmaps. The country had envisaged the
need for electric mobility as early as 1976, when the Ministry of International Trade and Industry, Japan
(MITI) established a basic market expansion plan for battery powered electric vehicles6. The plan was
comprehensive and co-ordinated government The
The need for electric departments, municipalities and companies in their efforts to
initiatives and
achieve electric
mobility in the mobility. The plan was regularly reviewed
methodology and updated according
Barriers to the marketProcurement
to electric environment.
EV Targets programmes for EV
The plan had a clear vision and strategy for all
country required for EV and
the stakeholders. The release
mobilityof the plan was followed by
EVSE and EVSE
swift action by the stakeholders, which resulted indeployment
the achievement of the set targets. For example, the
government agencies initiated programmes to fund R&D of new technologies for 10 years over different
phases, the Japanese Electric Vehicle Association (JEVA) initiated leasing programmes and OEMs initiated
the development of HEVs and EVs.
In 2016, Japan’s electric car charging points crossed the number of petrol stations in the
country7. Japan has also been the home of the hybrid car Toyota Prius and the first mass
produced EV, Nissan Leaf which has sold 360,0008 units around the world since 2014. In 2018,
Japan had sold a total of 49,750 BEV and PHEV cars of which approximately half were BEV.
California is leading the change to electric vehicles in the USA due to the actions of the local government.
The local government has been aggressively targeting electric vehicle conversion in the state, which has led
to the proliferation of EVs in the region.
On the other hand Germany has not been able to successfully implement its electric mobility policy. The
German Federal Government had laid out electromobility as a major component of the Integrated Energy
and Climate Programme (2007). In lieu of achieving the intended targets, the National Electromobility
6 Government policy and the development of electric vehicles in Japan, Max Ahman, 2004
7 https://www.theguardian.com/world/2016/may/10/japan-electric-car-charge-points-petrol-stations
8 Centre for Solar Energy and Hydrogen Research Baden-Württemberg
12You can also read