Distributed Energy Resources Roadmap - December 2019 - Government of ...
←
→
Page content transcription
If your browser does not render page correctly, please read the page content below
Distributed Energy
Resources Roadmap
December 2019
The energy industry
is undergoing a rapid
transformation.

An appropriate citation for this paper is: DER Roadmap
Energy Transformation Taskforce
David Malcolm Justice Centre
28 Barrack Street
Perth WA 6000
Locked Bag 11 Cloisters Square WA 6850
Main Switchboard: 08 6551 4600
www.energy.wa.gov.au
Enquiries about this report should be directed to:
Jai Thomas

Energy Transformation Taskforce
On 20 May 2019, the Hon Bill Johnston MLA, Minister for Energy established the Energy Transformation
Taskforce to deliver the Western Australian Government’s Energy Transformation Strategy.
The Taskforce reports directly to the Minister for Energy and comprises five members, including
an Independent Chair and four senior State Government officials:
• Mr Stephen Edwell – Independent Chair
• Mr Michael Court – Deputy Under Treasurer, Department of Treasury
• Ms Kate Ryan – Executive Director, Energy Policy WA
• Mr Brett Sadler – Director, Department of the Premier and Cabinet
• Ms Katharine McKenzie - Principal Policy Adviser to the Hon Bill Johnston MLA, Minister for Energy

                                                                      D I S T R I B U T E D E N E R GY R E S O U R C E S R OA D M A P
Contents
      Chair’s foreword                                            4

      Executive summary                                           6

      Introduction                                                12

      1. The clear and present challenge                         16

      2. T
          he future of electricity in the SWIS                   38

      3. The DER Roadmap                                          50

      Glossary                                                    76

D I S T R I B U T E D E N E R GY R E S O U R C E S R OA D M A P        1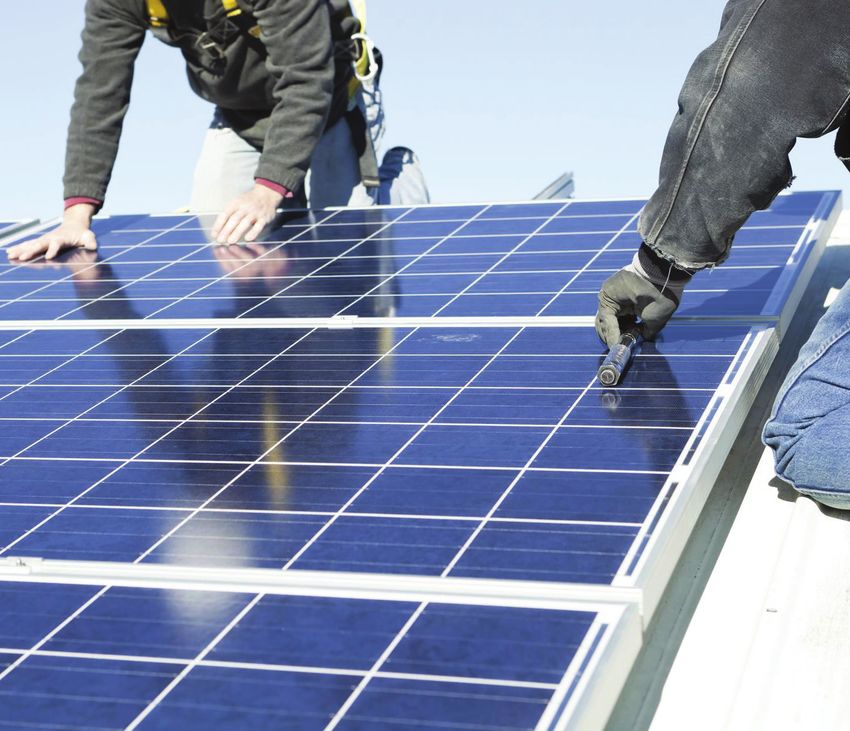
A bbre v iations

    Abbreviations
    The following table provides a list of abbreviations and acronyms used throughout this document.
    (A glossary is provided at the end of the document.)

      TERM                         DEFINITION

     AEMO                         Australian Energy Market Operator

     AMI                          Advanced Metering Infrastructure

     DER                          Distributed Energy Resources

     DMO                          Distribution Market Operator

     DSO                          Distribution System Operator

     EPWA                         Energy Policy WA

     ESS                          Essential System Services

     EV                           Electric Vehicle

     kW                           Kilowatt

     kWh                          Kilowatt hour

     MW                           Megawatt

     MWh                          Megawatt hour

     PV                           Photovoltaic

     RCM                          Reserve Capacity Mechanism

     REBS                         Renewable Energy Buyback Scheme

     SRES                         Small-scale Renewable Energy Scheme

     SWIS                         South West Interconnected System

     UFLS                         Under Frequency Load Shedding

     VPP                          Virtual Power Plant

     WEM                          Wholesale Electricity Market

2                                                                               D I S T R I B U T E D E N E R GY R E S O U R C E S R OA D M A P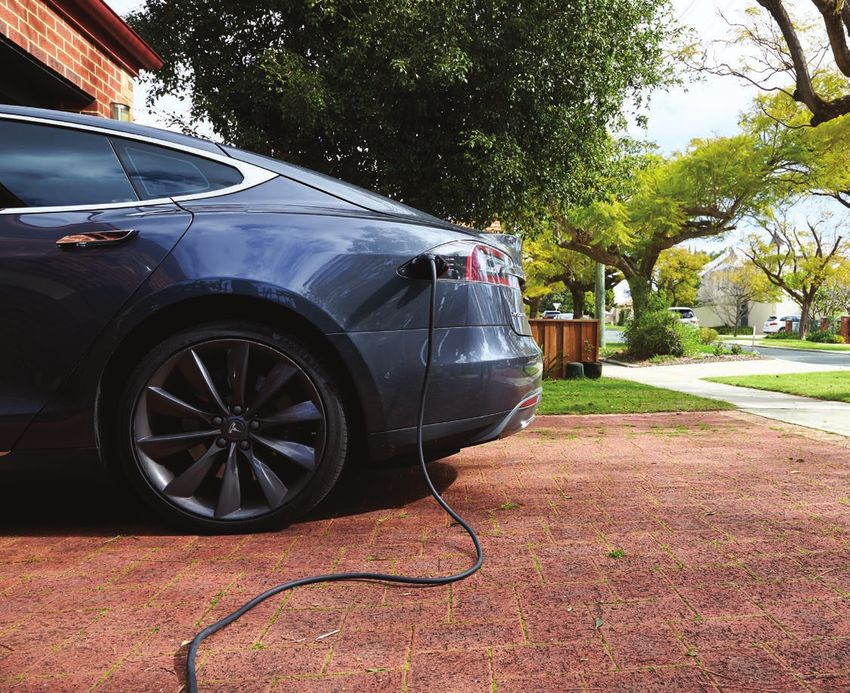
D I S T R I B U T E D E N E R GY R E S O U R C E S R OA D M A P 3
Chair’s foreword

    The rapid advance in renewable                              In short, this is because power systems weren’t
                                                                designed for high levels of intermittency and two-way
    energy technology is fundamentally                          flow of power. In the SWIS, where nearly one in three
    changing the dynamics of power                              households have installed rooftop solar PV, there is

    systems across the globe.                                   already a clear and present risk to power security.

                                                                The big picture dynamic of the SWIS is that we are
    Here in Western Australia the penetration of renewable
                                                                moving rapidly from a power system dominated by
    energy resources in both the South West Interconnected
                                                                upstream large scale, synchronous, thermal generation,
    System (SWIS) and our regional electricity systems has
                                                                centrally controlled and distanced from load, to one
    occurred with unprecedented swiftness.
                                                                with more intermittent generation and an increasingly
    This technology revolution in renewable energy              decentralised supply chain comprising a variety of
    presents an amazing opportunity for Western Australia       downstream distributed energy resources (DER). In this
    given its world class wind and solar resources. With free   new paradigm the distribution network will take centre
    fuel and low operation costs renewable generation will,     stage. The Western Australian Government wisely
    over time, put downward pressure on electricity prices      recognises this transition needs a plan and some very
    and deliver cleaner energy. It is a no-brainer that we      careful management.
    should be seeking to optimise the level of renewable
                                                                In May 2019, the Minister for Energy, Bill Johnston,
    energy across our electricity systems.
                                                                announced an Energy Transformation Strategy and
    However, achieving high levels of renewable generation      established an Energy Transformation Taskforce to
    presents some immediate challenges. In fact, without        implement it. The Taskforce has until May 2021 to
    significantly modifying the way our electricity systems     complete its mission.
    operate, higher levels of renewable participation
    present risks to power system security and reliability.

4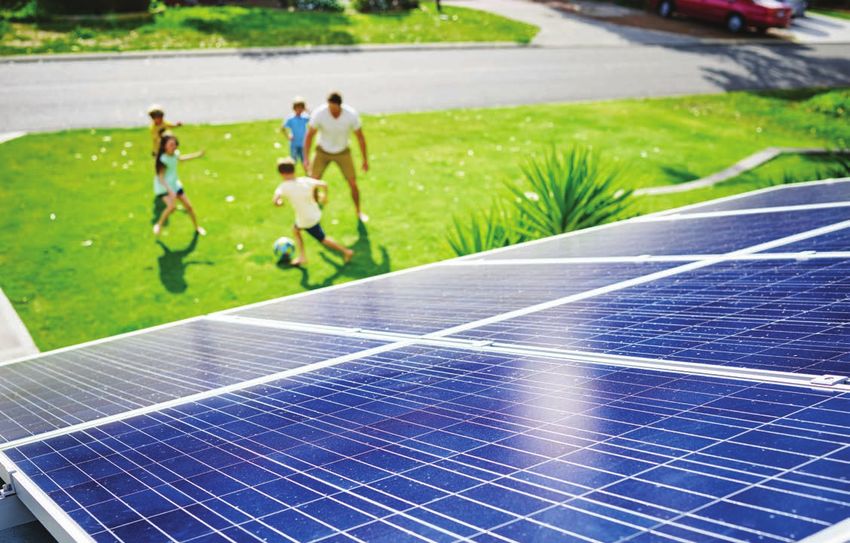
Delivery of the Strategy involves three work streams.       The strong view of the Taskforce is that the Roadmap is
We need to:                                                 not a menu of possible initiatives. Rather, all 36 actions
• develop a Roadmap for a transition to a                   are necessary to achieve a complete and successful
   decentralised, democratised, and highly data driven      transition to a DER future.
   power system – the DER Roadmap,
                                                            I would particularly like to acknowledge the exceptional
• undertake comprehensive long-term modelling of
                                                            commitment and skill of Jai Thomas and team in the
   the power system to assist Government policy and
                                                            Electricity Transformation Implementation Unit in
   sector wide investment decisions, and
                                                            developing the Roadmap in only seven months.
• make major modifications to the design and
   operation of the SWIS.                                   I also acknowledge electricity market participants for
                                                            their input across two public workshops and many one-
The reliability and security of the power system is         on-one sessions, and especially the major contribution
central to all this work.                                   made by people in Western Power and AEMO. Both

The DER Roadmap is the Taskforce’s first major              Agencies will continue to have a significant involvement

deliverable. We have adopted a structured approach          in implementation.

to the Roadmap’s development. The Roadmap provides          I would also like to thank my Taskforce colleagues for
our analysis of the challenge, our vision for the SWIS in   their diligence and very valuable strategic oversight
2025 and our proposals for transformative response.         of this project during what has been an intense period

Overall, what needs to happen is for DER to be fully        of work.

integrated into the power system. Importantly, if DER       We are all looking forward to implementing the
is to become a central player it needs to be subjected      Roadmap and delivering on the other elements of the
to similar discipline as traditional generation and         Energy Transformation Strategy in 2020 and beyond.
contribute to, rather than detract from, the security of
the overall power system, whilst still providing a return
to DER owners.

The suite of actions we propose is broad – covering
technology integration, removing barriers to DER            Stephen Edwell,
participation (including battery storage), piloting         Independent Chair,
alternative electricity tariffs, and customer protection    Energy Transformation Taskforce
and engagement.

Urgency has necessitated the Roadmap be output
oriented. We have identified 36 individual required
actions. We have also developed a detailed and
prioritised implementation plan for delivery of these
actions – highly focussed on the next two years.

                                                                                                                         5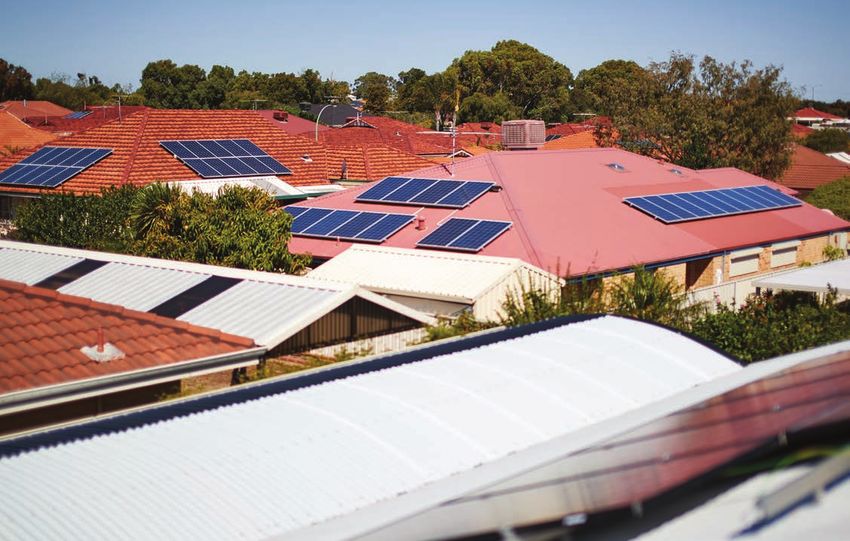
Executive summary
Distributed Energy Resources (DER) DER also offer additional opportunities that
complement and amplify the benefits of customer
are transforming our electricity investments. These opportunities include services that
system, presenting both challenges help ensure the security and reliability of the power
and opportunities. system, and innovative business models that offer new
value for customers.
Distributed Energy Resources, or ‘DER’, are smaller–
scale devices that can either use, generate or store But it’s causing problems that need to
electricity, and form a part of the local distribution be solved
system, serving homes and businesses. However, the speed and scale of the uptake of DER
is presenting serious risks to the power system.
DER can include renewable generation such as rooftop
solar photovoltaic (PV) systems, energy storage, electric If not properly managed, high levels of DER, most notably
vehicles (EVs), and technology to manage demand rooftop solar PV, will impact customers by eroding the
at a premises. security and reliability of the electricity system, higher
costs, and an emerging divide between those that can
DER is a great opportunity afford to install DER and those that cannot.
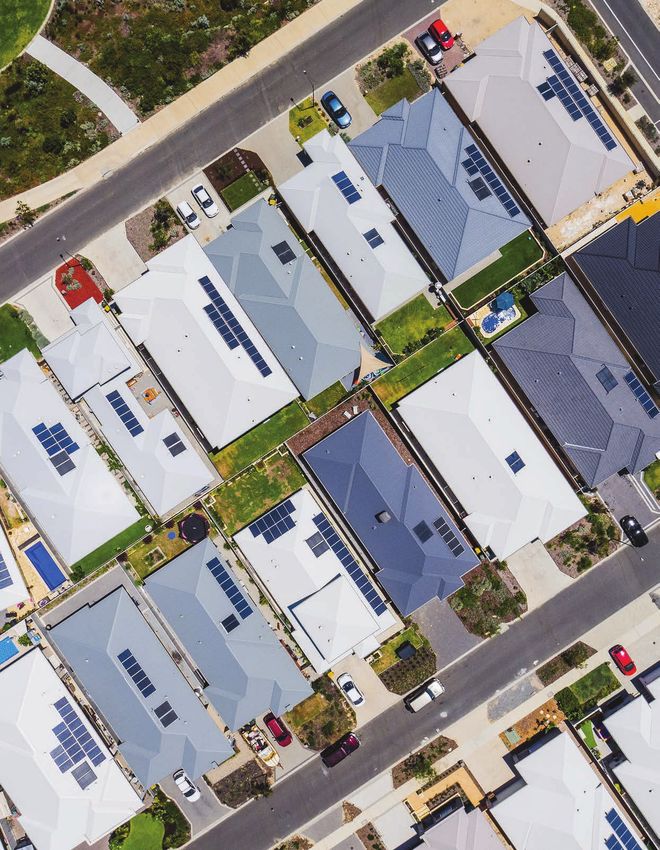
Customers in the South West Interconnected System
The continued uptake of rooftop solar PV will see
(SWIS) are installing DER at unprecedented rates. Now,
daytime demand fall to levels at which there is
almost one in three households in the SWIS have a
significant risk that the stability of the SWIS will be
rooftop solar PV system installed, with around 2,000
compromised – this is forecast to occur around 2022.1
households adding a new system each month.
In response, the the Australian Energy Market Operator
Customers choosing to install DER are already (AEMO) will be required to intervene more frequently
enjoying the benefits of lower electricity bills, and are and to a greater extent to maintain system security,
contributing to de-carbonising the power system. increasing costs for customers.
As DER capabilities improve and technology costs
continue to fall, customers will be able to enjoy new and
greater benefits from their DER.
1 AEMO, March 2019, Integrating Utility-scale Renewables and Distributed Energy Resources in the SWIS, available at https://
www.aemo.com.au/-/media/Files/Electricity/WEM/Security_and_Reliability/2019/Integrating-Utility-scale-Renewables-and-
DER-in-the-SWIS.pdf
6 D I S T R I B U T E D E N E R GY R E S O U R C E S R OA D M A P
E x ecuti v e S ummary

      DER is also contributing to technical issues at the                As well as low demand in the middle of the day causing
      distribution network level. The existing network was not           system security issues, the system load profile also
      designed to handle large amounts of generation from                features high peak demand and associated costs to
      rooftop solar PV, which is now flowing two ways and                service that peak. Existing flat electricity tariff structures
      causing problems for network operation as the physical             are increasingly unsuitable because they do not reflect
      limits of infrastructure are reached. Without improving            the true cost of electricity supply, particularly as more
      DER integration in the network, resolution will require            DER is installed. There are minimal incentives under
      costly infrastructure investment by Western Power, or              these existing tariff structures for customers to use
      imposition of limits on the size and number of rooftop             their energy in a way that helps keep supply costs at a
      solar PV systems customers can install on the network.             minimum and ensures the system is stable and secure.
      Neither outcome is good for customers.
                                                                         Further, customers who install DER contribute less than
      If DER is to become a central component of the power               their share of system costs and are disproportionately
      system, it needs to be fully integrated into the operation         benefiting from lower bills. This means customers
      of the power system and actively provide support, in a             who are unable to access DER are cross-subsidising
      manner similar to larger generators.                               those who can. In short, the current tariff structures are
                                                                         incompatible with a high-DER energy system.

                                                          Further, customers who install DER contribute
                                                          less than their share of system costs and are
                                                          disproportionately benefiting from lower bills.

D I S T R I B U T E D E N E R GY R E S O U R C E S R OA D M A P                                                                           7
E x ecuti v e S ummary

    The Taskforce has a vision to solve these                   2. Pilot tariff structures that support the high-DER
    problems now and set the system up for the                     future.
    high-DER future                                             Current electricity tariffs are contributing to inefficient
    Addressing these challenges through integration and         and inequitable outcomes for customers, and the power
    orchestration of DER involves measures to manage the        system. A high-DER future is not sustainable under
    risks and realise new opportunities across the entire       current tariff structures.
    electricity supply chain.
                                                                It is important to pilot potential new tariff structures
    The Energy Transformation Taskforce’s vision for DER        that are more sustainable, reflecting the underlying
    by 2025 is:                                                 cost of energy services and incentivising efficient use

    A future where DER is integral to a safe, reliable          of the system. That is, pilots for tariff structures that

    and efficient electricity system, and where the full        incorporate time-based price signals with low rates

    capabilities of DER can provide benefits and value          during the day when there is excess rooftop solar

    to all customers.                                           generation, while signalling for peak demand and the
                                                                associated costs to support the peak.
    There are three parts to this vision:
                                                                This will provide insights into how customers respond to
    1. A safe and reliable electricity system where
                                                                alternative tariff structures, including how they use and
       customers can continue to connect DER and where
                                                                invest in DER (e.g. battery storage) under those tariffs.
       DER supports the system in an efficient way.
    2. DER capability can offer value throughout the            3. Ensure customers are protected and are provided
       electricity supply chain.                                   with clear and simple information.
    3. DER benefits are flowing to all customers, both          Customers can continue to install DER, and access
       with and without DER.                                    information that helps them make choices about how
                                                                they use electricity and better manage their costs.
    The DER Roadmap is how to get there
                                                                The protection of customers, including data protections,
    The DER Roadmap is the set of actions, action owners        will be maintained even as changing business models
    and timeframes required to realise this vision. The         provide new electricity services and customer offerings.
    Roadmap outlines the way to achieving key milestones
    on the journey, and will:                                   4. Build a future where DER is an active participant in
                                                                   the power system.
    1. Address the imminent danger of system stability
       issues occurring as soon as 2022.                        The Roadmap sets out the requirements for the
    Upgrades to DER functions and settings (like those          integration of DER into electricity markets, so that
    for inverters) will see DER automatically help mitigate     customers may eventually provide services that support
    network and system disturbances, rather than                the system and are rewarded for doing so. This will
    exacerbate them.                                            lead to the natural evolution of Western Power and
                                                                AEMO’s roles and the introduction of innovative ‘DER
    Grid support measures by Western Power will assist in       aggregators’ to the system.
    maintaining system security and reliability, particularly
    in the short term. Improved visibility of DER for Western   The coordination of many individual customer DER by
    Power and AEMO will further support this.                   aggregators will allow customers to participate in the
                                                                provision of services that benefit the power system,
    Distribution battery storage deployment, provided by        but in a simple way. The development of mechanisms
    a range of parties, will provide a cost-effective way to    that allow DER to provide these services and receive
    manage network and system issues caused by DER, and         payment will open up new value streams for customers,
    offer customers new opportunities to access storage.        and lower system costs.

8                                                                                  D I S T R I B U T E D E N E R GY R E S O U R C E S R OA D M A P
E x ecuti v e S ummary
A future where DER
is integral to a safe,
reliable and efficient
electricity system,
and where the full
capabilities of DER
can provide benefits
and value to all
customers.
D I S T R I B U T E D E N E R GY R E S O U R C E S R OA D M A P 9E x ecuti v e S ummary
The DER Roadmap
2020
Distribution Storage Distribution Inverter Settings & Functionality
Western Power PowerBank installations Network Visibility SWIS-specific autonomous inverter
commence, providing opportunities for Distribution network visibility program settings that provide better performance
network and customer benefit whilst commences to enhance the during disturbance events are enabled
adding to power system stability understanding of distribution network
power flows and constraints
DSO/DMO Grid Response Tariff Pilots
DSO/DMO roles, functions, practical Investment in grid support technologies Pilots for alternative tariff structures have
operations, regulatory requirements, (including reactors, storage and voltage commenced, demonstrating value to
as well as costs and benefits have been control equipment) by Western Power is consumers who can move electricity use
identified contributing to maintaining system to the middle of the day
stability on low demand days
2021
Distribution Storage System Operations Tariff Pilots
Western Power has identified emerging The System Operator’s dynamic system Learnings from tariff pilots are guiding the
network needs and has access to network modelling adequately incorporates DER transition to new pricing, driving
storage services from the market and arrangements adequately address system-efficient behaviours and
power flows during system events investment in storage that have the
potential to lower energy bills
DER Roadmap Complete
• DER is being leveraged for value across
the supply chain, including to secure the
network, and providing value to 2024
customers;
• Innovative business models with
appropriate licensing are providing
value to customers and the system as a Distribution Storage
whole; and Distribution storage continues to be
• The DSO and DMO are coordinating deployed under a variety of business
effectively to ensure customers can models, and can access value across the
continue to connect their DER into the supply chain
future
Figure A: the DER Roadmap workplan and priority actions
Figure A: the DER Roadmap workplan and priority actions
10 D I S T R I B U T E D E N E R GY R E S O U R C E S R OA D M A PE x ecuti v e S ummary
The Energy Transformation Taskforce’s DER Roadmap provides an integrated
set of actions designed to deliver a future where DER contributes to a safe,
reliable and efficient system where all customers can enjoy the benefits of DER.
Customer Engagement
Customer engagement program
commences on challenges and Technology Tariffs and DER Customer Protection
opportunities of the high-DER future Integration Investment Signals Participation and Engagement
Inverter Tariff Pilots Network Data
Standards Investment Process
Distribution DER for Tenants DER Orchestration New Business
Battery Storage Pilot Models
Grid Response DSO/DMO Customer
Function Set Engagement
Power System
Operations
DER Orchestration Pilot Distribution
A comprehensive VPP technology and Network Visibility
market participation pilot has
commenced, testing the incorporation of Planning for
aggregated DER into the WEM EV Integration
2022
DSO/DMO Customer Engagement Network Investment Process
Changes to wholesale market Customer engagement program An amended Access Code is providing
arrangements necessary to enable the continues increased opportunities for DER
participation of DER in the WEM via a innovators to provide services to Western
DER aggregator are introduced Power and receive revenue for doing so
2023
DSO/DMO DER Orchestration Pilot Inverter Settings & Functionality
DSO and DMO goes live in A comprehensive VPP technology and Communications-linked inverter
the SWIS, with DER able to respond to market participation pilot has tested the standards are enabled, providing for DER
meet network needs as well as be incorporation of aggregated DER into the orchestration and the capability to
dispatched into the WEM, WEM (including market dispatch and participate in multiple markets
and be compensated appropriately settlement arrangements)
D I S T R I B U T E D E N E R GY R E S O U R C E S R OA D M A P 11Introduction
Our energy system is changing. To alleviate this system stability risk and capture the
significant benefits of higher levels of DER, changes
Increasing levels of renewable are required across the electricity supply chain.
generation, much of it located on These changes range from increasing the minimum
homes and businesses, produces performance standards of equipment that customers
connect to the network, to the way electricity and
electricity that fluctuates depending system support services are priced.
on the time of day and the weather.
Specifically, reforms are needed to integrate DER into
New technologies to store energy and manage the power system in a way that allows the benefits of
energy usage are emerging, and the costs of these this technology to be fully captured while minimising the
technologies are falling. The electricity system is risks. These arrangements must also be equitable and
transforming from one built around big centralised share benefits to all customers, irrespective of whether
generators to one where thousands of individual the customer owns DER or not.
generators line the rooftops and garages of modern
The Energy Transformation Taskforce has developed
Australian homes and businesses (Figure 1).
this DER Roadmap of actions to meet the following
Distributed Energy Resources are transforming our objectives:
electricity system, creating an exciting opportunity to • allow customers to continue to utilise DER to manage
leverage customer investment to reduce electricity costs their own energy bills;
and lower emissions from the energy sector. • enable all electricity customers to share in the
benefits from higher levels of DER; and
However, if not properly managed, DER can also
• integrate increasing volumes of DER into the
present a risk to power system security and network
SWIS without adversely affecting the security of
reliability, leading to extra costs and potential disruption
the power system.
for customers. Self-supply from rooftop solar PV
systems and the export of excess power back to the grid
is reducing daytime grid-served demand to very low
levels. In only a few years from now, continued uptake
of rooftop solar in the SWIS will see daytime demand
fall to levels which significantly threaten the stability of
the power system. According to the Australian Energy
Market Operator’s (AEMO) forecasts, this could occur
as early as 2022.2
2 AEMO, March 2019, Integrating Utility-scale Renewables and Distributed Energy Resources in the SWIS, available at https://
www.aemo.com.au/-/media/Files/Electricity/WEM/Security_and_Reliability/2019/Integrating-Utility-scale-Renewables-and-
DER-in-the-SWIS.pdf
12 D I S T R I B U T E D E N E R GY R E S O U R C E S R OA D M A PI ntroduction
Traditional electricity supply chain
Generation Transmission Distribution Customers
Network Network
New electricity supply chain
Transmission
Network
Generation Renewable
Generation
Distribution
Network
Sub Station
Customers
Network
Small Scale Storage Storage
Customers
Micro-grids
Stand-alone Distribution Network
Power System Renewables
Figure 1 – The electricity system transformation
Figure 1 – The electricity system transformation
D I S T R I B U T E D E N E R GY R E S O U R C E S R OA D M A P 13I ntroduction
WESTERN AUSTRALIA
The customer make-up of the SWIS
CONNECTION METRO COUNTRY TOTAL
Residential 854,504 191,432 1,045,936
Agricultural 668 4,778 5,446
Commercial 69,846 27,649 97,495
Industrial 904 412 1,316
Total 925,922 224,271 1,150,193
Kalbarri
Kalgoorlie
I ND I AN Perth
O C E AN
SWIS
South West
Interconnected System
Bremer Bay
S O U T HE R N
OCEAN
14 D I S T R I B U T E D E N E R GY R E S O U R C E S R OA D M A PI ntroduction
The purpose of this Roadmap is to identify an integrated These include:
set of actions for implementation from 2020 through to • developing a Whole of System Plan – modelling
2024 to achieve these three objectives. The proposed long term scenarios to identify the best options for
actions will enable the benefits of DER to be maximised investment in the power system, to maintain security
while positioning the SWIS for resilience into the future and reliability at the lowest sustainable cost; and
as the generation mix and the pattern of electricity • modernising the design and operation of the power
consumption changes. system4 – which has two core components:
How DER is integrated to capture the benefits it can – improving access to the SWIS – delivering
provide to the system will play a key role in delivering network access arrangements that make the best
the WA Government’s Energy Transformation Strategy. use of available transmission capacity and the
Effective DER integration will help to manage the existing investment in the network; and
transition towards cleaner energy and improve market – enhancing market design for the SWIS –
efficiency. 3 delivering a future power system to ensure
that electricity is dispatched at the lowest
This Roadmap will complement other activities being sustainable cost.
implemented under the Energy Transformation Strategy.
3 Energy Transformation Taskforce, October 2019, Program Implementation Plan, available at https://www.wa.gov.au/sites/
default/files/2019-10/ETS%20Program%20Implementation%20Plan%20Oct%2019_0.pdf
4 This is referred to as the “Foundation Regulatory Frameworks” workstream of the Energy Transformation Strategy
D I S T R I B U T E D E N E R GY R E S O U R C E S R OA D M A P 151. T
he clear and
present challenge
This Chapter of the DER Roadmap DER can include renewable generation, energy storage,
electric vehicles (EVs), and technology that consumers can
considers the uptake of DER use at their premises to manage their electricity demand
by consumers and the current (e.g. hot water systems, pool pumps or smart appliances).
trajectory for installation in the SWIS. DER can be located within a customer’s premises or
connected directly to the distribution network.
It outlines how increasing levels of
DER on a consumer’s side of the meter are known
DER impact the wider power system,
as ‘behind the meter’ and operate for the purpose of
and the immediate challenges and supplying all or a portion of the consumer’s electricity.
risks it presents. The behind the meter DER may also be capable of
supplying power into the system or providing a demand
Chapter 1 also explains the role of the DER Roadmap management service.
in meeting this clear and present challenge, and the
DER that are connected directly to the distribution
guiding principles that have been used to identify
network, or ‘in front of the meter’, can include some
changes to current arrangements.
types of renewable generation (e.g. small solar PV and
wind farms), and grid-scale batteries (e.g. community
1.1 What is DER?
batteries).
This section explains the technologies and services
captured by Distributed Energy Resources and the
current state of uptake in the SWIS.
DER cover a wide range of new technologies and
services that can deliver value across different parts of
the electricity supply chain (Figure 2). In this Roadmap,
we have adopted the following definition:
Distributed Energy Resources, or
‘DER’, are smaller–scale devices
that can either use, generate or
store electricity, and form a part
of the local distribution system,
serving homes and businesses.
16 D I S T R I B U T E D E N E R GY R E S O U R C E S R OA D M A P1. T h e c l ear and present c h a l l enge
Customers’ Distributed Energy
PV Batteries EVs
Commercial
Demand Smart
VPPs
Response Homes
Residential
Heating Pumping Cooling
Behind the meter
In front of the meter
Figure 2 – Illustration of DER located within an electricity network
DER can be ‘active’ or ‘passive’. Active DER adapts While DER is often referred to in terms of specific
its behaviour in response to control signals from an technology types (such as rooftop solar PV or batteries),
external party or system, whereas passive DER simply it is important to consider DER in terms of the potential
responds to available resources (such as rooftop range of services it can provide across the supply chain.
solar PV generation responding to sunlight) or pre-set Where DER can provide services, they can add value.
internal programming and settings. Typically, the DER Understanding what services DER can provide will help
installed in Western Australia to date is passive. The DER unlock the potential value of DER across the power
Roadmap evaluates both active and passive forms to system, facilitating higher levels of DER penetration and
ensure the system can manage the impacts. encouraging new business models to emerge.
D I S T R I B U T E D E N E R GY R E S O U R C E S R OA D M A P 171. T h e c l ear and present c h a l l enge
Generators, Retailers
Customer Network System
& New Business
Avoided Network reliability Essential System Risk management
energy costs services Services
Retailer buyback Network capacity Reserve Capacity Opportunities for
payments and support innovation and new
product offerings
Reduced carbon Wholesale Energy
footprint
Figure 3 – Potential DER benefits and services
An essential element of this Roadmap is that the greater These DER services will be provided for defined periods
the contribution of DER to the SWIS energy supply of time across certain days, or under certain market
increases, the greater the need to move newly-installed conditions to different types of buyers and sellers
DER from passive operation towards active operation. (Table 1). DER services would be delivered through the
Active DER offers an array of benefits and services that existing competitive market (the Wholesale Electricity
can support the system, reduce electricity costs to the Market (WEM)), provided directly to those who need it
consumer, and maintain reliability of electricity supply via bilateral contracts, or be delivered using new market
(Figure 3). arrangements where required. Because all markets
cannot be participated in concurrently, a key challenge
will be to optimise the services DER can provide across
the supply chain.
18 D I S T R I B U T E D E N E R GY R E S O U R C E S R OA D M A P1. T h e c l ear and present c h a l l enge
Table 1: Potential DER services
POTENTIAL DESCRIPTION SPECIFIC SERVICES DER CAN PROVIDE
DER SERVICE
Network reliability Some DER can provide network support services, • Autonomous inverter responses create more
including reliability, that can help Western Power resilient distribution networks.
supply customers when main grid supply is lost. • Operate in island mode to maintain
continuity of supply when network supply is
disrupted.
Network capacity DER provide distribution-level capacity value by • Supply active power during evening peak
and support deferring or avoiding investment in network assets. to reduce power transfer through network
This value depends on the location and utilisation elements (particularly when thermal limits
capability of DER during local peak periods. are breached).
• Absorb (over-voltages) or supply (under-
voltages) reactive power to maintain voltage
profiles.
Essential System DER may provide flexibility value to AEMO across a • Upwards/downwards contingency reserve.
Services (ESS) range of ESS. Subject to successful pilots, DER may • Frequency regulation up/down.
provide services including contingency, frequency
and voltage regulation and location-specific
services.
Reserve capacity DER could be used as an alternative supply of • Demand reduction.
capacity into the Reserve Capacity Mechanism. • Generation capacity.
The value of the capacity would be assessed from
the generation or demand response capability of
the DER during system peak periods.
Wholesale energy DER provide energy value when it displaces the • Wholesale energy generation.
need to produce energy from another generating • Avoided losses on the transmission and
resource. distribution system, due to the proximity of
DER to end-use loads.
Risk management In certain instances, purchases of energy from DER • Generator support.
may be used to hedge against pool price exposure • Energy arbitrage services.
and/or broader portfolio management.
The DER Roadmap aims to facilitate the integration of It is also recognised that if DER are to displace
all forms of DER, including those to be developed in traditional synchronous generation, they must
future, allowing consumer investments in DER to attract contribute to the physical demands of the electricity
returns from the provision of services that will ultimately system. DER need to become active (rather than
enable lower costs for all consumers. The integration of passive) , integrated into the operation of the power
DER across the supply chain will enable the true value of system, and subject to remote management and
the services being provided by DER to be accounted for. operating standards in order to keep the power system
stable. Power systems need to operate within defined
tolerances for frequency and voltage and require
certain services to provide system support for it to
operate securely.
D I S T R I B U T E D E N E R GY R E S O U R C E S R OA D M A P 191. T h e c l ear and present c h a l l enge
1.1.1 Current DER uptake in the SWIS
Western Australians are among the leaders nationally in their take-up of DER, most notably rooftop solar PV
(Figure 4). This sub-section provides an overview of how this DER uptake is progressing and its expected trajectory
over the coming years.
WA
Estimated percentage of
dwellings with PV installations: 28.8%
40%
35%
30%
25%
20%
15%
10%
5%
0%
QLD SA WA NSW NT VIC ACT TAS
Figure 4: Percentage of dwellings with a solar PV system by Australian jurisdiction5
Rooftop solar PV
Of all the DER technologies, rooftop solar PV is the one that has the greatest impact on the power system in Western
Australia today. Almost one in three households in the SWIS now have a rooftop solar PV system.6 Cumulatively, this
amounts to over a billion dollars of customer investment in electricity generation over the last decade.7 Around 2,000
households are adding rooftop solar PV every month. This growth is expected to continue, with the CSIRO and AEMO
forecasting uptake by residential customers will reach 50% in the next ten years.
5 APVI, 2018, Solar Trends Report for Solar Citizens, available at http://apvi.org.au/wp-content/uploads/2018/12/Solar-Trends-
Report-for-Solar-Citizens-FINAL_11-12-18_2_logos.pdf
6 Ibid.
7 This is a high-level conservative estimate based on an average price over the 10 years of $5,000 per system multiplied by
250,000 installed systems. The actual value may be significantly higher than this.
20 D I S T R I B U T E D E N E R GY R E S O U R C E S R OA D M A P1. T h e c l ear and present c h a l l enge
1,400 25
1,200
Monthly installation rate (MW/month)
20
1,000
Installed capacity (MW)
15
800
600
10
400
5
200
0 0
1/12/2006
1/05/2007
1/10/2007
1/03/2008
1/08/2008
1/01/2009
1/06/2009
1/11/2009
1/04/2010
1/09/2010
1/02/2011
1/07/2011
1/12/2011
1/05/2012
1/10/2012
1/03/2013
1/08/2013
1/01/2014
1/06/2014
1/11/2014
1/04/2015
1/09/2015
1/02/2016
1/07/2016
1/12/2016
1/05/2017
1/10/2017
1/03/2018
1/08/2018
1/01/2019
1/06/2019
Rooftop solar Synergy installed coal generation capacity
Monthly installation rate (Mw)
Figure 5: Cumulative installed inverter capacity in the SWIS8
With over 1,100 MW presently installed (Figure 5), rooftop The current regulated tariff structure for residential
solar PV represents the largest energy source in the households tends to encourage self-consumption.
SWIS. This is the equivalent of an output capacity three The current A1 flat tariff structure (which applies to almost
times the size of the largest dispatchable generator, all households) combined with the Renewable Energy
the 340 MW Collie Power Station, and this amount Buyback Scheme means the best value for energy
is increasing each month.9 Solar PV’s contribution to generated by rooftop solar PV systems comes from self-
daytime electricity production is similarly increasing, and consumption, using these behind the meter generators
it recently fulfilled 45% of underlying energy demand for to reduce energy supplied from the grid. However, for
a trading interval in September 2019. 10
the system overall the current tariffs disproportionally
recover supply costs. The A1 variable consumption
The SWIS provides ideal conditions for rooftop solar PV
charge over incentivises actions that reduce grid energy
performance with an annualised average of 8.8 hours
use, such as installing rooftop solar PV.12
of sunshine a day and has the highest number of cloud
free days of all Australian capital cities.11
8 ERA, 2019, Report to the Minister for Energy on the Effectiveness of the Wholesale Electricity Market 2019 Issues Paper https://
www.erawa.com.au/cproot/20789/2/Wholesale-Electricity-Market-review-2019---Issues-paper---Final-for-publication.PDF
9 AEMO, 2019, Fact Sheet: The Wholesale Electricity Market (WEM), available at https://www.aemo.com.au/-/media/Files/About_
AEMO/About_The_Industry/Wholesale-Electricity-Market-Fact-Sheet.pdf
10 AEMO, 2019, Quarterly Energy Dynamics – Q3 2019, available at https://www.aemo.com.au/-/media/Files/Media_
Centre/2019/QED-Q3-2019.pdf
11 Geoscience Australia, 2013, Australian Energy Resource Assessment https://arena.gov.au/assets/2013/08/Chapter-10-Solar-
Energy.pdf
12 This tariff structure, where a small proportion of the fixed system costs are recovered through fixed charge, creates a cross
subsidy to customers who have solar PV from customers who do not.
D I S T R I B U T E D E N E R GY R E S O U R C E S R OA D M A P 211. T h e c l ear and present c h a l l enge
12
10
Payback Period (years)
8
6
4
2
0
Aug-12
Oct-2
Dec-12
Feb-13
Apr-13
Jun-13
Aug-13
Oct-13
Dec-13
Feb-14
Apr-14
Jun-14
Aug-14
Oct-14
Dec-14
Feb-15
Apr-15
Jun-15
Aug-15
Oct-15
Dec-15
Feb-16
Apr-16
Jun-16
Aug-16
Oct-16
Dec-16
Feb-17
Apr-17
Jun-17
Aug-17
Oct-17
Dec-17
Feb-18
Apr-18
Jun-18
Aug-18
Oct-18
Dec-18
Feb-19
Apr-19
Jun-19
Construction Month
Figure 6 – Payback period for a 4kW solar PV system
With a highly competitive market for rooftop solar PV To date, investment in rooftop solar PV has primarily
system installation and the up-front subsidy provided been driven by the expected savings in energy costs
under the Australian Government Small-scale for the individual customer, which is heavily influenced
Renewable Energy Scheme 13, as well as significant by current regulated tariff structure. The financial
reductions in component and manufacturing costs, the incentives under the current flat tariff structure do not
cost of installing solar PV has come down dramatically provide the same level of return for other forms of DER
over time. This has led to the total installed cost of such as behind the meter battery storage.
rooftop solar PV today being less than half the cost per
kilowatt than in 2012. Battery storage
The payback rates for rooftop solar PV have Distributed battery storage has not yet seen anywhere
dramatically improved over the ten years from 2010. near the same levels of uptake as rooftop solar PV. As
Some households can now recover the initial investment at June 2019, there were less than 1,000 customers with
in less than three years (Figure 6). There has also been behind the meter battery installations.
an increase in the average system size installed by
The primary factor that has limited the uptake of battery
customers. Systems have grown from an average size
storage on the SWIS is price. The installed cost of behind
of around 2.2kW in 2009-10 to 4.6kW in 2019 (based on
the meter battery storage remains a significant barrier,
inverter capacity).
with 2019 prices around the $800 – $1,000 per kWh mark.14
13 The SRES is a component of the Commonwealth Renewable Energy Target Scheme. Payment is based on the available solar
resource, so systems installed in the SWIS receive higher payments than most other states. The scheme is scheduled to end in
2030 and the value of payments is currently decreasing each year until then.
14 Solar Choice, 2019, Battery Storage Price Index – November 2019, available at https://www.solarchoice.net.au/blog/battery-
storage-price
22 D I S T R I B U T E D E N E R GY R E S O U R C E S R OA D M A P1. T h e c l ear and present c h a l l enge
Payback periods vary depending on a range of factors,
however at this price, the average payback period for Community battery storage
households under the A1 flat tariff structure is near or • A community battery allows customers to access
longer than the warranties provided by manufacturers a shared storage resource as an alternative to
and the expected lifespan of the batteries. However, investing in their own battery, which reduces the
forecast reductions in battery prices could trigger faster up-front costs for households, whilst unlocking
uptake rates in the future. additional value to the network and potentially
within the system.
The primary benefit to households of battery storage
• The Alkimos Community Battery and Meadow
is avoiding purchasing electricity at the flat rate tariff
Springs PowerBank trials highlight different
(28c/kWh) after sunset. Households with certain load
ways of delivering a community battery solution
profiles (such as low daytime and high evening loads)
to customers.
will, at a certain price point, find battery storage
• Alkimos is a retailer-led project with the
beneficial in reducing costs.
equipment owned by Synergy. Customers take
An alternative to behind the meter battery storage is for up a time-of-use tariff and pay a monthly fee
households to rent storage capacity in a community- to export an unlimited amount of excess solar to
scale battery that sits on Western Power’s distribution the battery during the day and draw back on it
network, to stockpile their excess generation. However, between 4pm and midnight.
this approach is fairly new, so there are not yet • The Meadow Springs project was initiated
widespread opportunities to participate. In addition, by Western Power in response to a network
customers are unable to participate in the provision constraint caused by high levels of solar PV.
of network and system services from their own behind Western Power owns the equipment and Synergy
the meter storage and benefit financially from such delivers the customer side product. Customers
participation. take up a time-of-use tariff and are charged
a daily value to access up to 8kWh per day of
storage and draw back on it when required.
D I S T R I B U T E D E N E R GY R E S O U R C E S R OA D M A P 231. T h e c l ear and present c h a l l enge
Electric vehicles The use of air conditioners as well as other appliances
Electric vehicles (EVs) have seen very slow uptake such as electric water heating strongly influence the
in Western Australia compared to international load profile of the electricity system. Over time, these
jurisdictions. At October 2019, there were only around technologies have increased their communications
750 registered electric cars in Western Australia, and EVs and smart technology capabilities, and, as a potentially
represent only 0.1% of new car sales. The low adoption flexible load, they can play a meaningful role in
rate is due to several factors, including price, lack of mitigating the challenges encountered in the high-DER
charging infrastructure, limited incentives to encourage future and helping customers manage their energy costs.
take up and a minimal number of vehicle models
INSIGHTS:
currently available.15
• DER covers a wide range of technology types
The Western Australian EV Working Group is looking at
including distributed generation such as rooftop
a range of issues related to electric vehicles in Western
solar PV, energy storage, electric vehicles,
Australia, including a plan to increase the number of
household appliances like air conditioners, as well
electric vehicles in the State Government fleet, electric
as more traditional demand response resources
vehicle infrastructure, and standards and incentives to
from commercial sites.
encourage uptake.
• Almost one in three households in the SWIS
now have a rooftop solar PV system, and this
Air conditioners and other appliances
is expected to continue to increase. Conversely,
The most recent Australian Bureau of Statistics data on uptake of other forms of DER such as a batteries
air conditioner use in households shows that as at 2014, and electric vehicles is currently low.
89% of residential houses in the Perth Metropolitan area • Tariff structures incentivise the size and type
had at least one air conditioner installed.16 Historically, of DER installed by customers and how it is
air-conditioning has played a significant role in driving used. Tariff structures also impact the return on
peak demand during summer months. The rapid investment for other forms of DER such as battery
increase in system demand experienced during the storage and electric vehicles.
2000s has been partially mitigated by improved energy
efficiency of air conditioners.
1.2 Where is DER uptake going?
Drawing on AEMO’s high rooftop solar PV uptake
What is a flexible load?
scenario forecasts for the SWIS, this section sets out the
• Flexible loads are loads that deliver the same
current trajectory of DER take-up across multiple DER
value to the customer independent to the time of
technologies.
day the load consumes energy
• Common examples of flexible loads are electric The SWIS generation mix is transforming, relying less on
hot water systems or pool pumps traditional utility-scale thermal generation and more
• Flexible loads can be orchestrated to minimise on large scale renewable generation and DER. Current
whole of system costs via load control or pricing trends in the growth, diversity and energy contribution
signals of DER connected to the distribution system is expected
to continue.
15 Energeia, May 2018, Australian Electric Vehicle Market Study, available at https://arena.gov.au/assets/2018/06/australian-ev-
market-study-report.pdf
16 ABS, March 2014, Energy Use and Conservation Questionnaire, available at https://www.abs.gov.au/AUSSTATS/abs@.nsf/
DetailsPage/4602.0.55.001Mar%202014
24 D I S T R I B U T E D E N E R GY R E S O U R C E S R OA D M A P1. T h e c l ear and present c h a l l enge
1.2.1 Rooftop solar PV
The CSIRO, on behalf of AEMO, has forecast installed behind the meter rooftop solar PV uptake in the SWIS under
three energy demand growth scenarios: low growth, expected growth, and high growth (Figure 7).
4,000
3,500
Total installed capacity (MW)
3,000
2,500
2,000
1,500
1,000
500
00
2017-18 2018-19 2019-20 2020-21 2021-22 2022-23 2023-24 2024-25 2025-26 2026-27 2027-28 2028-29
Low Expected High
Figure 7 – Forecast installed behind the meter PV system capacity 17
Under the expected growth scenario, installed behind 1.2.2 Battery storage
the meter solar PV capacity is forecast to grow at an The CSIRO has forecast adoption of behind the meter
average annual rate of 7.6% (122 MW per year) to reach battery storage in the SWIS to grow rapidly (Figure 8).
2,546 MW by June 2029. The high growth scenario Under the expected growth scenario, installed capacity
estimates an annual average growth of up to 11.1% to of behind the meter battery storage systems is forecast
reach 3,525 MW by June 2029.18 by the CSIRO to achieve an annual average growth
rate of 24.9%, increasing from 54 MWh in June 2020 to
398 MWh in June 2029. While there is a high expected
growth rate for storage, it is starting from a low base
and still trails expected additions of rooftop solar PV by
a significant factor.
Recent updates to the Australian Standard (AS/NZS
5139:2019) that applies to installation of behind the
meter battery storage could increase costs and delay
uptake rates.19
17 Data provided by CSIRO as at June 2019, as referenced in AEMO, June 2019, WEM Electricity Statement of Opportunities,
available at https://www.aemo.com.au/Electricity/Wholesale-Electricity-Market-WEM/Planning-and-forecasting/WEM-
Electricity-Statement-of-Opportunities.
18 These forecasts largely align with the growth rates seen in the “Groundhog Day” scenario of the Whole of System Plan. Energy
Transformation Taskforce, August 2019, Whole of System Plan Modelling Scenarios, available at https://www.wa.gov.au/sites/
default/files/2019-08/Information-paper-Whole-of-System-Plan-Modelling-Scenarios.pdf
19 These requirements include additional non-combustible materials for installation on walls as well as limits on the proximity to
windows, ventilation, hot water systems, air conditioning units or other appliances. The standard places a higher requirement
than the international standard (IEC 62619) which applies in Europe, and some major manufacturers have argued that the
standard is too strict compared to other jurisdictions where batteries that meet IEC 62619 are deemed sufficiently safe to be
installed inside houses.
D I S T R I B U T E D E N E R GY R E S O U R C E S R OA D M A P 251. T h e c l ear and present c h a l l enge
700
600
Total installed capacity (MWh)
500
400
300
200
100
0
2019-20 2020-21 2021-22 2022-23 2023-24 2024-25 2025-26 2026-27 2027-28 2028-29
Low Expected High
Figure 8 – Forecast installed capacity of battery storage systems (behind the meter)20
1.2.3 Electric vehicles 1.2.4 Smart appliances and metering
The CSIRO forecasts EV numbers growing from the DER can also comprise new technology like data
current number of around 500 to reach 44,000 by June services, home automation and smart appliances such
2029 under the expected growth scenario, or 128,000 as air-conditioning.22 These types of new and enhanced
under the high growth scenario.21 Using this forecast, technologies can become active DER within the
EV sales and associated vehicle-to-grid capabilities electricity system, able to be co-ordinated to provide
remain limited and do not achieve enough uptake to be services on the demand side of the system.
a significant factor in load growth or grid management The challenge will be for the electricity market to
before 2025. interact with and capture the benefits of smart
technology. A range of initiatives will be needed,
including new and/or improved standards,23 to allow
smart appliances to be actively used in the market in a
meaningful way.
20 Data provided by CSIRO as at June 2019, as referenced in the 2019 Electricity Statement of Opportunities.
21 Ibid. In forecasting EV numbers in the SWIS, the CSIRO assumed a slow start due to limited infrastructure, the narrow range of
models currently available, and higher cost relative to vehicles with internal combustion engines. The difficulty in estimating
EV uptake, due to diverging cost projections and uncertainty regarding the evolution of the industry and of government policy,
translates to a wide range of growth forecasts.
22 Some companies, such as Google and Apple, are already active in this space and many appliances have some remote-control
functionality available.
23 The Commonwealth recently published a report reviewing the Greenhouse and Energy Minimum Standards Act 2012 (GEMS
Act). This report recommended on mandating standards for demand response in key appliances. https://www.energy.gov.au/
sites/default/files/gems_review_-_final_report-accessible.pdf
26 D I S T R I B U T E D E N E R GY R E S O U R C E S R OA D M A P1. T h e c l ear and present c h a l l enge
Advanced metering allows for improved tariff products The Energy Transformation Taskforce has worked
and can improve visibility of DER impacts on the closely with Western Power, AEMO, Synergy and other
network. Western Power has commenced deployment stakeholders to understand the implications of DER
of advanced meters and associated communications uptake in the SWIS. This engagement has included
infrastructure (Advanced Metering Infrastructure, or reaching an understanding of when risks to the
AMI). In the first phase of the AMI program, Western electricity system are likely to start manifesting.
Power is aiming to install around 300,000 units across
Without changes to policy, technical, market and
existing network connections and for new homes
regulatory arrangements, there is a very high risk that
over the next three years to June 2022. Horizon Power
increasing solar penetration will threaten the secure,
completed an upgrade of its entire customer base to
safe and efficient operation of the SWIS as early as
AMI in 2016.
2022. This is due to:
1.2.5 Embedded networks and microgrids • declining minimum system demand due to the
volume of rooftop solar PV output, which will continue
Embedded networks and microgrids such as caravan
to reduce the dispatch and ultimately the viability of
parks, shopping centres and apartment blocks
traditional generators that presently provide the ESS
have been a part of the SWIS for some time. These
required for the security of the power system;
arrangements typically have a number of individual
customers grouped behind a single network connection. • high intermittent solar penetration, which will
The rise of DER is driving innovation in customer increase volatility of prices and system operations;
offerings and services within such arrangements, as and
well as emerging models across new sub-divisions • technical challenges (such as managing voltage
and local communities. These models are expected levels) at the distribution network level, which will
to continue to grow into the future, and will require increase due to DER generation and growth of two-
appropriate policy, technical, market and regulatory way power flows.
settings.
The lack of visibility of DER capability and its location will
compound these challenges. Western Power does not
1.3 What is the impact of increasing levels have the same level of visibility, control and situational
of DER? awareness of DER on the distribution network as
This section discusses how increasing levels of DER in the system operator (AEMO) does with transmission
the SWIS impacts system security, market efficiency connected generators. Similarly, the system operator
and network investments as well as what this means for does not have visibility of the location or output of
customers. DER on the distribution network, and sudden changes
to output caused by cloud and weather events can
The continued uptake of passive DER is changing the
significantly impact system operations.
way the electricity system is operated and managed. In
the last quarter of 2018, for the first time since the WEM This problem will multiply as more DER enter the
commenced in 2006, energy produced by residential system. The following sub-sections identify how these
and small business customer24 DER was, at times, challenges present at a system and network level, and
greater than their total demand. the impacts on customers.
24 Non-contestable customers are those who consume 50 MWh or less of electricity per annum and includes most residential
households and small businesses in Western Australia. In the SWIS, only Synergy can supply non contestable customers.
D I S T R I B U T E D E N E R GY R E S O U R C E S R OA D M A P 271. T h e c l ear and present c h a l l enge
1.3.1 Power system impacts of DER In its March 2019 report Integrating Utility-scale
The SWIS daily load profile, which represents the energy Renewables and DER in the SWIS paper, AEMO
drawn from the grid by customers, has evolved in recent outlined its forecasts for rooftop solar PV uptake and
years to resemble what is known as the ‘duck curve’, the evolution of the duck curve. The paper provides an
due to its shape. The self-consumption of energy from indication of the levels at which the SWIS would likely
rooftop solar PV generation is leading to low customer experience significant problems with market efficiency
demand from the grid in the middle of the day – the and system stability resulting largely from rooftop
‘belly of the duck’. It is followed by a sharp increase in solar PV (Figure 9), noting that the decline in minimum
system demand in the late afternoon as consumers operational demand may breach technical limits
usage increases as they return home and rooftop solar (around 700 MW) as early as 2022.25
PV generation decreases to zero as the sun sets.
The shape of the duck curve is more pronounced during
days of low demand for energy, for example during a
sunny, mild autumn or spring weekend day, when total
customer energy requirements are low and rooftop
solar PV generation is high.
2,500
2,000
Systemload (MW)
1,500
Market inefficiencies
1,000
System security at risk
500
0
00:00:00 03:00:00 06:00:00 09:00:00 12:00:00 15:00:00 18:00:00 21:00:00 00:00:00
Time of day
28/10/2018 2020 2022 2024 2026 2028
Figure 9 – AEMO analysis on the shape of the load curve on the minimum demand day26
25 AEMO, Integrating Utility-Scale Renewables and Distributed Energy Resources in the SWIS. p 3, available at https://www.aemo.
com.au/-/media/Files/Electricity/WEM/Security_and_Reliability/2019/Integrating-Utility-scale-Renewables-and-DER-in-the-
SWIS.pdf.
26 Ibid. p 28
28 D I S T R I B U T E D E N E R GY R E S O U R C E S R OA D M A PYou can also read