Distribution and density of Lutraria rhynchaena Jonas, 1844 relate to sediment while reproduction shows multiple peaks per year in Cat Ba-Ha Long ...
←
→
Page content transcription
If your browser does not render page correctly, please read the page content below
Open Life Sciences 2020; 15: 721–734
Research Article
Do Manh Hao*, Do Trung Sy, Dao Thi Anh Tuyet, Le Minh Hiep, Nguyen Tien Dat,
Do Thi Thu Huong, Do Cong Thung, Dang Hoai Nhon, Tran Dinh Lan, Nguyen Van Quan
Distribution and density of Lutraria rhynchaena Jonas, 1844
relate to sediment while reproduction shows multiple peaks
per year in Cat Ba-Ha Long Bay, Vietnam
https://doi.org/10.1515/biol-2020-0072 declined over recent decades. Therefore, there is an urgent
received November 07, 2019; accepted July 14, 2020 need of scientific basis to propose effective fishery
Abstract: Lutraria rhynchaena Jonas, 1844 is of great management measures and improve artificial aquaculture
commercial interest, but its reserves have dramatically of the clams. In this study, we investigated the distribution
and density of L. rhynchaena, sediment characteristics,
and established the clam’s reproductive cycle through
monthly observations from August 2017 to July 2018. The
* Corresponding author: Do Manh Hao, Do Son Marine Research study results showed that distribution and density of clams
Station, Institute of Marine Environment and Resources, Vietnam are related to sediment types, and the sediment type of
Academy of Science and Technology, No. 246 Da Nang Street, Ngo
Quyen District, Hai Phong City, Vietnam; Faculty of Marine Science medium sand is likely the best benthic substrate for the
and Technology, Graduate University of Science and Technology, clams. The spawning of clams occurred throughout the
Vietnam Academy of Science and Technology, No. 18 Hoang Quoc year with three spawning peaks in January, April and
Viet Street, Cau Giay District, Ha Noi City, Vietnam, September. For the sustainable management of the clam
tel: +84 (0) 962 731 070, e-mail: haoimer@gmail.com
Do Trung Sy: Department of Material Technology and Environment,
resource in Cat Ba-Ha Long Bay, the fishery authorities can
Institute of Chemistry, Vietnam Academy of Science and issue a ban on harvest of the clams in spawning peak
Technology, No. 18 Hoang Quoc Viet Street, Cau Giay District, months in January, April and September.
Ha Noi City, Vietnam
Dao Thi Anh Tuyet, Le Minh Hiep, Nguyen Tien Dai: Do Son Marine Keywords: Lutraria rhynchaena, Cat Ba-Ha Long Bay,
Research Station, Institute of Marine Environment and Resources, distribution, density, reproductive cycle
Vietnam Academy of Science and Technology, No. 246 Da Nang
Street, Ngo Quyen District, Hai Phong City, Vietnam
Do Thi Thu Huong: Department of Marine Database and Remote
Sensing, Institute of Marine Environment and Resources, Vietnam
Academy of Science and Technology, No. 246 Da Nang Street, Ngo
1 Introduction
Quyen District, Hai Phong City, Vietnam
Do Cong Thung: Department of Marine Animal, Institute of Marine Cat Ba-Ha Long Bay is located on the northeast coast of
Environment and Resources, Vietnam Academy of Science and Vietnam. The bay is characterised by karst towers, many
Technology, No. 246 Da Nang Street, Ngo Quyen District, Hai Phong
large islands and islets (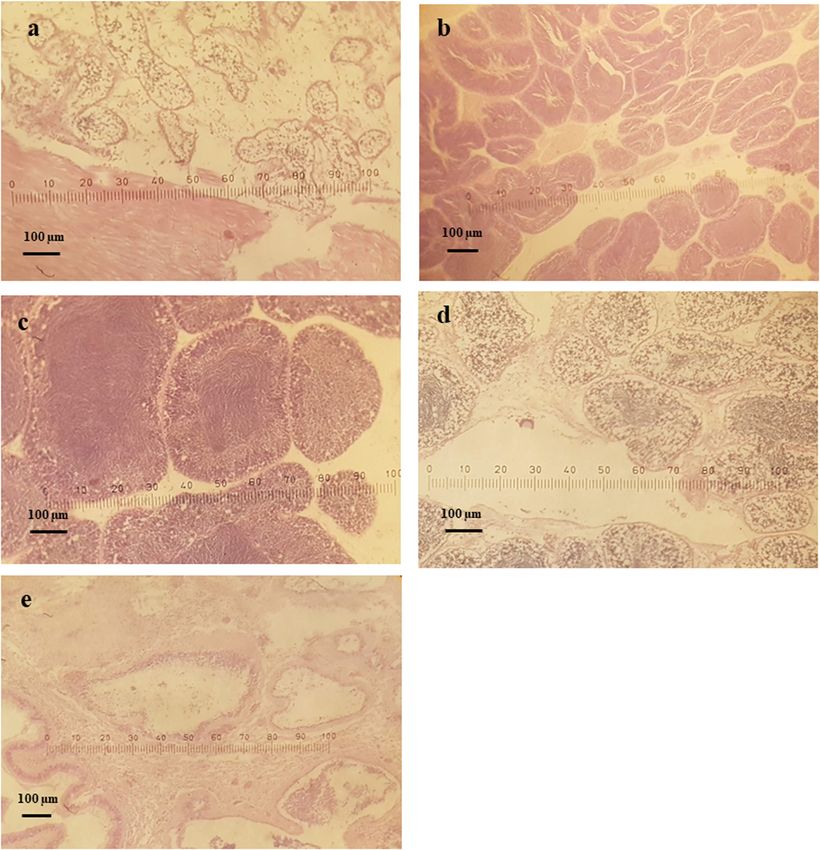
722 Do Manh Hao et al.
Cat Ba-Ha Long Bay of Vietnam and a few surrounding density and reproductive cycle of L. rhynchaena and to
countries such as Philippines, Thailand, China and measure water temperature, salinity and sediment char-
Australia [4,5]. This species is of great commercial acteristics between August 2017 and July 2018 (Figure 1).
interest, but the production has been dramatically The density of L. rhynchaena at each study site was
declined over recent decades; within 30 years (1979– estimated monthly from the average of three plots (5 m ×
2008), the reserves of clams fell approximately 100-fold, 5 m) which were randomly allocated.
from about 1.07 to 0.01 ton/ha [4,6]. Although artificial
seed has been produced in 2004 [7], artificial cultivation
was just bloomed in a short time (2004–2011), then
rapidly declined due to mass mortality during the rearing 2.2 Sampling
cycle. Therefore, there is an urgent need of scientific basis
to propose effective fishery management measures and L. rhynchaena specimens were collected monthly during
improve artificial aquaculture of the clams. the daytime when the siphons of the clams were clearly
Area and time restrictions are effective fishery visible. Clams were stored in an icebox for transport
management measures [8]. Of which, area restrictions are and subsequent processing in the laboratory. Surface
to establish area closures whether they are temporary, sediment samples were also collected at the 16 sampling
seasonal or permanent, while time restrictions are to sites using a grab sampler and stored in nylon basket
restrict access by fishers to an area in some way. Studies pockets in an icebox until grain-size analysis.
on the biology and ecology of the clams in the area are
still scant. In Vietnam, so far, only two studies have been
carried out around Cat Ba Island in 1979 and 2008 [4,6].
Therefore, in this study, we focused on two main aims: (1) 2.3 Analysis of environmental variables
to investigate the distribution, density and reproductive
cycle of L. rhynchaena in Cat Ba-Ha Long Bay and (2) to The temperature and salinity of surface waters were
assess their relationship with sediment conditions, measured monthly at all sites using a thermometer and
temperature and salinity. The timing of clam spawning a refractometer, respectively. Sediment grain size was
peaks will be the basis for managers to enact a ban on analysed using a series of sieves for coarse grain (>63 µm)
seasonal or monthly fishing for the clams. The data of and the pipette method for fine grain (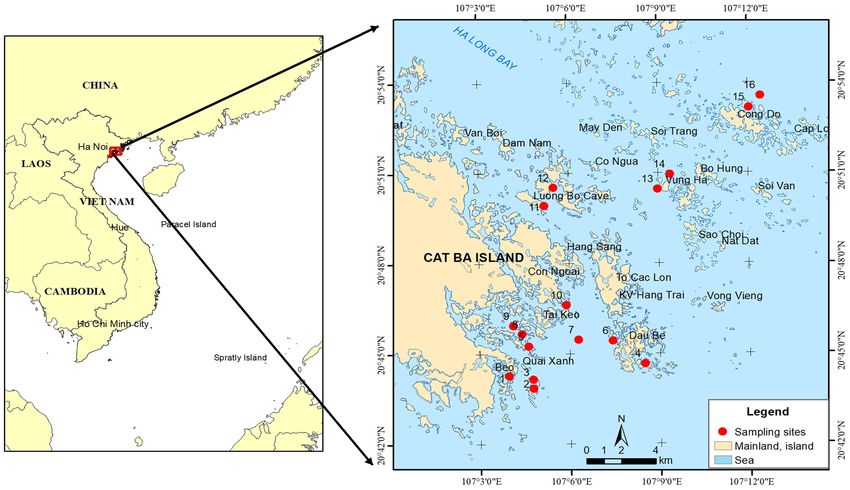
Distribution and density of Lutraria rhynchaena Jonas, 1844 in Cat Ba-Ha Long Bay, Vietnam 723
Figure 1: Sampling sites of L. rhynchaena Jonas, 1844 in Cat Ba-Ha Long Bay, Vietnam.
poorly sorted, very poorly sorted and extremely poorly in 70% ethanol. Samples were initially sectioned into
sorted) and Sk (very fine skewed, fine skewed, symme- slices less than 28 mm thick, dehydrated in 95% ethanol
trical, coarse skewed and very coarse skewed) reflect the for 4 h, softened in methyl salicylate for 12–24 h,
homogeneity of grain size in sediments under influence embedded in melting paraffin at 65°C for at least 6 h,
of current, wave and tide. sectioned by a microtome into slices of 5–7 µm thick
and fixed on glass microscope slides before staining
ln P 16 + ln P 50 + ln P 84
Md = exp , (1) with Hematoxylin Harris for 10 min, rinsed with distilled
3
water for 5 min, then stained with 1% Eosin Y for 12 min.
ln P 16 − ln P 84 ln P 5 − ln P 95 The prepared slides were examined and photographed
S0 = exp + , (2)
4 6.6 using a light microscope with attached camera at
ln P 16 + ln P 84 − 2(ln P 50) 400× magnification to determine sex and reproductive
Sk = stage.
2(ln P 84 − ln P 16)
(3) The presence of seminal vesicles containing hair-
ln P 5 + ln P 95 − 2(ln P 50)
+ , like spermatozoa in the gonad indicated a male
2(ln P 95 − ln P 5)
clam, while the presence of follicles with oogonia or
where P5, P16, P50, P84 and P95 are the grain diameters polygonal-shaped oocytes indicated a female clam. For
at 5%, 16%, 50%, 84% and 95% at the cumulative hermaphroditic individuals, there were both hair-like
percentile value, respectively. spermatozoa and oogonia in the gonad.
Clam reproductive maturity was categorised into five
stages using the maturity scale described by Cross et al.
2.4 Histological techniques (2012) [16], whereby maturity stages were designated as
“indifferent, developing, ripe, spawning and spent”.
A total of 401 individuals of L. rhynchaena were brought When more than one developmental stage was present
to the laboratory where the visceral mass was removed in a single individual, maturity was categorised based on
and fixed in Bouin’s solution for 24 h, then preserved which stage accounts for the highest percentage.724 Do Manh Hao et al.
2.5 Female gonad development observed female:male sex ratio and the expected
female:male sex ratio of 1:1. Single-factor analysis of
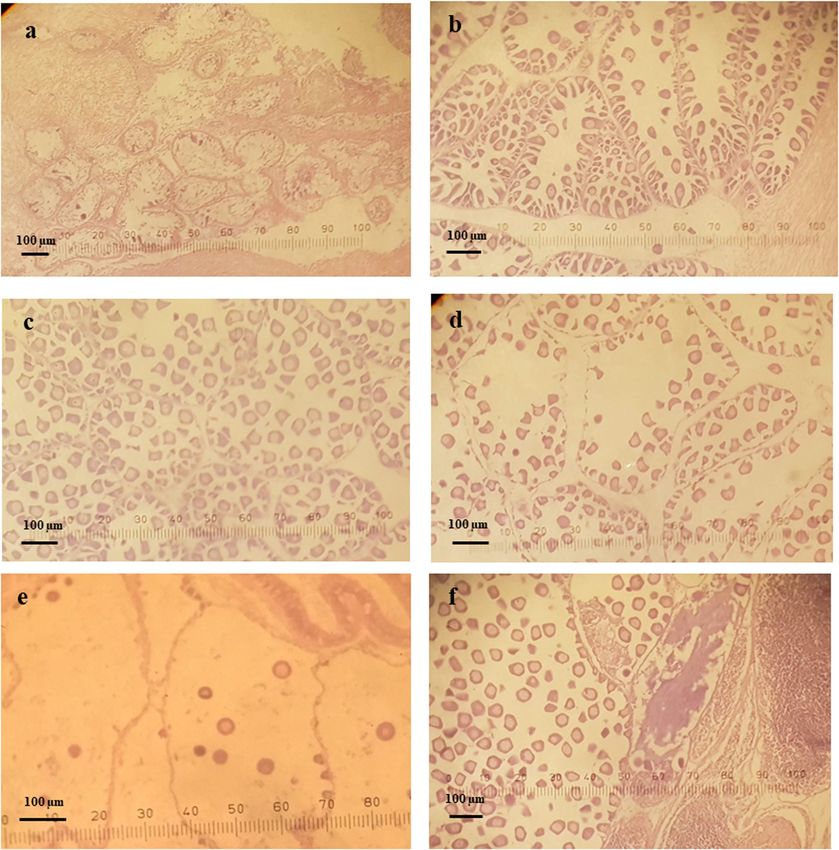
The indifferent stage of development of the female variance (ANOVA) was used to compare the mean values
reproductive system was determined when specific of temperature and salinity temporally and spatially and
inclusions were seen in the follicle cells and early to examine the effects of location or sediment types on
oocytes were present in the alveolar membrane. The the density of clams with a significance level of 0.05. If
developing stage is recognised by an increasing number the ANOVA was significant, the post-hoc tests were
and size of oocytes. There is also a central lumen in each further conducted to compare the difference in mean
follicle into which stalked oocytes protrude. At the ripe values between each pair of samples. F-Test Two-Sample
stage of development of the female reproductive system, for Variances was used to examine the variance equality
many mature, spherical free oocytes are found within the between each pair of samples before T-Test Two-Sample
follicular lumen. At the spawning stage, the number of Assuming Equal Variances or T-Test Two-Sample
oocytes decreases and empty spaces in the lumen appear Assuming Unequal Variances was used to compare the
as a result of the release of mature oocytes. Emptying difference in mean values of clam’s density between
follicles and the cessation of oogenesis in all follicles are each pair of samples (sampling sites and sediment
characteristics of this stage. At the last stage, the gonads types). T-Test paired two sample for means was used to
are collapsed and irregular in shape, with big empty compare the difference in mean values of temperature
spaces in the lumen and few germinal cells. and salinity spatially and temporally.
2.6 Male gonad development 3 Results
The indifferent stage of development of the male
3.1 Water temperature and salinity
reproductive system is characterised by the presence of
aberrant forms of multinucleated non-pyctonic cysts and
pyctonic cells. The basal membrane and follicle cells are During the study period, the average water temperature
the dominant structural elements, with a few primary ranged from 19.0 to 32.5°C, with a minimum of 19.0°C
spermatocytes or spermatogonia visible at the periphery recorded in January 2018 and a maximum of 32.5°C in
of the lumen. In the developing stage, the maturation July 2018 (Figure 2). There was no significant difference
and proliferation of the spermatocytes take place. In ripe of temperature spatially, but there was significant
male clams, the follicle is filled with dense radiating difference in monthly temperature (df = 15, α = 0.05).
bands of spermatozoa with tails which project into the However, there were no significant differences in
central lumen. At the spawning stage, the follicle is temperature between May (2018) and September (2017)
characterised by lower number of spermatozoa com- (p = 0.04, α = 0.01), and between May (2018) and
pared to the ripe stage. A few spermatozoa remain in the October (2017) (p = 0.04, α = 0.01). The temperature in
radiating bands, but the rows of follicle cells gradually January was significantly the lowest than those of other
increase to replace the spawned spermatozoa. At the months (p ≤ 2.4 × 10⁻⁴, α = 0.01) (Table A1). The salinity
spent stage in males, the follicles are almost completely was around 28.0–30.0‰ in all of the studied sites
filled with follicle cells, and the reduced lumen contains during dry months (November–March) but decreased to
a few sex cells. 22.0‰ at site No. 01 near the coast during the rainy
season (May–September) due to river discharge and tidal
effects (Figure 2). There was no significant difference of
salinity spatially (df = 15, α = 0.05), but there was
2.7 Statistical analysis significant difference in salinity seasonally (df = 11, α =
0.05). However, there were no significant differences in
The sex ratio of clams was calculated by dividing the salinity among November 2017, December 2017, January
number of female individuals by the number of male 2018 and March 2018 (df = 3, α = 0.01), and between
individuals. A Chi-squared test was used to determine October 2017 and May 2018 (p = 0.03, α = 0.01)
whether there was a significant difference between the (Table A2).Distribution and density of Lutraria rhynchaena Jonas, 1844 in Cat Ba-Ha Long Bay, Vietnam 725
35.0 31.0
33.0 29.0
31.0
27.0
Temperature (oC)
29.0
Salinity (‰)
27.0 25.0
25.0 23.0
23.0 21.0
21.0
19.0
19.0
17.0 17.0
15.0 15.0
Temp. Sal.
Figure 2: Monthly variations of surface water temperature and salinity at study sites.
3.2 Sedimentary environment coral reef, medium sand, coarse silt and fine silt. The
very coarse sands had a Md of 1176.7 µm, consisting of
The sedimentary environment consisted of submerged clastic particles and shell debris. They were very poorly
plain, coral reefs and tidal channels. Submerged plain sorted, and the sediment was towards small particles.
occupied the largest area of the whole Cat Ba-Ha Long The very coarse sand + coral reef had a Md ranging from
Bay region surveyed. Water depth was generally 2–5 m 1154.5 to 1560.9 µm, consisting of clastic particles, shell
but reached 20 m in the areas of Dau Be and Lan Ha. The debris, living coral and rock bottom. They were very
benthos was mainly covered by fine silt, and rarely by poorly to poorly sorted, and the sediment was towards
sand and shell debris. small particles and symmetrical. The coarse sands had a
Based on the grain size characteristics and covering Md ranging from 581.5 to 757.8 µm, consisting of dead
of living coral, the sediments were divided into seven coral particles and shell debris. The coarse sand + coral
different sediment types, consisting of very coarse sand, reef had a Md of 665.6 µm, consisting of sand, shell
very coarse sand + coral reef, coarse sand, coarse sand + debris, living coral and rock bottom. Both the coarse
Table 1: Characteristics of sediment distribution and density of L. rhynchaena in Cat Ba-Ha Long Bay
Site Md (µm) S0 Sk Sediment type Sorting Skewness Density
(ind./100 m2)
1 708.10 2.98 −0.15 Coarse sand Poorly sorted Fine skewed 6.9
2 581.50 3.92 −0.24 Coarse sand Poorly sorted Fine skewed 26.3
3 6.30 6.03 0.14 Fine silt Very poorly sorted Coarse skewed 0.0
4 1560.80 2.67 −0.03 Very coarse sand + coral reef Poorly sorted Symmetrical 22.2
5 399.40 3.77 0.36 Medium sand Poorly sorted Very coarse skewed 30.8
6 1560.90 2.67 −0.04 Very coarse sand + coral reef Poorly sorted Symmetrical 24.7
7 6.40 6.01 0.14 Fine silt Very poorly sorted Coarse skewed 0.0
8 757.80 2.84 −0.16 Coarse sand Poorly sorted Fine skewed 58.9
9 6.30 6.02 0.14 Fine silt Very poorly sorted Coarse skewed 0.0
10 665.60 3.41 −0.07 Coarse sand + coral reef Poorly sorted Symmetrical 10.7
11 21.40 6.13 −0.70 Coarse silt Very poorly sorted Very fine skewed 0.0
12 491.50 6.00 −0.25 Medium sand Very poorly sorted Fine skewed 94.7
13 21.40 6.14 −0.70 Coarse silt Very poorly sorted Very fine skewed 0.0
14 1176.70 4.77 −0.33 Very coarse sand Very poorly sorted Very fine skewed 33.2
15 1154.50 4.95 −0.37 Very coarse sand + coral reef Very poorly sorted Very fine skewed 28.0
16 5.20 5.11 0.16 Fine silt Very poorly sorted Symmetrical 0.0726 Do Manh Hao et al.
Table 2: t- and p-values between each pair of density groups of L. rhynchaena based on sampling locations using t-test (α = 0.01)
t-Test First group Second group Third group Fourth group Fifth group Sixth group
First group
Second group 5.3/1.2 × 10−06
Third group 12.7/4.2 × 10−15 7.2/1.2 × 10−08
Fourth group 16.1/9.5 × 10−18 11.3/2.3 × 10−13 18.8/1.9 × 10−49
Fifth group 16.6/5.7 × 10−19 11.9/1.6 × 10−14 16.0/5.5 × 10−28 3.5/1.0 × 10−03
Sixth group 18.2/2.0 × 10−19 13.8/9.6 × 10−16 34.1/1.1 × 10−88 27.3/3.4 × 10−25 6.9/5.6 × 10−08
Table 3: t- and p-values between each pair of density groups of L. rhynchaena based on sediment types using t-test (α = 0.01)
t-Test First group Second group Third group Fourth group Fifth group
First group
Second group 6.2/1.3 × 10−08
Third group 7.9/1.4 × 10−11 2.7/7.0 × 10−03
Fourth group 11.2/2.1 × 10−17 10.2/7.1 × 10−19 11.0/3.0 × 10−20
Fifth group 13.5/2.6 × 10−21 15.7/6.2 × 10−33 20.2/2.0 × 10−38 27.3/3.0 × 10−25
sand with and without coral reef were poorly sorted and (n = 36) at site No. 12. The second density group was 58.9 ±
towards fine skewed and symmetrical. The medium sand 25.6 ind./100 m2 (n = 216) at site No. 8. The third density
had a Md ranging from 399.4 to 491.5 µm, was very group was 27.5 ± 11.9 ind./100 m2 (n = 36) at sites No. 2, 4,
poorly to poorly sorted, and the sediment was towards 5, 6, 14 and 15. The fourth density group was 10.7 ±
very coarse skewed and fine skewed. The coarse silt had 2.3 ind./100 m2 (n = 36) at site No. 10. The fifth density
a Md of 21.4 µm, was very poorly sorted and skewed group was 6.9 ± 6.0 ind./100 m2 (n = 36) at site No. 1. The
towards very fine. The fine silt had a Md of 6.0 µm and sixth density group was 0.0 ind./100 m2 (n = 216) at sites
was very poorly sorted (Table 1). No. 3, 7, 9, 11, 13 and 16.
Based on sediment types, the density of clams was
categorised into five significant different density groups
3.3 Distribution and density of (df ≥ 35, α = 0.01) (Table 3). The first group had the
highest density of 62.7 ± 39.4 ind./100 m2 (n = 72) in
L. rhynchaena
medium sand beds. The second group had a density of
31.3 ± 23.9 ind./100 m2 (n = 144) in very coarse sand beds
L. rhynchaena was found to be only distributed in small
and coarse sand beds. The third group had a density of
beds scattered around islands. The presence of clams
25.0 ± 12.8 ind./100 m2 (n = 108) in very coarse sand + coral
depended on substrate compositions, usually occurring on
five different substrate types: very coarse sand + coral reef,
very coarse sand, coarse sand + coral reef, coarse sand and
medium sand. We did not find the clams in other substrate 120.0
types such as coarse silt or fine silt, although these
100.0
substrate types dominated the seabed in Cat Ba-Ha Long
80.0
Ind./100m2
Bay. The clams occured in environments where salinity
ranged from 22.0 to 30.0‰. Salinity in the area fluctuated 60.0
seasonally, with some coastal sites being characterised by 40.0
low salinity during the rainy season (Figure 2). 20.0
The population density of the clams was low in
0.0
almost all investigated sites, ranging from 0.0 to 94.7 Medium sand Very coarse Very coarse Coarse sand + Coarse silt &
ind./100 m2 (Table 1). Based on sampling locations, the sand & Coarse sand+coral
sand reef
coral reef Fine silt
density of clams was categorised into six significant
different groups (df ≥ 35, α = 0.01) (Table 2). The first Figure 3: Density of L. rhynchaena as a function of sediment type in
density group was the highest one 94.7 ± 31.2 ind./100 m2 the surveys (2017–2018). Error bars present standard deviation.Distribution and density of Lutraria rhynchaena Jonas, 1844 in Cat Ba-Ha Long Bay, Vietnam 727
100
90
80
70
Each sex (%)
60
50
40
30
20
10
0
Female Male Hermaphrodite
Figure 4: Sex ratio of L. rhynchaena at Cat Ba-Ha Long Bay over the study period.
reef bed. The fourth group had a density of 10.7 ± ratio was not significantly different from a 1:1 ratio (χ2 =
2.3 ind./100 m2 (n = 36) in coarse sand + coral reef bed. 1.4, df = 1, p > 0.05). Although statistical tests were not
The fifth group had a density of 0.0 ind./100 m2 applied to individual months, all months were close to a
(n = 108) in coarse silt beds and fine silt beds (Figure 3). 1:1 sex ratio with slightly more males than females, with
the exception of August and March when there were
more females (Figure 4).
3.4 Sex ratio
A total of 401 individuals of L. rhynchaena were collected 3.5 Reproductive cycle
over 12 months from August 2017 to July 2018. The
results revealed that 188 (46.88%) were female, 211 3.5.1 Females
(52.62%) were male and two (0.50%) were determined as
hermaphrodites. The overall female:male sex ratio was During the course of the study, all five stages of
1:1.12. However, the Chi-square test showed that this gametogenesis were observed in L. rhynchaena. The
100
Female L. rhynchaena at each stage (%)
90
80
70
60
50
40
30
20
10
0
Spent Spawning Ripe Developing Indifferent
Figure 5: Stages of gametogenesis observed in female clams over the study period.728 Do Manh Hao et al. Figure 6: Microphotographs of gonadal development stages of female L. rhynchaena: (a) indifferent, (b) developing, (c) ripe, (d) spawning, (e) spent and (f) hermaphrodite. percentage of clams at the indifferent stage ranged from percentages at this stage were recorded in November 0.00 to 13.33%, and there were no clams at this stage of (61.54%), June (38.89%) and October (35.29%). The gametogenesis in April, May or October. The highest percentage of clams at the ripe stage ranged from percentages of clams at the indifferent stage were 7.14% to 64.29%, with an average value of 38.75%. The recorded in December (13.33%), January (11.11%) and highest percentages were recorded in March (64.29%), June (11.11%). The percentage of clams at the developing August (56.25%) and December (53.33%), whereas the stage ranged from 10.00% to 61.54%, with the lowest lowest percentage was recorded in May (7.14%). The percentages being recorded in January (11.11%), April percentage of clams at the spawning stage ranged from (13.33%) and September (10.00%). The highest 0.00 to 46.67%, with an average value of 19.74%. The
Distribution and density of Lutraria rhynchaena Jonas, 1844 in Cat Ba-Ha Long Bay, Vietnam 729
highest percentages were recorded in April (46.67%), failed to find any clams at this stage in October,
September (35.00%) and January (33.33%). In November or March; in February and July, the percen-
November, spawning clams were not found. The tage of spawning stage clams was low (4.35–7.14%).
percentage of clams at the spent stage ranged from The highest percentages of clams at the spawning stage
0.00 to 57.14%, with an average value of 9.56%, and the were recorded in April (44.44%), January (33.33%)
highest percentage was recorded in May (57.14%) and September (31.82%). The percentage of clams at
(Figures 5 and 6). the spent stage ranged from 0.00 to 31.58%, and we
failed to find any clams at this stage in all months
with the exception of January (22.22%), April (5.56%),
3.5.2 Males May (31.58%) and September (13.64%) (Figures 7
and 8).
The average percentage of male clams was the highest at
the ripe stage (31.43%), followed by the developing stage
(28.00%), indifferent stage (18.50%) and spawning stage
(15.99%). The percentage of clams was the lowest at 4 Discussion
the spent stage (6.08%). The percentage of clams at the
indifferent stage ranged from 0.00 to 42.86%, with the 4.1 Sediment types, distribution and
highest percentages being recorded in February
density of L. rhynchaena
(42.86%), October (40.91%), May (31.58%) and June
(30.43%); in the remaining months, the percentage was
lower than 25.00%. The percentage of clams at the This study revealed that the distribution of L. rhynchaena
developing stage ranged from 10.53% to 55.56%, with the was associated with substrate types in Cat Ba-Ha Long
highest percentages being recorded in November Bay. The clams also inhabited within rock slits on hard
(55.56%) and March (50.00%). The percentage of clams bottom, with or without coral covering. On the soft
at the ripe stage ranged from 5.26% to 53.30%. The bottom, the clams were only distributed on the following
highest percentages were recorded in August (53.33%), substrate types: sand, coral and shell debris. The clams
December (50.00%) and July (52.63%), whereas the were not found on coarse silt or fine silt substrate types,
lowest percentages of clams at this ripe stage were although these are the dominant substrate types within
registered in May (5.26%), February (21.43%) and the study area. Substrate type influences the distribution
October (22.73%). The percentage of clams at the of macro-benthic communities [17–23]. For example,
spawning stage ranged from 0.00 to 44.44%, and we Mya arenaria with burrowing behaviour similar to L.
Male L. rhynchaena at each stage (%)
100
90
80
70
60
50
40
30
20
10
0
Indifferent Developing Ripe Spawning Spent
Figure 7: Stages of gametogenesis observed in male clams over the study period.730 Do Manh Hao et al. Figure 8: Microphotographs of gonadal development stages of male L. rhynchaena: (a) indifferent, (b) developing, (c) ripe, (d) spawning and (e) spent. rhynchaena primarily inhabits sand and mud substrates influence anti-predator abilities of clams, and although [24], with higher densities being observed in sand coarse sediments have the most energy consumption for substrates [25]. In some cases, growth rates of clams metabolic activities, they have lower predation risk can be impacted by sediment type, with slower growth compared to finer sediments [25]. Moreover, differences rates being associated with the sites comprising greater in clam densities between sediment types could also be contents of fine particle (silt and clay) sediments [20]. related to variations in feeding conditions, which were Certain substrate compositions provide bivalves with probably determined by localised features such as the refuge against predators. Sediment type can also hydrodynamic regime [20]. The study results showed
Distribution and density of Lutraria rhynchaena Jonas, 1844 in Cat Ba-Ha Long Bay, Vietnam 731
that the density of L. rhynchaena is significantly related development as in January. According to Bantoto and
to benthic substrate types; the natural clam beds with Ilano (2011) [5], L. rhynchaena also has gonad in
medium sands could be the best substrate environments developing, mature and spawning stages occurring
for the clams. throughout the year, with two spawning peaks in
January and June. The divergence of spawning time
was also recorded for other clam species (e.g. Mya
arenaria and Marcia optima). In Skagit Bay, Washington,
4.2 Gametogenesis development and USA, spawning of Mya arenaria lasts from late May to
environmental conditions early August, with its peak in June–July [26]. In Cape
Ann, Massachusetts, clams have been recorded to spawn
The female:male sex ratio of L. rhynchaena in the present twice each year, in March–April and June–July [16]. In
study was approximately 1:1.12, slightly more in favour eastern Atlantic waters, the majority of spawning periods
of males but the difference is not significant. The trend has been recorded in the summer months, May and June
that the percentage of male individuals is higher than [16]. On the coast of India, the spawning season of
that of females was previously observed for L. rhynch- Marcia optima has been recorded from May to July in the
aena in North Bais Bay, Philippines [5], and in other south-east, while in the south-west, it is from March to
clam species as well [16,26,27]. We registered two May [29].
hermaphroditic clams, which is the first evidence of It is noteworthy that the percentage of clams in
the phenomenon for L. rhynchaena. However, the the ripe stage of maturity was often high throughout the
hermaphroditism has been described in several other year, with the exception of the month following the
clam species [27]. Although self-fertilisation is not peak-spawning month. It seems that gametogenesis of
possible, this characteristic allows them to reproduce clams was affected by local environmental conditions. In
with both male and female clams. This reduces the temperate waters, rising temperatures in summer
burden of finding a compatible mate, while simulta- months can synchronise the ripe and spawning stages
neously doubling the number of offspring produced by of bivalve molluscs [16,30–36]. According to Nelson
the process. As with all other forms of sexual reproduc- (1928) [32], spawning of bivalve molluscs occurs on a
tion, hermaphroditism ensures that new gene combina- rising temperature, but maturation progress is triggered
tions be passed on to further generations [28]. The at a temperature slightly below that in which spawning
reproductive strategy may be the adaptation of the clams occurs. Temperature also appears to be a more critical
with sparse density condition. Although the protandry of factor in the timing of gonad maturation than in
L. rhynchaena was found in North Bais Bay, Philippines triggering the release of gametes in Mya arenaria [30].
[5], it was not found in Cat Ba-Ha Long Bay. The Spawning of Mya arenaria peaks in the months after
result showed that the reproductive characteristic of water temperatures reaches its highest [16]. Temperature
L. rhynchaena could change according to locally envir- also probably controls gonad development of the venerid
onmental conditions. clam Meretrix lusoria in Ariake Sound and Tokyo Bay in
All five stages of gametogenesis were observed in Japan [31]. In tropical waters, the change of water
L. rhynchaena over the period of sampling. The presence temperature influences the spawning of clam species
of gonads in the developing, ripe and spawning stages [5,27]. According to Bantoto and Ilano (2011) [5], the
during most months of the year may suggest that increase and decrease of temperature over the seasons
gametogenesis, maturity and spawning of L. rhynchaena could have triggered spawning events they observed in
occur throughout the year. We observed three peaks of L. rhynchaena in the Philippines. An increase of 5°C of
the spawning stage in female clams in September (2017), water temperature, from 27°C in January to 32°C in June,
January (2018) and April (2018). The highest spawning could have triggered the spawning of the clam which
stage peak (46.67%) was in April (2018), which was peaked in June. Similarly, the decrease of 3.1°C from
followed by a very high percentage (57.14%) of spent 32°C in June to 28.9°C in December might make it
clams in May (2018), revealing a key spawning event. In possible for gonads to mature, resulting in another
January (2018), we have also observed a high percentage spawning peak in January. The study results of Hwang
of both spawning and spent clams (33.33% and 11.11%, (2007) [27] showed that both the pearl oysters Pinctada
respectively), but there were not any clams in the spent fucata and Pinctada margaritifera exhibited different
stage in the subsequent month. In September (2017), annual cyclical patterns, in which maturity peaked in
we have observed a similar trend of gametogenesis May and October for P. fucata, and in July and November732 Do Manh Hao et al.
for P. margaritifera. Spawning peaks of P. fucata were [4] Pham T. The snout otter clam, Lutraria rhynchaena Jonas,
synchronised with rising and decreasing temperatures in 1844: an economically important marine species in Hai Phong-
May and October. In the current study, L. rhynchaena Quang Ninh. Ha Noi, Vietnam: Agriculture Publisher; 2008
(in Vietnamese).
had three spawning peaks in April, September and
[5] Bantoto V, Ilano A. The reproductive biology of Lutraria
January, with the highest peak in April. With respect to philippinarum (Veneroida: Mactridae) and its fishery in the
temperatures, only the spawning peak in January is Philippins. Int J Trop Biol. 2012;60(4):1807–18.
synchronised with the “critical” temperature, the lowest [6] Duc NX. Some results on the ecological characteristics of
one; the two remaining spawning peaks occurred during Lutraria rhynchaena (Jonas, 1844). Collection of Works on
Marine Environment and Resources. Ha Noi, Vietnam:
rising and decreasing temperature events. However,
Science and Technology Publisher; 1990. p. 132–5
April and October are transition months of the northern (in Vietnamese).
monsoon and southwest’s wind. The northern monsoon [7] Thang HD. Initial results of hatchery study for artificial seed
lasts from November to March, and the southwest’s production of Lutraria rhynchaena Jonas, 1844. J Fishery.
wind lasts from May to September. During the northern 2004;6:19–23 (in Vietnamese).
[8] Cochrane KevernL. A fishery manager’s guidebook – manage-
monsoon, the climate is cold with less rain, but during
ment measures and their application. Rome: FAO; 2002
periods with southwesterly winds, the climate is hot
(electronic document).
and rains heavily. Seasonal temperature changes likely [9] Lovatelli Alessandro. Site selection for mollusc culture.
trigger maturation and spawning of L. rhynchaena in Thailand: FAO; 1988 (electronic document).
Cat Ba-Ha Long Bay. For the sustainable management [10] Galehouse J. Sedimentation analysis. In: Carver RE, editor.
of the clam resource in Cat Ba-Ha Long Bay, the fishery Procedures in sedimentary petrology. New York: Wiley-
Interscience; 1971.
authorities can issue a ban on harvest of the clam in
[11] Folk RL, Ward WC. Brazos River Bar: a study in the significance
spawning peak months in January, April and September. of grain size parameters. J Sediment Rocks. 1957;27(1):3–26.
[12] Folk RL. Petrology of sedimentary rocks. Austin, Texas:
Acknowledgments: This research was funded by the Hemphill Publishing Company; 1980.
Vietnam National Foundation for Science and [13] Udden JA. Mechanical composition of clastic sediments. Bull
Technology Development (NAFOSTED) under grant Geol Soc Am. 1914;25:655–744.
[14] Wentworth CK. A scale of grade and class terms for clastic
number 106-NN.05-2015.75 and the Vietnam Academy
sediments. J Geol. 1922;30(5):377–92.
of Science and Technology (Project no. VAST06.03/17- [15] Blott SJ, Pye K. GRADISTAT: a grain size distribution and
18). The authors are grateful to MSc. Nguyen Mai Luu statistics package for the analysis of unconsolidated sedi-
(IMER, VAST) for grain-size analysis of sediment ments. Earth Surf Proc Landform. 2001;26:1237–48.
samples. [16] Cross ME, Lynch S, Whitaker A, O’Riordan RM, Culloty SC. The
reproductive biology of the soft-shell clam, Mya arenaria,
in Ireland and the possible impacts of climate variability.
Conflict of interest: The authors state no conflict of J Marine Biol. 2012;2012:908163.
interest. [17] Kunitzer A, Basford D, Craeymeersch TA, Dewarumez JM,
Döryes T, Duineveld GCA, et al. The benthic infauna of the
Data availability statement: All data generated or North Sea: species distribution and assemblages. ICES J
analyzed during this study are included in this pub- Marine Sci. 1992;49:127–43.
[18] Seiderer LT, Newell RC. Analysis of the relationship between
lished article.
sediment composition and benthic community structure in
coastal deposit: implications for marine aggregate dredging.
ICES J Marine Sci. 1999;56:757–65.
[19] Glockzin M, Zettle ML. Spatial macrozoobenthic distribution
patterns in relation to major environmental factors – a case
References study from the Pomeranian Bay (southern Baltic Sea). J Sea
Res. 2008;59(3):144–61.
[1] Verrmeulen JJ, Anker K. Outstanding global values in geology [20] Gerasimova AV, Martynev FM, Filippova NA, Maximovich NV.
and environment in Cat Ba archipelago and Ha Long bay. Growth of Mya arenaria L. at the northern edge of the
Proceedings of the Biodiversity Conservation Solutions in Ha range: heterogeneity of soft-shell clam growth characteristics
Long bay and Cat Ba archipelago. IUCN Vietnam. 2017; in the White Sea. Helgoland Marine Res. 2016;70(6):1–14.
p. 16–23. [21] Ampili M, Shiny Sreedhar K. Hydrological and sediment
[2] Quinn JA, Woodward SL. Earth’s landscape: an encyclopedia of parameters affecting the distribution of the venerid clam,
the world’s geographic features. USA: ABC-CLIO, LLC; 2015. Paphia malabarica in two estuaries. Int J Sci Res Publ.
[3] Thung DC, Ngai ND, Thao DV, Sinh NV, Dong DM. Marine 2016;6(3):15–30.
biodiversity in Ha Long Bay and Cat Ba archipelago. Vietnam J [22] Delgado MJ, Pérez-Larruscain, Gairín JI. Broodstock condi-
Marine Sci Technol. 2019;19:363–9. tioning and gonadal development of the smooth clam CallistaDistribution and density of Lutraria rhynchaena Jonas, 1844 in Cat Ba-Ha Long Bay, Vietnam 733
chione (Linnaeus, 1758) (Mollusca: Bivalvia) on the Calatan [30] Brousseau DJ. Spawning cycle, fecundity, and recruitment in a
coast (NE Spain). Acta Adriat. 2016;57(1):93–106. population of soft-shell clam, Mya arenaria, from Cape Ann,
[23] Sowa A, Krodkiewska M, Halabowski D, Lewin I. Response of Massachusetts. Fishery Bull. 1978;76(1):155–66.
the mollusc communities to environmental factors along an [31] Nakamura Y, Nakano T, Yurimoto T, Maeno Y, Koizumi T,
anthropogenic salinity gradient. Sci Nat. 2019;106:60. Tamaki A. Reproductive cycle of the venerid clam Meretrix
doi: 10.1007/s00114-019-1655-4. lusoria in Ariake Sound and Tokyo Bay, Japan. Fisheries Sci.
[24] Abraham BJ, Dillon PL. Special profiles: life histories and 2010;76(6):931–41.
environmental requirements of coastal fisheries and inverte- [32] Nelson TC. On the distribution of critical temperatures for
brates (Gulf of Mexico). Biol Rep. 1986;82(11.68):1–18. spawning and for ciliary activity in bivalve molluscs. Science.
[25] Seitz RD, Lipcius RN, Hines AH, Eggleston DB. Density- 1928;67(1730):220–1.
dependent predation, habitat variation, and the persistence of [33] Carie JB, William AL. The effects of seasonal temperature and
marine bivalve prey. Ecology. 2001;82(9):2435–51. photoperiod manipulation on reproduction in the eastern
[26] Porter RG. Reproductive cycle of the soft-shell clam, Mya Elliptio Elliptio complanata. J Shellfish Res. 2019;38(2):379–84.
arenaria, at Skagit Bay, Washington. Fishery Bull. [34] Lassoued M, Damak W, Chaffai A. Reproductive cycle of the
1974;72(3):648–56. pearl oyster, Pinctada radiata (Mollusca: Pteridae), in the
[27] Hwang J-J. Reproductive cycles of the pearl oysters, Pinctada Zarat site (Gulf of Gabès, Tunisia). Euro-Mediterr J Environ
fucata (Gould) and Pinctada margaritifera (Linnaeus) Integr. 2018;3:18.
(Bivalvia: Pteriidae) in southwestern Taiwan waters. J Marine [35] Ernesto A-D, Apolinar S-M, Manuel G-U, Andrés MG-G.
Sci Technol. 2007;15(2):67–75. Reproduction of Megapitaria squalida (Bivalvia: Veneridae) in
[28] Bauer G. Reproductive stragy of the freshwater Pearl the Southeast Gulf of California, Mexico. Rev Biol Trop.
Mussel Margaritifera margaritifera. J Anim Ecol. 2017;65(3):881–9.
1987;56(2):691–704. [36] Béjaoni JM, Kefi FJ, Lassoued A, Menif NTE. Relative growth
[29] Suja N, Muthiah P. The reproductive biology of the baby clam, and reproductive cycle of the hermaphroditic Cardites
Marcia optima, from two geographically seperated areas of antiquatus (Mollusca: Bivalvia) collected from the Bizerte
India. Aquaculture. 2007;273:700–10. channel (northern Tunisia). Biologia. 2017;72(10):1171–80.734
Appendix
Table A1: t- and p-values between each pair of monthly temperature based on monitoring result in Cat Ba-Ha Long Bay during 2017–2018 using t-test (α = 0.01)
Aug-17 Sep-17 Oct-17 Nov-17 Dec-17 Jan-18 Feb-18 Mar-18 Apr-18 May-18 Jun-18 Jul-18
Aug-17
Sep-17 14/5 × 10−10
Oct-17 17/5 × 10−11 8/2 × 10−06
Do Manh Hao et al.
Nov-17 41/8 × 10−17 33/2 × 10−15 38/3 × 10−16
Dec-17 120/9 × 10−24 81/3 × 10−21 85/1 × 10−21 26/6 × 10−14
Jan-18 82/3 × 10−21 74/1 × 10−20 71/2 × 10−20 33/2 × 10−15 5/2 × 10−04
Feb-18 127/4 × 10−24 103/8 × 10−23 58/4 × 10−19 17/5 × 10−11 −3/5 × 10−03 −5/10 × 10−05
Mar-18 46/1 × 10−17 43/4 × 10−17 31/4 × 10−15 7/3 × 10−06 −10/3 × 10−08 −14/5 × 10−10 −10/4 × 10−08
Apr-18 47/1 × 10−17 40/1 × 10−16 32/4 × 10−15 −6/5 × 10−05 −43/4 × 10−17 −60/3 × 10−19 −31/6 × 10−15 −24/2 × 10−13
May-18 10/6 × 10−08 2/4 × 10−02 −2/4 × 10−02 −20/2 × 10−12 −43/4 × 10−17 −37/4 × 10−16 −52/3 × 10−18 −25/1 × 10−13 −19/6 × 10−12
Jun-18 −10/6 × 10−08 −21/2 × 10−12 −24/3 × 10−13 −58/4 × 10−19 −137/1 × 10−24 −154/2 × 10−25 −100/1 × 10−22 −65/8 × 10−20 −82/2 × 10−21 −13/2 × 10−09
Jul-18 −22/8 × 10−13 −27/3 × 10−14 −66/8 × 10−20 −72/2 × 10−20 −125/5 × 10−24 −99/2 × 10−22 −76/8 × 10−21 −46/2 × 10−17 −54/2 × 10−18 −19/5 × 10−12 −9/1 × 10−07
Table A2: t- and p-values between each pair of monthly salinity based on the monitoring result in Cat Ba-Ha Long Bay during 2017–2018 using t-test (α = 0.01)
Aug-17 Sep-17 Oct-17 Nov-17 Dec-17 Jan-18 Feb-18 Mar-18 Apr-18 May-18 Jun-18 Jul-18
Aug-17
Sep-17 −20/3 × 10−12
Oct-17 −21/1 × 10−12 −11/1 × 10−08
Nov-17 −23/4 × 10−13 −14/7 × 10−10 −11/2 × 10−08
Dec-17 −19/9 × 10−12 −11/1 × 10−08 −9/2 × 10−07 −2/2 × 10−02
Jan-18 −16/6 × 10−11 −10/4 × 10−08 −8/2 × 10−06 −2/1 × 10−01 0/8 × 10−01
Feb-18 −16/8 × 10−11 −10/4 × 10−08 −8/1 × 10−06 −4/3 × 10−03 −4/2 × 10−03 −4/7 × 10−04
Mar-18 −20/4 × 10−12 −12/5 × 10−09 −10/8 × 10−08 4/2 × 10−02 1/6 × 10−01 0/9 × 10−01 4/1 × 10−03
Apr-18 −26/8 × 10−14 −14/6 × 10−10 −7/8 × 10−06 −7/2 × 10−03 4/5 × 10−04 3/4 × 10−03 5/1 × 10−04 5/3 × 10−04
May-18 −31/4 × 10−15 −11/1 × 10−08 2/3 × 10−02 9/2 × 10−07 8/9 × 10−07 7/5 × 10−06 8/1 × 10−06 9/4 × 10−07 11/2 × 10−08
Jun-18 −5/1 × 10−04 4/2 × 10−03 27/5 × 10−14 33/2 × 10−15 24/3 × 10−13 21/1 × 10−12 18/1 × 10−11 27/5 × 10−14 19/5 × 10−12 10/5 × 10−08
Jul-18 5/3 × 10−04 19/6 × 10−12 26/8 × 10−14 25/1 × 10−13 20/2 × 10−12 18/2 × 10−11 17/4 × 10−11 21/1 × 10−12 26/9 × 10−14 25/1 × 10−13 8/2 × 10−06You can also read