Diversity, Abundance and Distribution of Birds in Tāmaki Makaurau / Auckland 2009-2019. State of the Environment Reporting
←
→
Page content transcription
If your browser does not render page correctly, please read the page content below
Diversity, Abundance and Distribution of Birds in
Tāmaki Makaurau / Auckland 2009-2019. State of the
Environment Reporting
Todd J. Landers, Hamish Allen, Craig D. Bishop, Georgianne J. K.
Griffiths, Jade Khin, Grant Lawrence and Miriam R. Ludbrook
February 2021                              Technical Report 2021/08

Diversity, abundance and distribution of birds in
Tāmaki Makaurau / Auckland 2009-2019. State of the
environment reporting
February 2021                                      Technical Report 2021/08

Todd J. Landers*
Hamish Allen*
Craig D. Bishop**
Georgianne J. K. Griffiths*
Jade Khin*
Grant Lawrence*
Miriam R. Ludbrook*

*Auckland Council, Research and Evaluation Unit (RIMU)
**AUT – Auckland University of Technology

Auckland Council
Technical Report 2021/08

ISSN 2230-4525 (Print)
ISSN 2230-4533 (Online)

ISBN 978-1-99-002298-2 (Print)
ISBN 978-1-99-002299-9 (PDF)

This report has been peer reviewed by the Peer Review Panel.

   Review completed on 5 February 2021
   Reviewed by three reviewers

   Approved for Auckland Council publication by:

   Name: Eva McLaren

   Position: Manager, Research and Evaluation (RIMU)

   Name: Megan Carbines

   Position: Manager, Air, Land and Biodiversity (RIMU)

   Date: 5 February 2021

Recommended citation
Landers, T. J., H. Allen, C. D. Bishop, G. J. K. Griffiths, J. Khin, G. Lawrence and M. R.
Ludbrook (2021). Diversity, abundance and distribution of birds in Tāmaki Makaurau /
Auckland 2009-2019. State of the environment reporting. Auckland Council technical
report, TR2021/08

© 2021 Auckland Council

Auckland Council disclaims any liability whatsoever in connection with any action taken in
reliance of this document for any error, deficiency, flaw or omission contained in it.

This document is licensed for re-use under the Creative Commons Attribution 4.0
International licence.
In summary, you are free to copy, distribute and adapt the material, as long as you
attribute it to the Auckland Council and abide by the other licence terms.
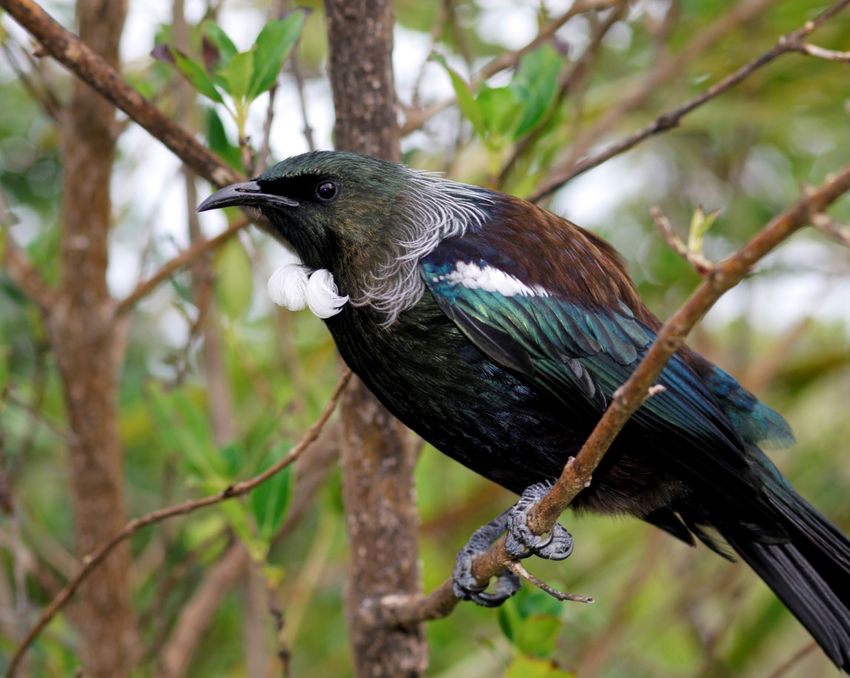
Executive summary

Auckland Council collects a variety of bird data across Auckland as part of its regional Bird
Monitoring Programme (BMP), which contributes to reporting on the State of Environment
for Auckland, as well as contributing to other environmental reporting obligations. Birds are
useful indicators for evaluating biodiversity and are commonly surveyed in New Zealand
using the standard five-minute bird count method, which is the basis of the ten-minute bird
count method used in this study. This report details the results from the two major land bird
programmes in the BMP, each of which takes five years to survey a full rotation: forest (2009-
2018) and wetlands (2011-2019).

The majority of birds counted in forest (70%) and wetlands (55%) were indigenous species.
Four of the top five bird species counted in forest were indigenous whereas in wetlands,
only two of the top five species were indigenous. Tūī (Prosthemadera novaeseelandiae
novaeseelandiae) was the most commonly counted species at forest sites, followed by
silvereye (Zosterops lateralis lateralis), grey warbler (Gerygone igata), North Island fantail
(Rhipidura fuliginosa placabilis) and Eurasian blackbird (Turdus merula), all detected in >50
per cent of counts. Silvereye was the most commonly counted species at wetland sites,
followed by common myna (Acridotheres tristis), grey warbler, European goldfinch
(Carduelis carduelis) and house sparrow (Passer domesticus), all detected in >30 per cent
of counts.

Species richness (i.e. diversity) and abundance varied significantly across the region when
looking at different Land Classes, ecological districts, large sub-regional areas, and highly
managed areas. Sites that were mostly indigenous ecosystems and/or were near large
forested areas (Hunua and Waitākere Ranges, Aotea/Great Barrier Island [Aotea] and Te
Hauturu-o-Toi/Little Barrier Island [Hauturu]), had the highest indigenous dominance (mean
proportion indigenous species of total species), whereas sites in urban and rural areas had
the lowest percentages. The highest percentages of indigenous birds were found at well-
protected or highly managed forest areas, both on offshore islands and in mainland
sanctuaries. Hauturu had the highest percentage where almost all birds counted were
indigenous, followed by Glenfern and Windy Hill on Aotea, and the Kōkako Management
Area in the Hunua Ranges, where on average ~90 per cent of individual birds counted were
indigenous. This shows the high value of these sites as reserves for indigenous birds. No
differences were detected between the two completed wetland rotations over this study
(Note: forest rotations were not compared; see Methods). Overall, the numbers of introduced
species varied more than indigenous species, which generally explained the variation seen
in indigenous dominance across the region.
This study identified the importance of large-forested and highly managed areas in the
region, and hence the value of these for maintaining high proportions of indigenous species,

Diversity, abundance and distribution of birds in Tāmaki Makaurau / Auckland 2009-2019       i
which in turn contribute to ecological integrity in these areas. These places also function as
important sources of indigenous birds, which can spill over into neighbouring areas as more
of these are restored. Future completed full rotations in the regional BMP will allow longer-
term trends to be assessed so that we can track if bird populations are stable, improving or
decreasing, and thus adjust management actions accordingly.

Diversity, abundance and distribution of birds in Tāmaki Makaurau / Auckland 2009-2019       ii
Table of contents

   List of acronyms and abbreviations ................................................................................ vi
1.0 Introduction.................................................................................................................. 1
   1.1          Regional Bird Monitoring Programme ................................................................ 2
   1.2          Report purpose and scope ................................................................................. 3
2.0 Methods....................................................................................................................... 5
   2.1          Study area.......................................................................................................... 5
   2.2          Bird surveys ....................................................................................................... 7
   2.3          Analyses ............................................................................................................ 8
3.0 Results ...................................................................................................................... 11
   3.1          Forest birds ...................................................................................................... 11
   3.2          Wetland birds ................................................................................................... 37
4.0 Discussion ................................................................................................................. 50
   4.1          Limits of this study ........................................................................................... 50
   4.2          Forest birds ...................................................................................................... 50
   4.3          Wetland birds ................................................................................................... 52
   4.4          Forest and wetland birds – overall findings ...................................................... 53
5.0 Summary ................................................................................................................... 55
6.0 Acknowledgements ................................................................................................... 57
7.0 References ................................................................................................................ 58
Appendix A             Post-hoc comparisons .............................................................................. 64

List of figures

Figure 1: Regional Bird Monitoring Programme forest and wetland sites showing major
spatial categories used in analyses (e.g. tiers, ecological districts, Areas). ......................... 6
Figure 2: Mean Indigenous Dominance (Species Richness), Indigenous and Introduced
Species Richness for birds counted at Tier 1 (regional) forest sites by Land Class and
Rotation. Bars = Standard Error. Overall ANOVA: ***p
Figure 6: Mean Indigenous Dominance (Species Richness), Indigenous and Introduced
Species Richness for birds counted at forest sites by Tier 2 Area and Rotation. Bars =
Standard Error. Overall ANOVA: *p
Table 10: Post-hoc comparisons using Tukey HSD test of Mean Introduced Species
Abundance for birds counted at Tier 1 (regional) forest sites by Land Class. .................... 18
Table 11: Post-hoc comparisons using Tukey HSD test of Mean Indigenous Dominance
(Species Richness) for birds counted at Tier 1 (regional) forest sites by ecological district. .... 20
Table 12: Post-hoc comparisons using Tukey HSD test of Mean Introduced Species
Richness for birds counted at Tier 1 (regional) forest sites by ecological district. .............. 20
Table 13: Post-hoc comparisons using Tukey HSD test of Mean Indigenous Dominance
(Species Abundance) for birds counted at Tier 1 (regional) forest sites by ecological
district. ............................................................................................................................... 23
Table 14: Post-hoc comparisons using Tukey HSD test of Mean Introduced Species
Abundance for birds counted at Tier 1 (regional) forest sites by ecological district............ 23
Table 15: Post-hoc comparisons using Tukey HSD test of Mean Indigenous Dominance
(Species Richness) for birds counted at forest sites by Tier 2 Area. .................................. 26
Table 16: Post-hoc comparisons using Tukey HSD test of Mean Indigenous Species
Richness for birds counted at forest sites by Tier 2 Area. .................................................. 26
Table 17: Post-hoc comparisons using Tukey HSD test of Mean Introduced Species
Richness for birds counted at forest sites by Tier 2 Area. .................................................. 26
Table 18: Post-hoc comparisons using Tukey HSD test of Mean Indigenous Dominance
(Species Richness) for birds counted at forest sites by Tier 2 Area. .................................. 29
Table 19: Post-hoc comparisons using Tukey HSD test of Mean Introduced Species
Richness for birds counted at forest sites by Tier 2 Area. .................................................. 29
Table 20: Post-hoc comparisons of mean ranks of all pairs of Mean Indigenous
Dominance (Species Richness) for birds counted at forest sites by Tier 3 Area................ 32
Table 21: Post-hoc comparisons of mean ranks of all pairs of Mean Indigenous Species
Richness of birds counted at forest sites by Tier 3 Area. ................................................... 32
Table 22: Post-hoc comparisons of mean ranks of all pairs of Mean Introduced Species
Richness of birds counted at forest sites by Tier 3 Area. ................................................... 33
Table 23: Post-hoc comparisons of mean ranks of all pairs of Mean Indigenous
Dominance (Species Abundance) for birds counted at forest sites by Tier 3 Area. ........... 35
Table 24: Post-hoc comparisons of mean ranks of all pairs of Mean Indigenous Species
Abundance of birds counted at forest sites by Tier 3 Area................................................. 35
Table 25: Post-hoc comparisons of mean ranks of all pairs of Mean Introduced Species
Richness of birds counted at forest sites by Tier 3 Area. ................................................... 36
Table 26: Status of species counted at 187 wetland sites (913 total bird counts from 2011-
19) in the Auckland region. ................................................................................................ 37
Table 27: Conservation status (Robertson et al. 2017) of indigenous species counted at
wetland sites (913 total bird counts from 2011-19) in the Auckland region. ....................... 37
Table 28: Mean Species Abundance and Probability of Detection of all bird species
counted (913 total bird counts from 2011-19) at wetland sites in Auckland; *indigenous;
**endemic. ......................................................................................................................... 38
Table 29: Post-hoc comparisons using Tukey HSD test of Mean Indigenous Dominance
(Species Richness) for birds counted at wetland sites by Land Class and Rotation (R1 =
Rotation 1; R2 = Rotation 2). ............................................................................................. 42
Table 30: Post-hoc comparisons using Tukey HSD test of Mean Introduced Species
Richness for birds counted at wetland sites by Land Class and Rotation (R1 = Rotation 1;
R2 = Rotation 2)................................................................................................................. 42

Diversity, abundance and distribution of birds in Tāmaki Makaurau / Auckland 2009-2019                                                    v
Table 31: Post-hoc comparisons using Tukey HSD test of Mean Indigenous Dominance
(Species Abundance) for birds counted at wetland sites by Land Class and Rotation (R1 =
Rotation 1; R2 = Rotation 2). ............................................................................................. 45
Table 32: Post-hoc comparisons using Tukey HSD test of Mean Indigenous Species
Abundance for birds counted at wetland sites by Land Class and Rotation (R1 = Rotation
1; R2 = Rotation 2)............................................................................................................. 45
Table 33: Post-hoc comparisons using Tukey HSD test of Mean Introduced Species
Abundance for birds counted at wetland sites by Land Class and Rotation (R1 = Rotation
1; R2 = Rotation 2)............................................................................................................. 46

List of acronyms and abbreviations
10MBC           10-minute bird count
5MBC            First five minutes of 10MBC
ANOVA           Analysis of variance
Aotea           Aotea/Great Barrier Island
ARC             Auckland Regional Council
BMP             Bird Monitoring Programme
CBP             Coastal Bird Programme
DOC             Department of Conservation
ED              Ecological district
Hauturu         Te Hauturu-o-Toi/Little Barrier Island
MUL             Auckland Council Metropolitan Urban Limit
KMA             Kōkako Management Area
SSMRP           Seabird and Shorebird Monitoring and Research Programme
TBMP            Terrestrial Biodiversity Monitoring Programme

Diversity, abundance and distribution of birds in Tāmaki Makaurau / Auckland 2009-2019                                           vi
1.0 Introduction

The land area of Tāmaki Makaurau / the Auckland region comprises ~4520km2 on the
mainland and ~500km2 on the Hauraki Gulf islands. The region encompasses a
diverse range of natural ecosystems and habitats comprising forest, scrub and
shrubland vegetation (hereafter collectively referred to as ‘forest’) from sea level to
over 700m, along with freshwater wetlands, lakes, rivers, salt marshes, estuaries and
duneland ecosystems in lowland and coastal areas (Auckland Council 2015).
Indigenous forest once covered much of the region, but historical deforestation,
agriculture and growth of New Zealand’s largest urban area (Meurk and Swaffield
2000), mean that today, forest covers less than 30 per cent of the Auckland region
(Singers et al. 2017). On the mainland, existing forests include small urban remnants,
rural forest fragments north and south of the city and large, intact forests in the
Waitākere and Hunua Ranges. Large, contiguous forests also exist on Aotea/Great
Barrier Island (Aotea) and the pristine, pest-animal-free Te Hauturu-o-Toi/Little Barrier
Island (Hauturu). Auckland’s existing freshwater wetland ecosystems comprise a tiny
fragment of their former extent, with just four per cent of the original wetlands remaining
(Lawrence and Bishop 2017). Wetlands are of particular importance given the
biodiversity they support and the variety of resources they provide for people (Barbier
et al. 1997; Zedler and Kercher 2005; Ministry for the Environment 2007; Ministry for
the Environment and Stats NZ 2019).
Auckland’s ecosystems and habitats support a wide variety of biodiversity (Cameron
et al. 2008). Although birds form only a small proportion of total biodiversity, they are
commonly used as indicators for monitoring the status and trends of biodiversity
(Temple and Wiens 1989; Furness and Greenwood 1993; Gill 2006; Monks et al.
2013). In New Zealand, diurnal land birds are useful indicators because they are
usually conspicuous and easy to identify. They are also high in the food chain and thus
may rely on multiple trophic levels below them to survive (MacLeod 2014). People also
tend to have a strong connection with birds and public interest in surveying and
interacting with local birds is very high in New Zealand (Galbraith et al. 2014; Brandt
et al. 2020).
Birds are an important group to monitor given the significant ecological roles they play.
Indigenous birds are well known to be key pollinators and seed dispersers of
indigenous plants (Clout and Hay 1989; Kelly et al. 2010; Young et al. 2012). A classic
example is the kererū, which is the only native bird capable of dispersing the seeds of
some indigenous plants with large fruits. Birds are also important subjects to monitor
given the huge declines that have occurred across the world and in New Zealand, as
a result of anthropogenic effects (Butchart et al. 2010; Waldron et al. 2017; Belder et

Diversity, abundance and distribution of birds in Tāmaki Makaurau / Auckland 2009-2019    1
al. 2018). Almost a third of New Zealand’s original avifauna has become extinct since
  humans arrived (Worthy and Holdaway 2002; Tennyson and Martinson 2006; Innes et
  al. 2010; Robertson et al. 2017). Pressures on birds are also believed to be increasing
  as a result of climate change, which is likely to cause more extreme weather events,
  increased numbers of some pest animals, and various habitat changes (Pearce et al.
  2018; Bishop and Landers 2019; Auckland Council 2020).

1.1     Regional Bird Monitoring Programme

  Auckland Council collects a variety of bird data across Auckland as part of its regional
  Bird Monitoring Programme (BMP), which contributes to reporting on the state of the
  environment for Auckland under the Resource Management Act 1991. The BMP is
  also important for evaluating and reporting on key council plans and strategies, such
  as the Auckland Unitary Plan and Indigenous Biodiversity Strategy (Auckland Council
  2012). It began as part of the Terrestrial Biodiversity Monitoring Programme (TBMP)
  in 2009 when the former Auckland Regional Council (ARC) commenced systematic,
  landscape-scale monitoring of Auckland’s forest assets (hereafter referred to as the
  ‘forest’ programme), which included a variety of vegetation monitoring conducted in
  standard 20m by 20m plots (Allen 1993; Hurst and Allen 2007; McNutt 2012), as well
  as pest animal and bird monitoring. In 2010 the TBMP, including the BMP, was
  transferred to the newly formed Auckland Council and subsequently expanded in 2010
  to include additional plot-based vegetation monitoring of wetlands across the region
  (hereafter referred to as the ‘wetland’ programme), including bird count-based
  monitoring, which was added from 2011.

  The BMP has had some additions over time, with the largest change being the
  establishment of a Coastal Bird Programme (CBP). The CBP formed out of a number
  of seabird research and monitoring projects that have occurred over the last decade,
  which have primarily focussed on collaborative work with the University of Auckland,
  Auckland Museum, the Department of Conservation (DOC) and other seabird groups
  and researchers (e.g. Northern New Zealand Seabird Trust) on Hauraki Gulf/Tīkapa
  Moana seabirds (Rayner et al. 2013; Ismar et al. 2014; Dunphy et al. 2015; Mischler
  et al. 2015; Rayner et al. 2015; Ranjard et al. 2016; Zhang et al. 2017; Zhang et al.
  2019; Dunphy et al. 2020). More recently, mainland seabird projects have been
  established, including some key seabird survey work on the Waitākere Ranges coast,
  which has led to a number of seabird and shorebird projects there (Landers 2017). In
  2018, a comprehensive regional seabird and shorebird programme was approved as
  part of the new Natural Environment Targeted Rate, called the Seabird and Shorebird
  Monitoring and Research Programme (SSMRP). The SSMRP began late in 2018, with

  Diversity, abundance and distribution of birds in Tāmaki Makaurau / Auckland 2009-2019   2
the first major field surveys conducted in 2019 (results from the SSMRP will be reported
  in a future technical report). A Dune Monitoring Programme is also being developed,
  which has thus far focussed on plant surveys; however, Auckland Council is currently
  investigating the inclusion of dune bird monitoring in this programme.

  Auckland Council conducts other bird monitoring in the region, most of which is either
  species-specific or site-based, implemented to address specific local questions;
  however, that information is not included in this report as the focus here is to provide
  a comprehensive regional picture of the state of birds across the Auckland region.

1.2     Report purpose and scope

  The purpose of this report is to assess the current status of land birds in Auckland
  using the regional bird data currently available from the Auckland Council’s regional
  BMP. We have elected to use only the BMP data, as this is the most comprehensive
  dataset available that provides systematic coverage across the majority of the
  Auckland region. Although there are other sources of bird data (e.g. eBird, iNaturalist
  and other site-specific projects), the BMP not only provides the comprehensive
  coverage required for state of environment reporting (MacLeod 2014), but it has also
  been collected by relatively few observers, all of whom are experts, and uses standard
  protocols. Observer experience and methodological consistency helps to ensure high
  quality data. The two major components of the BMP, forest and wetland birds, are the
  focus of this report. We plan to include additional environments (i.e. coastal and dune
  birds) in future reports when sufficient information has been collected. Given the limited
  time series so far, no trends are reported (see Methods).

  This report’s spatial focus is on both large-scale sub-regional areas and smaller areas
  of interest in Auckland (i.e. large forested and urban areas, and sites that are highly
  protected or have high levels of pest management; see Methods). For the largest-scale
  analyses we used the following broad ‘Land Class’ categories, which we calculated
  using combinations of Landcover database (LCDB) categories (Landcare Research
  2020) (see Methods): Indigenous, Mixed, Rural and Urban. To investigate how birds
  varied in ecologically similar areas, we used the existing Auckland region ecological
  districts (EDs), which were defined by McEwen (1987), with some minor changes since
  then (Brook 1996; Lux and Beadel 2006). The region contains a mix of geographically
  and topographically diverse features that are quite distinct and these differences are
  adequately captured by the ED framework. There is also a wide variation in
  development pressures in different parts of the region, which are also captured to some
  extent by the ED framework. We also investigated using the national ecosystem

  Diversity, abundance and distribution of birds in Tāmaki Makaurau / Auckland 2009-2019   3
classification system developed by DOC (Singers and Rogers 2014), however, since
our programme was designed to monitor at the regional and ED scale, more work is
required to determine the applicability of reporting on ecosystems due to issues with
levels of replication and representation. The usefulness of this approach, and possible
modifications required to the monitoring programme, will be the subject of a
subsequent report.

Diversity, abundance and distribution of birds in Tāmaki Makaurau / Auckland 2009-2019   4
2.0 Methods
2.1 Study area
Both the forest and wetland components of the BMP include sites dispersed across
the Auckland region, established using a grid-based approach as described below
(Figure 1). Both programmes take five years to sample the full set of sites (i.e. ~1/5 of
each programme is sampled each year), and thus at the time of writing this report there
were two complete rotations for the majority of sites for each programme as shown in
Table 1 (the exception was for wetlands which had no bird counts conducted the first
year in 2010). The forest programme sites are all surveyed in established forest, scrub,
and shrubland vegetation across the region based on the national 8km x 8km grid used
by both the DOC and Ministry for the Environment. Several spatial scales were used
to allow adequate replication and statistical power to enable reporting on important
areas of Auckland, with details of this ‘tiered’ approach shown in Table 2. Forest sites
were surveyed from late October to December (with the following exceptions: Hauturu
had four of the 15 Rotation 1 sites surveyed in late March and all of the seven Rotation
2 sites in February; Tāwharanui had six of the 19 Rotation 1 sites surveyed in March).
A large number of sites in Rotation 2 were not re-surveyed as planned because of staff
and funding shortages.
Table 1: Bird monitoring by programme showing the five-year Rotation time period.
Programme Rotation Rotation time period
Forest 1 2009-2013
2 2014-2018
Wetlands 1 2011-2014
2 2015-2019
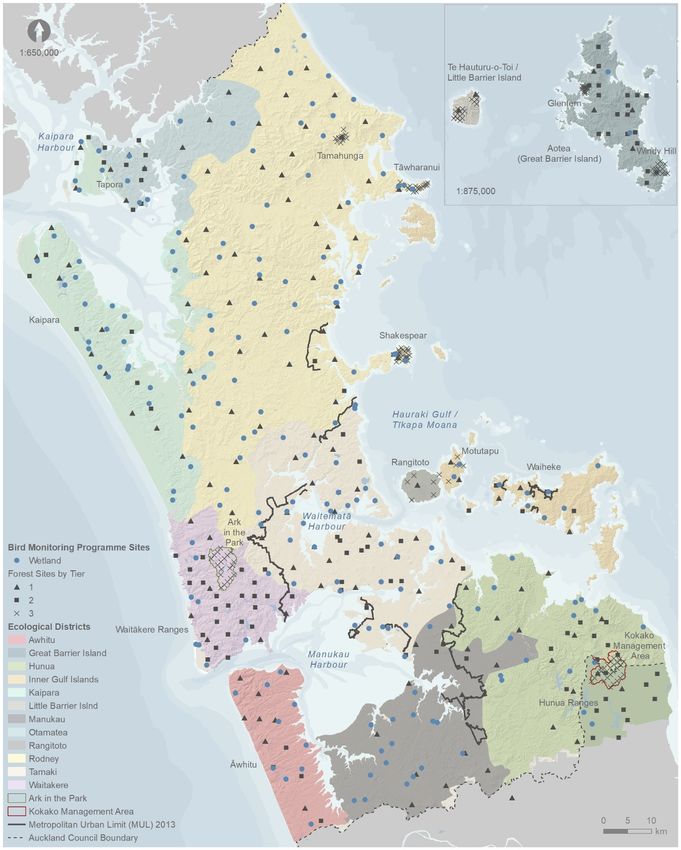
Diversity, abundance and distribution of birds in Tāmaki Makaurau / Auckland 2009-2019 5Figure 1: Regional Bird Monitoring Programme forest and wetland sites showing major spatial categories used in analyses (e.g. tiers, ecological districts, Areas). Diversity, abundance and distribution of birds in Tāmaki Makaurau / Auckland 2009-2019 6
Table 2: Forest programme tier structure. All Tier 1-3 sites are confined to forest,
  scrub or shrubland vegetation types.

           Spatial Number of plots with  Location details (including ‘Areas’ used in
      Tier grid    bird counts           analyses)
           size    Rotation 1 Rotation 2
            4km x
       1                    118               50         Comprehensive regional coverage
            4km
                                                         Site specific coverage of important ‘Areas’ of
                                                         Auckland for ecological and/or public interest
            2km x
       2                     91               45         reasons: Aotea, Urban Auckland (MUL* based),
            2km
                                                         Āwhitu, Hunua Ranges, South Kaipara, Tapora,
                                                         Waiheke Island, Waitākere Ranges

                                                         Site specific coverage of important ‘Areas’ of
                                                         Auckland that have high management
            Various
                                                         interventions: Ark in the Park, Glenfern, Kōkako
            (mostly
       3                    104               83         Management Area, Hauturu, Motutapu Island,
            500-
                                                         Rangitoto Island, Shakespear Regional Park
            700m)
                                                         (Rotation 2 only), Tamahunga, Tāwharanui
                                                         Regional Park, Windy Hill

                                                         The total individual sites used in the ‘Total species
            Totals:         313              178         summary’ (3.1.1) totalled 400, given this included
                                                         additional, new sites added to Rotation 2

  *MUL = Auckland Council Metropolitan Urban Limit.

  The regional BMP contains 187 sites in wetlands across the region using a 4km x 4km
  grid (again, based on the national 8km x 8km grid). Grids that met the criteria for
  sampling contained a freshwater or brackish wetland system within the grid square that
  was large enough to accommodate a 15m x 15m vegetation plot, in which bird surveys
  were conducted, as described below. All wetland sites generally have been surveyed
  in March, however, in some years this varied slightly, with some sites surveyed in early
  April.

2.2        Bird surveys

  Birds were surveyed at all sites by conducting three 10-minute bird counts (10MBCs).
  These were always conducted on the same day for a given rotation (i.e. Rotation 1 or
  Rotation 2). The three counts were carried out between the first hour after sunrise and

  Diversity, abundance and distribution of birds in Tāmaki Makaurau / Auckland 2009-2019                     7
before 13:00 hours, with at least one hour in between each count, and where each count began after two minutes of silence. The first five minutes of each 10MBC closely follows the standard ‘five-minute’ bird count methodology commonly used in New Zealand bird surveys (Dawson and Bull 1975; Elliott et al. 2010; Hartley 2012; MacLeod et al. 2012; Miskelly 2018; Fitzgerald et al. 2019) where all birds heard and seen are noted over a five minute period. During the second five minutes of the 10MBC, only new species not detected in the first five minutes are recorded. This provides extra time for assessing species richness at that site. All birds were included in counts regardless of their distance from the observer. Given that wind and rain can affect bird count results (Dawson and Bull 1975; Aubert 2016), counts were only performed in ideal weather (a judgement call made by the observers at the site on the day of the survey). 2.3 Analyses Three main dependent variables were used for the majority of analyses in this study: Indigenous Dominance (proportion of indigenous species of total species counted), Indigenous (indigenous species only) and Introduced (introduced species only). These three variables can be calculated in two ways, from abundance data (mean number of individual birds per count) and from richness data (mean number of species per count). Hence, a total of six main variables was calculated for all analyses (listed in Table 3). Abundance variables were calculated using the first five minutes of the 10MBC (hereafter called 5MBC) and richness variables using the full 10MBC. All variables are means per count, calculated by averaging the totals from each of the three bird counts conducted at each plot on the same day. In the ‘Total species summary’ sections (3.1.1, 3.2.1), full species lists were calculated for each of the two programmes (forest, wetlands), including the following variables calculated for each species: Mean Species Abundance (mean number of individuals per 5MBC) and Probability of Detection (per cent of 5MBCs that contained the species) (Table 6 and 28). Total Species Richness was also calculated for each programme (forest, wetlands), which is the total number of species from all counts. Diversity, abundance and distribution of birds in Tāmaki Makaurau / Auckland 2009-2019 8
Table 3: List of variables used in analyses.

 Variable group          Variable names                Variable definition
                         Mean Indigenous               Mean percentage of individuals that were
                         Dominance                     indigenous species of the total individuals counted
                         (Species
                         Abundance)
 Abundance               Mean Indigenous   Mean number of individuals that were indigenous
                         Species Abundance species

                         Mean Introduced   Mean number of individuals that were introduced
                         Species Abundance species

                         Mean Indigenous               Mean percentage of indigenous species of total
                         Dominance                     species counted
                         (Species Richness)
 Richness                Mean Indigenous               Mean number of indigenous species
                         Species Richness

                         Mean Introduced               Mean number of introduced species
                         Species Richness

                         Total Species                 Total number of species from all counts
                         Richness

 Total species           Mean Species                  Mean number of individuals per 5MBC for each
 summary                 Abundance                     species detected

                         Probability of                Per cent of 5MBCs that contained the species
                         Detection

Given the very short time period of this study (only two independent measures, each
five years apart), and also that the majority of forest sites were not re-surveyed in
Rotation 2, statistical analyses of forest data were performed only on Rotation 1. Both
Rotations are graphed in all figures for assessing general tendencies but no statistical
analysis for trends was possible.

To analyse for regional scale differences in abundances and species richness we ran
one-way analysis of variance (ANOVA) models for Tier 1 (regional) forest data and
Repeated Measures ANOVA for wetland data (including Rotation as a factor), using
the factors Land Class and ED, all in separate analyses.

Land Class was calculated for each bird count site by summing all LCDB categories in
a 1000m radius and then grouping the results into the following classes:

Diversity, abundance and distribution of birds in Tāmaki Makaurau / Auckland 2009-2019                       9
• Indigenous: >50% coverage of LCDB categories: Broadleaved Indigenous
Hardwoods, Fernland, Flaxland, Herbaceous Freshwater Vegetation,
Herbaceous Saline Vegetation, Indigenous Forest, Mangrove, Manuka and/or
Kanuka, Matagouri or Grey Scrub (Note: matagouri is absent in Auckland);
• Rural: >50% coverage of LCDB categories: Gorse and/or Broom, High
Producing Exotic Grassland, Low Producing Grassland, Mixed Exotic
Shrubland;
• Urban: >50% coverage of LCDB categories: Built-up Area (settlement) or
Transport Infrastructure;
• Mixed: All other LCDB categories.
We also conducted the following one-way ANOVAs for all variables on the forest data
using the following sub-regional Areas: Tier 2 – factor Tier 2 ‘Area’; Tier 3 – factor Tier
3 ‘Area’ (Table 2). Due to low sample sizes and patchy coverage, Tier 1 and 2 sites
were included for all Tier 2 ‘Areas’, except for the Hunua and Waitākere Ranges, which
both had higher sample sizes with sites distributed regularly across the area of interest.
The assumptions for ANOVA (independent observations, normality, homogeneity via
Levene’s Test) were checked for all data and any data failing these were transformed
as required (see Results). If transformation still did not fulfil the ANOVA assumptions,
we analysed those data using the non-parametric Kruskal-Wallis test. For all significant
ANOVAs, post-hoc tests were run to determine which factor pairs were significant
(Tukey HSD tests for ANOVAs and Multiple Comparison Z-Value tests for Kruskal-
Wallis tests).
Only categories that had at least five replicates were included in analyses. All statistical
tests were done in STATISTICA 12 (StatSoft 2014) to assess significance (α < 0.05).
Diversity, abundance and distribution of birds in Tāmaki Makaurau / Auckland 2009-2019 103.0 Results
3.1 Forest birds
3.1.1 Total species summary (Tiers 1-3, Rotations 1 and 2)
A total of 1,452 bird counts was completed at 400 forest (forest, scrub, shrubland
vegetation) sites over the time frame of this study (2009-2018), during which 23,019
individual birds were counted. The majority of these were endemic and indigenous
species, with only about one third of all birds counted being introduced species (Table
4). Only a small percentage (7%) of total birds counted were ‘Threatened’ or ‘At Risk’
species (Table 5) (Robertson et al. 2017). Total Species Richness comprised 64
species, and four out of the five most abundant species were indigenous (i.e. tūī,
silvereye, grey warbler, and North Island fantail – Eurasian blackbird was the 5th most
abundant species), and these occurred in at least 50 per cent of all counts (Table 6).
Table 4: Status of species counted at 400 forest sites (1452 total bird counts
conducted from 2009-18) in the Auckland region.
Status Count Percentage of total birds
Endemic 10,757 46.7%
Indigenous 5,071 22.0%
Introduced 7,191 31.2%
TOTAL 23,019
Table 5: Conservation status (Robertson et al. 2017) of indigenous species counted at
forest sites (1452 total bird counts from 2009-18) in the Auckland region.
Conservation Status Count Percentage of total birds
Threatened 38 0.2%
At Risk 1,557 6.8%
61.8%
Not Threatened 14,235
TOTAL 15,830
Diversity, abundance and distribution of birds in Tāmaki Makaurau / Auckland 2009-2019 11Table 6: Mean Species Abundance and Probability of Detection of all bird species
counted (1452 total bird counts conducted from 2009-18) at forest sites (n = 400) in
Auckland; *indigenous; **endemic.
Mean Probability
Species counted Species of Detection
Abundance
Tūī tūī Prosthemadera novaeseelandiae 2.40 ± 0.11 76
novaeseelandiae**
Silvereye tauhou Zosterops lateralis lateralis* 2.22 ± 0.09 73
Grey warbler riroriro Gerygone igata** 1.70 ± 0.06 80
North Island fantail pīwakawaka Rhipidura fuliginosa placabilis** 0.91 ± 0.05 53
Eurasian blackbird Turdus merula 0.90 ± 0.04 53
Chaffinch Fringilla coelebs 0.88 ± 0.05 44
Common myna Acridotheres tristis 0.72 ± 0.05 33
Sacred kingfisher kōtare Todiramphus sanctus vagans* 0.66 ± 0.03 42
Bellbird korimako Anthornis melanura melanura** 0.58 ± 0.10 14
Eastern rosella Platycercus eximius 0.55 ± 0.04 30
European
19
goldfinch Carduelis 0.37 ± 0.04
New Zealand
23
pigeon kererū Hemiphaga novaeseelandiae** 0.31 ± 0.02
Kākā kākā Nestor meridionalis** 0.30 ± 0.05 11
Whitehead pōpokatea Mohoua albicilla** 0.27 ± 0.04 8
North Island tomtit miromiro Petroica macrocephala toitoi** 0.25 ± 0.03 16
European
15
greenfinch Carduelis chloris 0.21 ± 0.02
House sparrow Passer domesticus 0.20 ± 0.03 9
Song thrush Turdus philomelos 0.20 ± 0.02 14
Eurasian skylark Alauda arvensis 0.19 ± 0.03 11
Shining cuckoo pīpīwharauroa Chrysococcyx lucidus* 0.19 ± 0.02 15
Common pheasant Phasianus colchicus 0.17 ± 0.02 14
North Island
6
saddleback tīeke Philesturnus rufusater** 0.16 ± 0.03
North Island robin toutouwai Petroica longipes** 0.13 ± 0.03 6
Pūkeko pūkeko Porphyrio melanotus melanotus* 0.12 ± 0.02 9
Yellowhammer Emberiza citrinella 0.11 ± 0.02 8
Australian magpie Gymnorhina tibicen 0.09 ± 0.01 7
Common starling Sturnus vulgaris 0.08 ± 0.02 5
Welcome swallow Hirundo neoxena neoxena* 0.06 ± 0.01 4
Diversity, abundance and distribution of birds in Tāmaki Makaurau / Auckland 2009-2019 12Red-crowned Cyanoramphus novaezelandiae
3
parakeet kākāriki novaezelandiae** 0.05 ± 0.01
Dunnock Prunella modularis 0.04 ± 0.01 3
Long-tailed cuckoo koekoeā Eudynamys taitensis** 0.04 ± 0.01 2
Spur-winged
3
plover Vanellus miles novaehollandiae* 0.04 ± 0.01
Paradise shelduck pūtangitangi Tadorna variegata** 0.03 ± 0.01 2
Peafowl Pavo cristatus 0.03 ± 0.01 1
Red-billed gull tarapunga Larus novaehollandiae scopulinus* 0.03 ± 0.01 2
Swamp harrier kāhu Circus approximans* 0.03 ± 0.01 2
California quail Callipepla californica 0.02 ± 0.01 2
North Island
1
kokako kōkako Callaeas wilsoni** 0.02 ± 0.01
Rock pigeon Columba livia 0.02 ± 0.01 1
Southern black-
1
backed gull karoro Larus dominicanus dominicanus* 0.02 ± 0.01
Spotted dove Streptopelia chinensis tigrina 0.02 ± 0.01 1
Stitchbird hihi Notiomystis cincta** 0.02 ± 0.01 1
Sulphur-crested
1
cockatoo Cacatua galerita 0.02 ± 0.01
Variable
1
oystercatcher tōrea pango Haematopus unicolor** 0.02 ± 0.01
Chicken Gallus gallus domesticus 0.01 ± 0.01 1
North IslandNorth Island
70%
   Mean Indigenous Dominance
                                          60%
                                                                                               ***
                                          50%
       (Species Richness)

                                          40%

                                          30%                                                 Rotation1
                                                                                              Rotation2
                                          20%

                                          10%

                                          0%
                                                Indigenous      Mixed         Urban   Rural
                                                                     Land Class

                                      7
   Mean Indigenous Species Richness

                                      6

                                      5

                                      4

                                      3                                                       Rotation1
                                                                                              Rotation2
                                      2

                                      1

                                      0
                                           Indigenous        Mixed         Urban      Rural
                                                                 Land Class

                                      7
                                                                                               ***
   Mean Introduced Species Richness

                                      6

                                      5

                                      4

                                      3                                                       Rotation1
                                                                                              Rotation2
                                      2

                                      1

                                      0
                                           Indigenous        Mixed         Urban      Rural
                                                                 Land Class

Figure 2: Mean Indigenous Dominance (Species Richness), Indigenous and Introduced
Species Richness for birds counted at Tier 1 (regional) forest sites by Land Class and
Rotation. Bars = Standard Error. Overall ANOVA: ***p
Table 7: Post-hoc comparisons using Tukey HSD test of Mean Indigenous Dominance
(Species Richness) for birds counted at Tier 1 (regional) forest sites by Land Class.
Land Class n p values
Mixed Indigenous Rural
Mixed 29
Indigenous 35 p100%
Mean Indigenous Dominance
90% ***
80%
(Species Abundance)
70%
60%
50%
Rotation1
40%
Rotation2
30%
20%
10%
0%
Indigenous Mixed Urban Rural
Land Class
16
Mean Indigenous Species Abundance
14
12
10
8 Rotation1
6 Rotation2
4
2
0
Indigenous Mixed Urban Rural
Land Class
16
***
Mean Introduced Species Abundance
14
12
10
8
Rotation1
6
Rotation2
4
2
0
Indigenous Mixed Urban Rural
Land Class
Figure 3: Mean Indigenous Dominance (Species Abundance), Indigenous and
Introduced Species Abundance for birds counted at forest sites by Land Class and
Rotation. Bars = Standard Error. Overall ANOVA: ***p < 0.001.
Diversity, abundance and distribution of birds in Tāmaki Makaurau / Auckland 2009-2019 17Table 9: Post-hoc comparisons using Tukey HSD test of Mean Indigenous Dominance
(Species Abundance) for birds counted at Tier 1 (regional) forest sites by Land Class.
Land Class n p values
Mixed Indigenous Rural
Mixed 29
Indigenous 35 p70%
Mean Indigenous Dominance
(Species Richness) 60% ***
50%
40%
30%
20% Rotation1
10% Rotation2
0%
Ecological District
8
Mean Indigenbous Species Richness
7
6
5
4
3
Rotation1
2
Rotation2
1
0
Ecological District
8
***
Mean Introduced Species Richness
7
6
5
4
3
Rotation1
2
Rotation2
1
0
Ecological District
Figure 4: Mean Indigenous Dominance (Species Richness), Indigenous and Introduced
Species Richness for birds counted at Tier 1 (regional) forest sites by ecological
district and Rotation. Bars = Standard Error. Overall ANOVA: ***pTable 11: Post-hoc comparisons using Tukey HSD test of Mean Indigenous
Dominance (Species Richness) for birds counted at Tier 1 (regional) forest sites by
ecological district.
ecological
district n p values
Kaipara Otamatea Rodney Waitākere Tamaki Āwhitu Manukau
Kaipara 19
Otamatea 8 1.000
Rodney 40 p3.1.2.4 Ecological districts: Species Abundance Species Abundance had a similar pattern to the Species Richness variables with significant one-way ANOVAs for Mean Indigenous Dominance (Species Abundance) (one-way ANOVA, F7,118 = 4.71, p
80%
                                                                                         ***
             Mean Indigenous Dominance
                                                      70%

                (Species Abundance)
                                                      60%
                                                      50%
                                                      40%
                                                      30%                                Rotation1
                                                      20%
                                                                                         Rotation2
                                                      10%
                                                       0%

                                                              Ecological District

                                                      18
             Mean Indigenbous Species

                                                      16
                                                      14
                                                      12
                   Abundance

                                                      10
                                                       8
                                                       6                                 Rotation1
                                                       4
                                                                                         Rotation2
                                                       2
                                                       0

                                                             Ecological District

                                                 18
                                                                                         **
             Mean Introduced Species Abundance

                                                 16
                                                 14
                                                 12
                                                 10
                                                  8
                                                  6                                      Rotation1
                                                  4
                                                                                         Rotation2
                                                  2
                                                  0

                                                            Ecological District

Figure 5: Mean Indigenous Dominance (Species Abundance), Indigenous and
Introduced Species Abundance for birds counted at forest sites by ecological district
and Rotation. Bars = Standard Error. Overall ANOVA: **p < 0.01; ***p < 0.001.

Diversity, abundance and distribution of birds in Tāmaki Makaurau / Auckland 2009-2019               22
Table 13: Post-hoc comparisons using Tukey HSD test of Mean Indigenous
Dominance (Species Abundance) for birds counted at Tier 1 (regional) forest sites by
ecological district.
ecological
district n p values
Kaipara Otamatea Rodney Waitākere Tamaki Āwhitu Manukau
Kaipara 19
Otamatea 8 0.999
Rodney 40 0.073 0.838
Waitākere 7 p3.1.3 Tier 2: Large sub-regional ‘Areas' of interest 3.1.3.1 Species Richness All three Mean Species Richness one-way ANOVAs for Tier 2 Areas were significant: Indigenous Dominance (F5,83 = 19.95, p
90%
          Mean Indigenous Dominance       80%                                              ***
              (Species Richness)          70%
                                          60%
                                          50%
                                          40%
                                          30%                                            Rotation1
                                          20%
                                                                                         Rotation2
                                          10%
                                           0%

                                                   Tier 2 Area

                                          8
                                          7                                                   *
                                          6
   Mean Indigenous
   Species Richness

                                          5
                                          4
                                          3
                                                                                         Rotation1
                                          2
                                                                                         Rotation2
                                          1
                                          0

                                                 Tier 2 Area

                                      8
                                                                                         ***
   Mean Introduced Species Richness

                                      7
                                      6
                                      5
                                      4
                                      3
                                                                                         Rotation1
                                      2
                                                                                         Rotation2
                                      1
                                      0

                                                Tier 2 Area

Figure 6: Mean Indigenous Dominance (Species Richness), Indigenous and Introduced
Species Richness for birds counted at forest sites by Tier 2 Area and Rotation. Bars =
Standard Error. Overall ANOVA: *p
Table 15: Post-hoc comparisons using Tukey HSD test of Mean Indigenous
Dominance (Species Richness) for birds counted at forest sites by Tier 2 Area.
Tier 2 Area n p values
Tapora Waitākere Urban Hunua Waiheke
Tapora 15
Waitākere 20 p3.1.3.2 Species Abundance Mean Indigenous Dominance (Species Abundance) (F5,83 = 10.15, p
100%
    Mean Indigenous Dominance
       (Species Abundance)
                                              90%
                                              80%
                                                                                                      ***
                                              70%
                                              60%
                                              50%
                                              40%
                                              30%                                                    Rotation1
                                              20%                                                    Rotation2
                                              10%
                                               0%

                                                                    Tier 2 Area

                                        16
    Mean Indigenous Species Abundance

                                        14
                                        12
                                        10
                                         8
                                                                                                     Rotation1
                                         6
                                                                                                     Rotation2
                                         4
                                         2
                                         0
                                               Aotea Waitākere Hunua    Urban     Tapora   Waiheke
                                                                 Tier 2 Area

                                        16
                                                                                                      ***
    Mean Introduced Species Abundance

                                        14
                                        12
                                        10
                                         8
                                                                                                     Rotation1
                                         6
                                                                                                     Rotation2
                                         4
                                         2
                                         0
                                               Aotea Waitākere Hunua    Urban     Tapora   Waiheke
                                                                 Tier 2 Area

Figure 7: Mean Indigenous Dominance (Species Abundance), Indigenous and
Introduced Species Abundance for birds counted at forest sites by Tier 2 Area and
Rotation. Bars = Standard Error. Overall ANOVA: ***p
Table 18: Post-hoc comparisons using Tukey HSD test of Mean Indigenous
Dominance (Species Richness) for birds counted at forest sites by Tier 2 Area.
Tier 2 Area n p values
Tapora Waitākere Urban Hunua Waiheke
Tapora 15
Waitākere 20 p3.1.4 Tier 3: Key managed ‘Areas’ 3.1.4.1 Species Richness All three Species Richness Kruskal-Wallis tests for Tier 3 Areas were significant: Indigenous Dominance (H7 = 52.46, p
100%
   Mean Indigenous Dominance                90%
                                            80%
                                            70%
                                                                                          ***
                                            60%
       (Species Richness)

                                            50%
                                            40%
                                            30%
                                            20%
                                            10%
                                             0%                                          Rotation1
                                                                                         Rotation2

                                                     Tier 3 Area

                                      12
                                                                                          ***
   Mean Indigenous Species Richness

                                      10
                                       8
                                       6
                                       4
                                       2
                                       0                                                 Rotation1
                                                                                         Rotation2

                                                  Tier 3 Area

                                      12
                                                                                          ***
   Mean Introduced Species Richness

                                      10
                                       8
                                       6
                                       4
                                       2
                                       0                                                 Rotation1
                                                                                         Rotation2

                                                  Tier 3 Area

Figure 8: Mean Indigenous Dominance (Species Richness), Indigenous and Introduced
Species Richness for birds counted at forest sites by Tier 3 Area. Bars = Standard
Error. Overall Kruskal-Wallis test: ***p
Table 20: Post-hoc comparisons of mean ranks of all pairs of Mean Indigenous
Dominance (Species Richness) for birds counted at forest sites by Tier 3 Area.
Tier 3 Area n p values
Ark in
the Motutapu Windy
Park Rangitoto Is Hauturu KMA Glenfern Hill
Ark in the Park 19
Rangitoto 5 1.000
Motutapu Is 5 0.942 1.000
Hauturu 13 pTable 22: Post-hoc comparisons of mean ranks of all pairs of Mean Introduced
Species Richness of birds counted at forest sites by Tier 3 Area.
Tier 3 Area n p values
Ark in
the Motutapu Windy
Park Rangitoto Is Hauturu KMA Glenfern Hill
Ark in the Park 19
Rangitoto 5 1.000
Motutapu Is 5 1.000 0.658
Hauturu 13 p100%
Mean Indigenous Dominance
(Species Abundance)
90%
80%
70%
***
60%
50%
40%
30%
20%
10%
0%
Rotation1
Rotation2
Tier 3 Area
25
***
Mean Indigenous Species Abundance
20
15
10
5
0
Rotation1
Rotation2
Tier 3 Area
25
***
Mean Introduced Species Abundance
20
15
10
5
0
Rotation1
Rotation2
Tier 3 Area
Figure 9: Mean Indigenous Dominance (Species Abundance), Indigenous and
Introduced Species Abundance for birds counted at forest sites by Tier 3 Area and
Rotation. Bars = Standard Error. Overall Kruskal-Wallis test: ***pTable 23: Post-hoc comparisons of mean ranks of all pairs of Mean Indigenous
Dominance (Species Abundance) for birds counted at forest sites by Tier 3 Area.
Tier 3 Area n p values
Ark in
the Motutapu Windy
Park Rangitoto Is Hauturu KMA Glenfern Hill
Ark in the Park 19
Rangitoto 5 1.000
Motutapu Is 5 1.000 1.000
Hauturu 13 pTable 25: Post-hoc comparisons of mean ranks of all pairs of Mean Introduced
Species Richness of birds counted at forest sites by Tier 3 Area.
Tier 3 Area n p values
Ark in
the Motutapu Windy
Park Rangitoto Is Hauturu KMA Glenfern Hill
Ark in the Park 19
Rangitoto 5 1.000
Motutapu Is 5 1.000 0.765
Hauturu 13 p3.2 Wetland birds
3.2.1 Total species summary (Rotations 1 and 2)
In total, 913 bird counts were completed at 187 wetland sites during this study (2011-
2019), and 14,513 individual birds were counted. The majority were introduced,
followed by indigenous and endemic species (Table 26). Only a small percentage
(~8%) of total birds counted were ‘Threatened’ or ‘At Risk’ species (Table 27)
(Robertson et al. 2017). Total Species Richness comprised 61 species, with half of the
10 most abundant species being indigenous, and these occurred in a third of all counts
(Table 27).
Table 26: Status of species counted at 187 wetland sites (913 total bird counts from
2011-19) in the Auckland region.
Status Count Percentage of total birds
Endemic 3,521 24.3%
Indigenous 4,565 31.5%
Introduced 6,427 44.3%
TOTAL 14,513
Table 27: Conservation status (Robertson et al. 2017) of indigenous species counted
at wetland sites (913 total bird counts from 2011-19) in the Auckland region.
Conservation Status Count Percentage of total birds
Threatened 5Table 28: Mean Species Abundance and Probability of Detection of all bird species
counted (913 total bird counts from 2011-19) at wetland sites in Auckland;
*indigenous; **endemic.
Mean Probability
Species counted Species of detection
Abundance
Silvereye tauhou Zosterops lateralis lateralis* 2.42 ± 0.10 76
Common myna Acridotheres tristis 1.56 ± 0.09 63
Grey warbler riroriro Gerygone igata** 0.97 ± 0.05 59
European
35
goldfinch Carduelis carduelis 0.86 ± 0.09
House sparrow Passer domesticus 0.81 ± 0.08 31
Tui tūī Prosthemadera novaeseelandiae 0.79 ± 0.07 36
novaeseelandiae**
Common starling Sturnus vulgaris 0.78 ± 0.17 17
North Island fantail pīwakawaka Rhipidura fuliginosa placabilis** 0.67 ± 0.06 37
Australian magpie Gymnorhina tibicen 0.64 ± 0.05 37
Pūkeko pūkeko Porphyrio melanotus melanotus* 0.61 ± 0.05 33
Eurasian blackbird Turdus merula 0.53 ± 0.05 34
Welcome swallow Hirundo neoxena neoxena* 0.51 ± 0.06 24
Paradise shelduck pūtangitangi Tadorna variegata** 0.45 ± 0.10 9
Eastern rosella Platycercus eximius 0.45 ± 0.04 25
South Island pied
1
oystercatcher tōrea Haematopus finschi** 0.42 ± 0.28
Spur-winged
13
plover Vanellus miles novaehollandiae* 0.29 ± 0.06
Chaffinch Fringilla coelebs 0.25 ± 0.03 18
Sacred kingfisher kōtare Todiramphus sanctus vagans* 0.19 ± 0.02 17
Black swan Cygnus atratus* 0.16 ± 0.11 1
Mallard Anas platyrhynchos 0.16 ± 0.04 6
European
10
greenfinch Carduelis chloris 0.15 ± 0.03
Swamp harrier kāhu Circus approximans* 0.13 ± 0.01 12
Southern black-
5
backed gull karoro Larus dominicanus dominicanus* 0.11 ± 0.04
Yellowhammer Emberiza citrinella 0.10 ± 0.02 6
Bellbird korimako Anthornis melanura melanura** 0.09 ± 0.04 2
New Zealand
6
pigeon kererū Hemiphaga novaeseelandiae** 0.08 ± 0.01
Spotted dove Streptopelia chinensis tigrina 0.07 ± 0.01 6
Diversity, abundance and distribution of birds in Tāmaki Makaurau / Auckland 2009-2019 38Eurasian skylark Alauda arvensis 0.06 ± 0.01 4 Grey teal tētē Anas gracilis* 0.06 ± 0.06
Black-billed gull tarapunga Larus bulleri**
80%
   Mean Indigenous Dominance
                                          70%                                                 ***
                                          60%
       (Species Richness)

                                          50%
                                          40%
                                                                                              Rotation1
                                          30%
                                                                                              Rotation2
                                          20%
                                          10%
                                          0%
                                                Indigenous      Mixed         Urban   Rural
                                                                     Land Class

                                      6
   Mean Indigenous Species Richness

                                      5

                                      4

                                      3
                                                                                              Rotation1
                                      2                                                       Rotation2

                                      1

                                      0
                                           Indigenous        Mixed         Urban      Rural
                                                                 Land Class

                                      6
                                                                                              ***
   Mean Introduced Species Richness

                                      5

                                      4

                                      3
                                                                                              Rotation1
                                      2                                                       Rotation2

                                      1

                                      0
                                           Indigenous        Mixed         Urban      Rural
                                                                 Land Class

Figure 10: Mean Indigenous Dominance (Species Richness), Indigenous and
Introduced Species Richness for birds counted at wetland sites by Land Class and
Rotation. Bars = Standard Error. Overall ANOVA: ***p
Table 29: Post-hoc comparisons using Tukey HSD test of Mean Indigenous
Dominance (Species Richness) for birds counted at wetland sites by Land Class and
Rotation (R1 = Rotation 1; R2 = Rotation 2).
Land Class-
Rotation n p values
Mixed- Mixed- Rural- Indigenous- Indigenous- Urban-
Rural-R1
R1 R2 R2 R1 R2 R1
Mixed-R1 27
Mixed-R2 27 0.792
Rural-R1 79 0.276 p3.2.2.2 Land classes: Species Abundance Only the Indigenous Species Abundance data required transformation as its distribution was positively skewed, and hence square root transformation was applied. Wetland Mean Species Abundance varied significantly across Land Classes for all three variables analysed in the Repeated Measures ANOVAs: Indigenous Dominance (F3,130 = 14.63, p
80%
   Mean Indigenous Dominance
                                            70%                                                 ***
                                            60%
      (Species Abundance)

                                            50%
                                            40%
                                                                                                Rotation1
                                            30%
                                                                                                Rotation2
                                            20%
                                            10%
                                            0%
                                                  Indigenous     Mixed          Urban   Rural
                                                                       Land Class

                                       20
                                                                                                *
   Mean Indigenous Species Abundance

                                       15

                                       10                                                       Rotation1
                                                                                                Rotation2
                                        5

                                        0
                                              Indigenous       Mixed         Urban      Rural
                                                                   Land Class

                                       20
                                                                                                **
   Mean Introduced Species Abundance

                                       15

                                       10                                                       Rotation1
                                                                                                Rotation2
                                        5

                                        0
                                              Indigenous       Mixed         Urban      Rural
                                                                   Land Class

Figure 11: Mean Indigenous Dominance (Species Abundance), Indigenous and
Introduced Species Abundance for birds counted at wetland sites by Land Class and
Rotation. Bars = Standard Error. Overall ANOVA: *p
Table 31: Post-hoc comparisons using Tukey HSD test of Mean Indigenous
Dominance (Species Abundance) for birds counted at wetland sites by Land Class and
Rotation (R1 = Rotation 1; R2 = Rotation 2).
Land class-
Rotation n p values
Mixed- Indigenous- Indigenous- Urban-
Mixed-R2 Rural-R1 Rural-R2
R1 R1 R2 R1
Mixed-R1 27
Mixed-R2 27 0.986
Rural-R1 79 0.173 pTable 33: Post-hoc comparisons using Tukey HSD test of Mean Introduced Species
Abundance for birds counted at wetland sites by Land Class and Rotation (R1 =
Rotation 1; R2 = Rotation 2).
Land class-
Rotation n p values
Mixed- Indigenous- Indigenous- Urban-
Mixed-R2 Rural-R1 Rural-R2
R1 R1 R2 R1
Mixed-R1 27
Mixed-R2 27 0.959
Rural-R1 79 0.999 0.583
Rural-R2 79 0.943 0.242 0.992
Indigenous-R1 16 0.869 1.000 0.427 0.185
Indigenous-R2 16 0.378 0.906 0.057 p80%
Mean Indigenous Dominance
(Species Richness)
70%
60%
***
50%
40%
30%
20%
Rotation1
10%
0% Rotation2
Ecological District
8
***
Mean Indigebous Species Richness
7
6
5
4
3
2
Rotation1
1
0 Rotation2
Ecological District
8
***
Mean Introduced Species Richness
7
6
5
4
3
2
Rotation1
1
0 Rotation2
Ecological District
Figure 12: Mean Indigenous Dominance (Species Richness), Indigenous and
Introduced Species Richness for birds counted at wetland sites by ecological district
and Rotation. Bars = Standard Error. Overall ANOVA: ***p3.2.2.4 Ecological districts: Species Abundance Mean Species Abundance data differed significantly for Indigenous Dominance (Repeated Measures ANOVA, F8,125 = 2.83, p
85%
   Mean Indigenous Dominance
      (Species Abundance)
                                            75%
                                            65%
                                                                                              *
                                            55%
                                            45%
                                            35%
                                            25%
                                            15%                                          Rotation1
                                             5%                                          Rotation2
                                            -5%

                                                    Ecological District

                                       18
   Mean Indigenous Species Abundance

                                       16
                                       14
                                       12
                                       10
                                        8
                                        6
                                        4                                                Rotation1
                                        2
                                        0                                                Rotation2

                                                  Ecological District

                                       18
                                                                                          ***
   Mean Introduced Species Abundance

                                       16
                                       14
                                       12
                                       10
                                        8
                                        6
                                        4                                                Rotation1
                                        2
                                        0                                                Rotation2

                                                  Ecological District

Figure 13: Mean Indigenous Dominance (Species Abundance), Indigenous and
Introduced Species Abundance for birds counted at wetland sites by ecological
district and Rotation. Bars = Standard Error. Overall ANOVA: *p
4.0 Discussion 4.1 Limits of this study This comprehensive 10-year study of forest and wetland birds has revealed significant variation across the region, and it shows the value of using the standard 5MBC methodology. It is important to acknowledge that 5MBCs disproportionately detect more conspicuous birds while cryptic and quieter birds can be overlooked (Hartley 2012). However, as this study has analysed these data in similar environments (separately for forest and wetlands) where detectability will generally be consistent, robust inferences are achievable given the large sample sizes for most of the areas in this study. A major limitation of this study is the lack of trend data. This is because only two independent time measures were available, with the two Rotations. This was further complicated in the forest data with two thirds of the forest Rotation 2 dataset not remeasured (as a result of the resourcing issues mentioned in the Methods). We were able to look for variation over time in the wetlands data, where two full rotations were completed, however, no major changes were found, probably because only two time measures were available to analyse. Future remeasures will allow us to conduct more robust trend analyses and thus identify what changes are occurring over time. 4.2 Forest birds In total, 64 species were counted in the forest component of this study with almost 70 per cent of all birds detected being indigenous species (Table 2). Tūī was the most commonly counted bird, but silvereye and grey warbler were very commonly counted as well. These three species were detected in >70 per cent of all counts at forest sites. The next two most common species were the indigenous North Island fantail and the introduced Eurasian blackbird, both detected in 53 per cent of all forest counts. These five species are all conspicuous as they are vocal and thus easily detected. A bird study in the heavily forested Waitākere Ranges using a similar five-minute bird count method to this study found the same top five species (T. Lovegrove and K. Parker, unpubl. data). Their 22-year study found all these species to have increased, except for fantail, which had changed very little. There was considerable variation in Indigenous Dominance when calculated from both Mean Species Richness and Abundance data across all our spatial independent variables (Land Class, ED, Tier 2 and 3 sites). Sites that were predominantly Diversity, abundance and distribution of birds in Tāmaki Makaurau / Auckland 2009-2019 50
You can also read