Do perceived control and time orientation mediate the effect of early life adversity on reproductive behaviour and health status? Insights from ...
←
→
Page content transcription
If your browser does not render page correctly, please read the page content below
ARTICLE
                  https://doi.org/10.1057/s41599-022-01066-y                 OPEN

                  Do perceived control and time orientation mediate
                  the effect of early life adversity on reproductive
                  behaviour and health status? Insights from the
                  European Value Study and the European Social
                  Survey
1234567890():,;

                  Bence Csaba Farkas              1,2,3 ✉,   Valérian Chambon4 & Pierre O. Jacquet                      1,2,3

                  An association between early life adversity and a range of coordinated behavioural responses
                  that favour reproduction at the cost of a degraded health is often reported in humans. Recent
                  theoretical works have proposed that perceived control—i.e., people’s belief that they are in
                  control of external events that affect their lives—and time orientation—i.e., their tendency to
                  live on a day-to-day basis or to plan for the future—are two closely related psychological
                  traits mediating the associations between early life adversity, reproductive behaviours and
                  health status. However, the empirical validity of this hypothesis remains to be demonstrated.
                  In the present study, we examine the role of perceived control and time orientation in
                  mediating the effects of early life adversity on a trade-off between reproductive traits (age at
                  1st childbirth, number of children) and health status by applying a cross-validated structural
                  equation model frame on two large public survey datasets, the European Values Study (EVS,
                  final N = 43,084) and the European Social Survey (ESS, final N = 31,065). Our results show
                  that early life adversity, perceived control and time orientation are all associated with a trade-
                  off favouring reproduction over health. However, perceived control and time orientation
                  mediate only a small portion of the effect of early life adversity on the reproduction-health
                  trade-off.

                  1 Université Paris-Saclay, UVSQ, Inserm, CESP, 94807 Villejuif, France. 2 Institut du Psychotraumatisme de l’Enfant et de l’Adolescent, Conseil Départemental

                  Yvelines et Hauts-de-Seine, CH Versailles, 78000 Versailles, France. 3 LNC2, Département d’études Cognitives, École Normale Supérieure, INSERM, PSL
                  Research University, 75005 Paris, France. 4 Institut Jean Nicod, Département d’études Cognitives, ENS, EHESS, CNRS, PSL Research University, 75005
                  Paris, France. ✉email: bence.farkas@ens.psl.eu

                  HUMANITIES AND SOCIAL SCIENCES COMMUNICATIONS | (2022)9:52 | https://doi.org/10.1057/s41599-022-01066-y                                                    1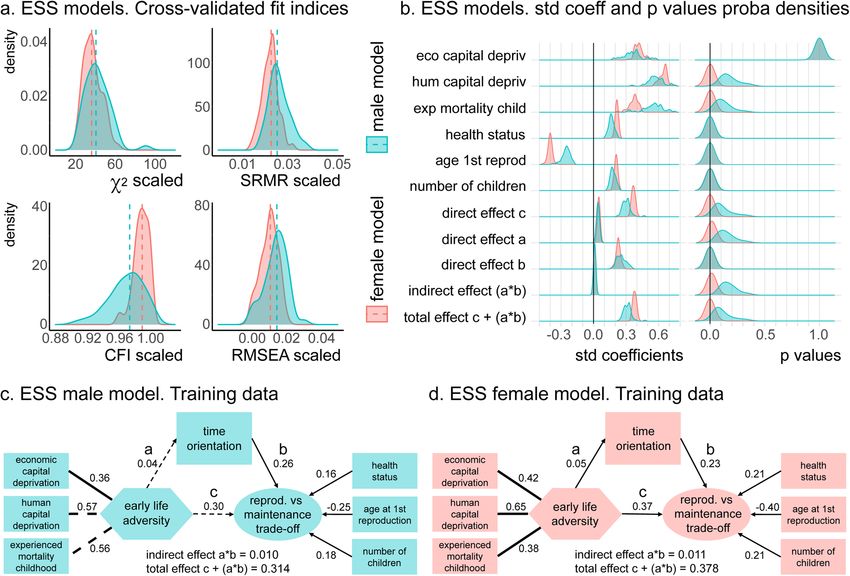
ARTICLE                                HUMANITIES AND SOCIAL SCIENCES COMMUNICATIONS | https://doi.org/10.1057/s41599-022-01066-y

S
Introduction
       ocioeconomic inequality is on the rise. In France, in 2016,        events that cause mortality and morbidity are beyond their
       the wealthiest 1% owned over 20% of the country’s total            control) and thus may prefer acting on a day-to-day basis in order
       wealth (Zucman, 2019). This metric has been steadily               to receive payoffs sooner. This phenomenon, known as “collec-
increasing since the 1980s and similar or even more extreme               tion risk”, describes situations in which waiting for the collection
trends can be observed in the rest of Europe, China and the               of a later reward—that is, planning for the future—is not optimal
United States (Piketty and Saez, 2014; Zucman, 2019). Such                because it is not certain that you will stay in good enough con-
drastic worldwide inequality leaves many people struggling with           dition to benefit from it (Stevens and Stephens, 2010). Moreover,
poverty and its consequences for many aspects of human life.              by delaying reward collection, individuals also potentially expose
   In fact, economic scarcity often comes together with other             themselves to “waiting costs”, that is, to losing the benefits that
environmental factors that cumulatively contribute to reduced             could have been accrued in the delay (Mell et al., 2021).
well-being and shorter lifespan (Pepper and Nettle, 2017). For               Using either mechanism, this framework predicts that per-
that reason, these factors are collectively termed ‘adversity’.           ceived control and time orientation should be key variables
Economic scarcity, violence and maltreatment, physical and                mediating the relationships between early life adversity and the
affective instabilities within the family household, exposure to          trade-off between maintenance and reproduction. Thus, for
pollutants, or malnutrition, are all considered factors of adversity.     individuals who have little or no control over events that may
When met early in life—that is, from conception to adolescence—           affect their lives, the future is uncertain and, therefore, they
these factors interfere with the developmental trajectories of            cannot risk delaying reproduction to invest in activities or
many human biological systems, including growth and energy                functions that are only beneficial in the long run, such as health
storage (Kuzawa et al., 2014), immunity (McDade, 2005; McDade             in old age. Recent findings provide evidence that seem to support
et al., 2016), reproduction (Bar-Sadeh et al., 2020; Mell et al.,         this prediction, at least in the health domain. First, the link
2018), cognition and behaviour (Ellis and Del Giudice, 2019). As          between life conditions and perceived control—and more broadly
a result, they can impact the functioning of these systems later in       locus of control, i.e., the degree to which individuals believe that
life (Miller et al., 2011; Smith and Pollak, 2021).                       they, as opposed to external factors such as chance, fate, or other
   Compared to people who enjoyed affluent and stable envir-               agents, have control over their lives (Lefcourt, 1976; Rotter, 1966)
onments during childhood, individuals who grew up in adverse              —is well documented. For example, a number of studies have
environments are at greater risk of expressing obesity, type 2            shown that people of lower social class, in possession of fewer
diabetes, heart or respiratory diseases, cancers, or autoimmune           resources, exposed to greater instabilities, or in a poorer health
diseases later in life (Hughes et al., 2017; Miller et al., 2011).        status, tend to perceive external, uncontrollable forces and other
Paradoxically, they also produce behaviours that can be equally           individuals as the primary causes of events that affect their lives
detrimental for their health: they smoke more (Legleye et al.,            (reviewed in Kraus et al., 2012). In contrast, people with higher
2011; Melotti et al., 2011; Nandi et al., 2014), use cannabis             socioeconomic position perceived themselves (their internal
(Legleye et al., 2011) and alcohol more (Melotti et al., 2011; Nandi      states, motivations and emotions) as the primary causal sources
et al., 2014), and exercise less (Nandi et al., 2014). In parallel,       of what happens to them (Kraus et al., 2012). In addition, Pepper
early exposure to adverse environments appears to direct indi-            and Nettle (2014) found that the effect of individuals’ socio-
viduals toward an urgent need to achieve reproductive goals               economic status (SES) on the amount of self-reported health
through physiological and behavioural processes leading to early          effort was entirely mediated by perceived extrinsic mortality risk.
puberty (Amir et al., 2016), early entry into sexual life and par-        Some recent works also suggest that certain adversity factors
enthood (Nettle et al., 2011) along with a greater number of              encountered early in life (e.g., economic scarcity, attachment
children (Nettle, 2010).                                                  insecurity) increases mental health problems (e.g., depression,
   An possible explanation for the asymmetry between main-                anxiety) later in life via an external locus of control (Culpin et al.,
tenance and reproductive goals is that of an energy trade-off             2015; Di Pentima et al., 2019). Finally, there is also extensive
between these two competing functions (Ellis and Del Giudice,             evidence that exposure to harsh and unpredictable childhood
2019; Nettle and Frankenhuis, 2019). This explanation borrows             environments induces people to adopt an unpredictability
from Life History theory (Del Giudice et al., 2015; Hill and              schema, a pervasive belief that the world and people are unpre-
Kaplan, 1999), a general framework in evolutionary biology that           dictable, chaotic and untrustworthy (Cabeza de Baca and Ellis,
highlights the limited nature of bioenergetic resources and the           2017; Ross and Hill, 2002). Multiple aspects of such schemas have
resulting trade-offs that bind phenotypic traits into patterns of         been investigated in relation to early life experiences and later life
co-variation. It puts forward the idea that investments of                risky behaviours. For example, future discounting was found to
resources in reproductive efforts are accompanied by decreases            mediate the effects of family unpredictability on risk taking (Hill
in health efforts on the one hand and direct maintenance costs            et al., 2008), and maternal parental and mating efforts were
on the other hand. Ultimately, this pattern would lead to poorer          systematically related to a composite measure of unpredictability
health status later in life and shorter life-expectancy. Interest-        schemas (Cabeza de Baca et al., 2016).
ingly, there may be a notable difference in this pattern between             To our knowledge, however, no existing studies has system-
the two sexes (Sear, 2020). For men, poorer health status could           atically explored the possibility that early life adversity, perceived
be primarily the result of maintenance costs associated with              control, time orientation, reproductive and maintenance traits all
poor health efforts, whereas for women it could additionally be           covary in a manner consistent with predictions made by theo-
caused by the high metabolic expenditures required by preg-               retical frameworks inspired by Life History research (Pepper and
nancy and parental care during offspring’s early life (Jasienska          Nettle, 2017; Ellis and Del Giudice, 2019). Yet, understanding
et al., 2017; Ryan et al., 2018).                                         how early life conditions shape the development of these traits
   Why would adversity lead people to prioritise reproduction             along with their behavioural effects is extremely important for a
and sacrifice their own health and well-being? One possibility is          number of reasons. It would allow a mechanistic understanding
that such a strategy forms the present-oriented end of a beha-            of the effects of early life adversity on different levels of an
vioural trade-off between present time and future time (Pepper            individual’s biology and help to more accurately estimate the
and Nettle, 2017). Individuals exposed to adversity may have less         long-term consequences of such early life conditions on both
perceived or actual control over their own lives (i.e., external          physical and mental health. Importantly, it would also contribute

2                         HUMANITIES AND SOCIAL SCIENCES COMMUNICATIONS | (2022)9:52 | https://doi.org/10.1057/s41599-022-01066-y
HUMANITIES AND SOCIAL SCIENCES COMMUNICATIONS | https://doi.org/10.1057/s41599-022-01066-y                                        ARTICLE

to recontextualizing the behaviour of less advantaged people as              participants (17,639 females; 13,426 males). Descriptive statistics
plastic and contextually appropriate responses to their local                can be found in the Supplementary Table S1.
ecology, and not merely deregulated and dysfunctional responses
to early life stress. Thus, improving our knowledge on these topics
                                                                             Missing data. Multiple imputation techniques were used to
could further be used to help design innovative interventions in
                                                                             preserve sample size and avoid biased estimations of model
the educational or medical domains (Ellis et al., 2020). The pre-
                                                                             parameters (see Supplementary Table S2 for the % of missing
sent study therefore aims to progress towards these goals by
                                                                             values per items). Twenty complete EVS datasets were generated
conducting two sets of large-scale multivariate models testing the
                                                                             by fully conditional specifications for categorical (logistic
mediating role of perceived control (model set 1) and time
                                                                             regression imputation) and ordinal data (proportional odds
orientation (model set 2) in the association between early life
                                                                             model). The mice package of R was used for imputation (van
adversity and a hypothetical trade-off between reproductive (i.e.,
                                                                             Buuren and Groothuis-Oudshoorn, 2011).
timing of reproduction, fertility) and maintenance (i.e., health
status) traits. As these traits are expected to cluster differently
between females and males (Sear, 2020), model sets will be run               Multivariate models. The data were analysed with structural
separately for individuals of both sexes. Each model set tests two           equation modelling (SEM) using the lavaan (Rosseel, 2012) and
main hypotheses. Hypothesis 1 suggests that early life adversity is          semTools (Jorgensen et al., 2020) packages in R. These models are
related to the reproduction-maintenance trade-off. Hypothesis                made up of a ‘measurement’ model that relates the observed
2 suggests that early life adversity influences the reproduction-             ‘indicators’ to hypothesised, but unobservable ‘latents’ and a
maintenance trade-off via perceived control (model set 1) or time            ‘structural’ model that relates the latent variables to each other by
orientation (model set 2). We predict that:                                  specifying paths between them. The model we specified involved
                                                                             two latent variables: Early life adversity and Reproduction-
   i. Higher levels of early life adversity are associated with a            maintenance trade-off. Additionally, Perceived control and Time
      reproduction-maintenance trade-off characterised by                    orientation were directly measured by a variable of the EVS and
      greater investment in reproductive activities (i.e., younger           ESS, respectively.
      age at first reproduction, more children) and poorer health                In our measurement models, Early life adversity is modelled as
      status.                                                                an emergent variable rather than a reflective latent variable
  ii. This association is mediated by the individuals’ perceived             (Brumbach et al., 2009; Mell et al., 2018). The rationale is that
      control/time orientation, such that higher levels of adversity         adverse life conditions or events are better conceptualised as
      decrease the feeling of control individuals have over their            factors that are not necessarily correlating with one another, but
      own lives/increase present orientation, and diminished                 that all contribute to the cumulative probability of developing a
      control/increased present orientation in turn increases the            particular outcome. Having been exposed to the death of a parent,
      need for individuals to put more resources in reproduction             having been raised in an economically deprived family or in a
      and fewer resources in health.                                         family with a low educational background, are factors that
  To verify our predictions and test their capacity to generalise to         increase the probability of experiencing an adverse childhood
out-of-sample data, we apply multivariate structural equation                environment, but that might be experienced relatively indepen-
modelling (Kline, 2015) and stratified k-fold cross-validation                dently of each other. In addition, such factors might not
(Arlot and Celisse, 2010) on data from the European Value Study              contribute equally to the probability of developing a particular
(EVS) and the European Social Survey (ESS). Both are large-scale,            outcome. The SEM approach offers the opportunity to handle
cross-national, and longitudinal survey research programmes on               this problem using unknown weight composites, a procedure
basic human values.                                                          which captures the collective effects of a set of causes on a
                                                                             response variable (Grace and Bollen, 2008). In that case, the
                                                                             composite score is computed via a set of weights whose sum
Methods                                                                      maximises the amount of variance explained in the dependent
Samples of participants. The European Values Study (EVS) is a                variables and thus allows comparing the relative contribution of
large-scale, cross-national, repeated cross-sectional survey                 the hypothesised causes to the overall predictive power of the
research programme on basic human values. Its main topics are                composite. Here, the latent composite Early life adversity
family, work, environment, perceptions of life, politics and                 computes weights of three indicators based on their predictive
society, religion and morality and national identity. The study has          power on the Reproduction-maintenance trade-off latent variable
been conducted in four waves since 1981. We made use of the 4th              and the Perceived control/Time orientation variable.
wave of the survey, which started in 2008 and contains respon-                  In specifying the models, we chose to consider Perceived
dents from 46 European countries. The European Social Survey                 control, Time orientation, and Health—three variables that could
(ESS) is another large, cross-national and longitudinal survey that          be classified as ordinal—as continuous variables because
contains data from 40 countries on attitudes, beliefs and beha-              responses measured on Likert scales with five or more points
vioural patterns. We made use of the 9th round of the survey that            share many properties with continuous data and can occasionally
began in 2018. These survey waves contain data to assess                     be treated as such (Johnson and Creech, 1983; Norman, 2010).
respondents’ childhood environments and to calculate the age of
birth of their first child, both important life history related vari-         EVS model. In more detail, the Early life adversity latent was
ables. From both datasets we removed respondents with too                    modelled by three indicators (see Supplementary Table S2):
many missing values (+2 SDs from sample mean) and respon-                    Economic capital deprivation, Human capital deprivation and
dents with missing values on the age variable, as it cannot be               Experienced mortality in childhood. The Economic capital
accurately imputed. We also removed respondents without chil-                deprivation indicator was manually constructed from the
dren, as both of our indicators of reproductive strategy (Number             respondents’ scores on two items. Respondents were given the
of children and Age at 1st reproduction) are only relevant for               following context: ‘When you think about your parents when
respondents with children. The final sample of the EVS data set               you were about 14 years old, could you say whether…’. They
consisted of 43,084 participants (25,341 females; 17,743 males).             were then asked to choose a response among 4 possible (from
The final sample of the ESS data set consisted of 31,065                      ‘1—Yes’ to ‘4—No’) on the following two statements: ‘Parent(s)

HUMANITIES AND SOCIAL SCIENCES COMMUNICATIONS | (2022)9:52 | https://doi.org/10.1057/s41599-022-01066-y                                         3
ARTICLE HUMANITIES AND SOCIAL SCIENCES COMMUNICATIONS | https://doi.org/10.1057/s41599-022-01066-y had problems making ends meet’ [variable v014] and ‘Parent(s) adversity was modelled as a composite latent variable. As had problems replacing broken things’ [variable v018]. Item composite variables also need to be scaled for identification scores were recoded and summed such that greater scores purposes by fixing the coefficient of one of the causal indicators, indicate greater deprivation in economic capital. The Human Early life adversity was scaled by setting the path from Economic capital deprivation indicator was calculated from six items from capital deprivation to 1. the same question set (‘Mother liked to read books’ [variable In our structural model, we specified three paths: a path v011], ‘Discussed politics with mother’ [variable v012], ‘Mother between Early life adversity and Perceived control, a path between liked to follow the news’ [variable v013], ‘Father liked to read Perceived control and Reproduction-maintenance trade-off and a books’ [variable v015], ‘Discussed politics with father’ [variable path between Early life adversity and Reproduction-maintenance v016] and ‘Father liked to follow the news’ [variable v017]), plus trade-off. This allowed us to test both the direct effect of adversity two items providing information on the education of the on allocation trade-offs, its indirect effect mediated by perceived respondents’ parents (‘Highest educational level attained father/ control and the total effect, which is the sum of the direct and mother (eight categories)’ [variable v004E/V004R]). Item scores indirect effects. were recoded, z-scored and summed such that greater scores indicate greater deprivation in human capital. The Experienced ESS model. In this model, the Early life adversity latent was again mortality indicator was manually constructed by summing modelled by the same three indicators (see Supplementary Table respondents’ scores on the following binary items (Yes/No): S2): Economic capital deprivation, Human capital deprivation and ‘Experienced: death of father’ [variable u005a] and ‘Experienced: Experienced mortality in childhood. The Economic capital depri- death of mother’ [variable u006a], at a reported age below 14. vation indicator was manually constructed from the respondents’ Item scores were recoded such that greater scores indicate scores on the items: ‘Father’s employment status when respon- greater mortality. Scores on the Economic capital deprivation, dent 14’ [variable EMPRF14, possible answers from ‘1—Yes Human capital deprivation and Experienced mortality indicators employee’ to ‘4—Dead/absent’], ‘Father’s occupation when were z transformed and normalised to be between 0 and 10, respondent 14’ [variable OCCF14B, possible answers from ‘1— before entering them into the model. Professional and technical occupations’ to ‘9—Farm worker’] and The Reproduction-maintenance trade-off latent variable was ‘Mother’s occupation when respondent 14’ [variable OCCF14B, modelled by three indicators (see Supplementary Table S2): Age possible answers from ‘1—Professional and technical occupa- at 1st reproduction (representing the timing of reproduction), tions’ to ‘9—Farm worker’]. The variable ‘Mother’s employment Number of children (representing fertility), and Health (repre- status when respondent 14’ [variable EMPRM14] was also initi- senting the maintenance state). The Health indicator was directly ally considered, however, the extremely large number of missing measured by the ‘State of health (subjective)’ [variable a009], values (46.77%) prevented its inclusion. Item scores were recoded, asking respondents to answer the following question ‘All in all, z-scored and summed such that greater scores indicate greater how would you describe your state of health these days?’ by deprivation in economic capital. The Human capital deprivation choosing a response among five possible, from ‘1—Very good’ to indicator was manually constructed from the respondents’ scores ‘5—Very poor’. It is important to note that, although dependent on the following variables: ‘Highest educational level attained on the subjective perception of the respondents, the subjective father’ (seven categories) [variable EISCEDF] and ‘Highest edu- state of health is highly correlated with the objective somatic state. cational level attained mother’ (seven categories) [variable EIS- More specifically, the subjective assessment of health status CEDM]. Item scores were recoded and summed such that greater predicts morbidity (Barger and Muldoon, 2006; Goldberg et al., scores indicate greater deprivation in human capital. The 2001) and mortality (Benyamini and Idler, 1999; Idler and Experienced mortality in childhood indicator was manually con- Benyamini, 1997) better than some traditional physiological risk structed by first creating two new variables by considering ‘Dead/ factors (Haring et al., 2011; Jylhä et al., 2006). The Age at 1st absent’ responses to the ‘Father’s employment status when reproduction indicator was constructed manually by subtracting respondent 14’ and ‘Mother’s employment status when respon- the ‘respondents birth year’ [variable x002] from the ‘birth year of dent 14’ items as indicators of absence. Item scores were recoded the first child’ [variable x011_02]. The Number of children and summed such that greater scores indicate greater mortality. indicator is directly measured by ‘How many children do you Scores on the Economic capital deprivation, Human capital have—deceased children not included’ [variable x011_01]. A deprivation and Experienced mortality in childhood indicators residual covariance term was also introduced between the Age at were z transformed and normalised to be between 0 and 10, 1st reproduction and Number of children indicators in order to before entering them into the model. account for the effect of early reproduction on the total number The Reproduction-maintenance trade-off latent was modelled of children reported at the time of the interview. Greater scores by three indicators (see Supplementary Table S2): Health, Age at on the latent variable indicate a poorer health status, a younger 1st reproduction and Number of children. The Health indicator age at 1st childbirth, and a greater number of children. was directly measured by Subjective general health [variable Finally, Perceived control was measured directly by the variable HEALTH], an item fully identical to its EVS counterpart. The Age ‘How much freedom of choice and control’ [variable a173] (see at 1st reproduction indicator was constructed manually by Supplementary Table S2). Respondents were put in the following subtracting the respondents birth year [variable YRBRN] from context: ‘Some people feel they have completely free choice and the birth year of their first child [variable FCLDBRN]. The control over their lives, and other people feel that what they do Number of children indicator is directly measured by [variable has no real effect on what happens to them.’ They then ask to NBTHCLD]. As for the EVS model, a residual covariance term answer the question ‘How much freedom of choice and control was introduced between the Age at 1st reproduction and Number you feel you have over the way your life turns out?’, choosing one of children indicators. Greater scores on the latent variable value in a ten points scale, from ‘1—None at all’ to ‘10—A great indicate a poorer health status, a younger age at 1st childbirth, deal’. A greater score on this item therefore indicates a greater and a greater number of children. sense of control over life events. Finally, Time orientation was measured directly by the item Whereas Reproduction-maintenance trade-off was modelled as ‘Plan for future or take each day as it comes’ [variable PLNFTR] a latent variable and was scaled by fixing its variance to 1, based (see Supplementary Table S2), which provides 11 possible on the recommendation of Brumbach et al. (2009). Early life responses from ‘0—I plan for my future as much as possible’ to 4 HUMANITIES AND SOCIAL SCIENCES COMMUNICATIONS | (2022)9:52 | https://doi.org/10.1057/s41599-022-01066-y
HUMANITIES AND SOCIAL SCIENCES COMMUNICATIONS | https://doi.org/10.1057/s41599-022-01066-y                                        ARTICLE

‘10—I just take each day as it comes’. A greater score on this item             1. The full data set is randomly partitioned into five folds of
therefore indicates a stronger present orientation.                                nearly equal size.
   As for the EVS model, Reproduction-maintenance trade-off was                 2. Subsequently five iterations of training and validation are
modelled as a latent and was scaled by fixing its variance to 1, and                performed such that within each iteration a different fold of
Early life adversity was modelled as a composite latent variable                   the data is held-out for validation (the test data, here
and was scaled by setting the path from Economic capital                           representing 20% of the whole sample) while the remaining
deprivation to 1.                                                                  k-1 folds are used for fitting (the training data, here
   In our structural model, we specified three paths: a path                        representing 80% of the whole sample).
between Early life adversity and Time orientation, a path between               3. At each iteration, the model is fitted on the training data,
Time orientation and Reproduction-maintenance trade-off and a                      and then its parameters are set according to these results.
path between Early life adversity and Reproduction-maintenance                     After that, it is re-fitted on the test data.
trade-off. These paths allowed us to test both the direct effect of             4. The predictive value of the training model is further
adversity on allocation trade-offs, its indirect effect mediated by                checked by applying the same cross-validation procedure
present vs future orientation, and the total effect, which is the                  on a test data set whose individual values have been
sum of the direct and indirect effects.                                            randomly permuted within each indicator. The aim is to
                                                                                   ensure that the fitted values obtained from modelling the
                                                                                   training data failed at predicting the test data when its
Adjustment variables. The Health, Age at 1st reproduction,                         internal structure is broken down by means of randomisa-
Number of children, Perceived control and Time orientation                         tion. In other words, this procedure allows us to state
indicators present in the EVS model and/or the ESS model were                      whether the latent structure hypothesised by our structural
adjusted for the effect of the age of the respondents and their level              equation model is present or absent in the training samples.
of household income [EVS: variable x047r; ESS: variable                         5. At the end of the five iterations, the whole sample is
HINCTNTA] reported at the time of the interview (see Supple-                       reshuffled and re-stratified before a new round of five
mentary Table S2).                                                                 iterations starts.
                                                                                6. The whole procedure is repeated ten times (10 rounds of 5
Fitting procedure. The models were fitted using a weighed least                     iterations, meaning overall 50 iterations) in order to obtain
squares estimator (WLSMV) because of its robustness to devia-                      reliable performance estimation (the mean and standard
tions from normality. Model fit was assessed by the χ2, Com-                        deviations across iterations of the predictive accuracy ratio).
parative Fit Index (CFI), Root Mean Square Error of                                Note that at each iteration within a round, the training and
Approximation (RMSEA), and Standardized Root Mean Square                           the test datasets always include different data points.
Residual (SRMR) statistics. All these indicators are summary
statistics of 50 individual fits obtained during cross-validation
(see below). The χ2, CFI, RMSEA, and SRMR statistics were                    Reporting of the results. Cross-validated goodness-of-fit indices
corrected by a scaling factor, which compensates for the average             for a given model are expressed in terms of the median on the
kurtosis of the data (Satorra and Bentler, 2001). A model’s fit is            testing data. Similarly, the goodness-of-fit indices of a given
generally considered excellent when the RMSEA is below 0.05,                 model are expressed in terms of the median on the training data.
the CFI above 0.95 and SRMR below 0.08 (Hu and Bentler, 1999).               Finally, parameters estimates obtained from the measurement
   The same model was fitted separately for male and female                   and the structural parts of a given model fitted on the training set
respondents’ data. We expected that the higher costs of                      over the 50 iterations are expressed in term of the median. The
reproduction for women might lead to more pronounced                         reason is that medians are best suited to account for a model’s
relationships. Separately estimating the model in the two genders            precision in the present context: the distributions of values are
allowed us to compare the relationships between genders as well              often skewed because of the sampling variability resulting from
as see whether the overall model fits are different, which would              the multiple reshuffling and re-stratification of data during the
have important implications in itself. We will refer to the two              cross-validation procedure. Comparisons were made by using
models as the male and female models.                                        Wilcoxon rank sum tests. Finally, to enhance the readability of
   Importantly, for the ESS data set only, there are survey                  the text, all statistical indices and parameter estimates corrobor-
weights that needed to be incorporated to correct for                        ating the description of the models are reported in the tables
estimates, standard errors, and chi-square-derived fit mea-                   included in the main text and in the Supplementary Information.
sures for the complex sampling design. We followed the                       The cross-validated median goodness-of-fit indices are reported
recommended weighting procedure in R by the ESS metho-                       in Tables 1 and 2. The median parameter estimates of their
dological guide (https://www.europeansocialsurvey.org/docs/                  ‘measurement’ and ‘structural’ parts are reported in Table 3 for
methodology/ESS_weighting_data_1_1.pdf). We then created                     the EVS data set, and Table 4 for the ESS data set.
a custom R script based on the lavaan.survey package to fit our
model. For more details on this procedure, see Oberski (2014).
                                                                             Visualising the models. Visualising the modelled individual
                                                                             latent scores is difficult because in our cross-validation strategy,
Cross-validation algorithm. To address the problem of over-                  the data set at each iteration has a different number and identity
fitting due to the inherent complexity of SEM models (Breckler,               of subjects. Therefore, simply averaging across iterations is
1990; Preacher, 2006; Roberts and Pashler, 2000), we employed a              impossible. So, we resorted to ignoring cross-validation for
stratified k-fold cross-validation strategy (Arlot and Celisse,               visualisation purposes and merely estimated the model on each
2010). The aim of applying stratified k-fold cross-validation to              imputation. Then, we used the lavaanPredict function to extract
SEM is twofold. First, it submits a model to sampling variability            the modelled variable scores for each subject. Finally, we averaged
and therefore allows to estimate its stability across multiple               these results across the 20 imputed datasets. The associations
reshuffling and re-stratification of the data sample. Second, it tests         between the Early life adversity scores and the Perceived
the capacity of a model to generalise its predictions to out-of-             control/Time orientation scores, so as the associations between the
sample data. The analyses consisted of the following steps:                  Perceived control/Time orientation scores and the Reproduction-

HUMANITIES AND SOCIAL SCIENCES COMMUNICATIONS | (2022)9:52 | https://doi.org/10.1057/s41599-022-01066-y                                         5
ARTICLE HUMANITIES AND SOCIAL SCIENCES COMMUNICATIONS | https://doi.org/10.1057/s41599-022-01066-y
Table 1 EVS models. The model fits did not differ significantly between genders.
The female models CFI (medianfemales = 0.972,
medianmales = 0.970, Wilcoxon W = 1138, p = 0.165) and
Data Index EVS Male model EVS Female model
SRMR (medianfemales = 0.021, medianmales = 0.020, Wilcoxon
Training χ2 188.684 (12.190) 340.798 (17.489) W = 1354, p = 0.992) indices were not statistically different
CFI 0.964 (0.003) 0.965 (0.002) from their respective counterparts in the male models. How-
RMSEA 0.038 (0.001) 0.043 (0.001)
ever, they did have a higher RMSEA (medianfemales = 0.022,
SRMR 0.016 ( 0.95, RMSEA values < 0.05, and SRMR values < 0.08 on riment of health. Combining the above two, the estimate of the
the test data set (Table 1 and Fig. 1a). These results indicate that total and indirect effect of Early life adversity on Reproduction-
the discrepancies between the observed covariance matrices on maintenance trade-off indicates that the indirect effect is sig-
the test data and the model-implied covariance matrices on the nificant but accounts for a small portion of the total effect
training data were minimal (RMSEA), and that the models per- (~4.5%). Comparing the male and female models reveals that all
formed better than their null versions including only the variance effects point in the same direction in both models. In the female
of the indicators as parameters fitted on the test data (CFI, model however, the relationship between the latent constructs
SRMR). This is also corroborated by the random fits, which show and their indicators, as well as the relationships between these
the degree to which the models failed to predict test data whose constructs, are stronger (or are equally strong) relative to the
internal structure was decomposed using random permutations. male model.
6 HUMANITIES AND SOCIAL SCIENCES COMMUNICATIONS | (2022)9:52 | https://doi.org/10.1057/s41599-022-01066-yTable 2 EVS models.
EVS Male model
Model part Latent variables Indicators Unstd. est. CI se z p Std. est.
Measurement model Early life adversityARTICLE HUMANITIES AND SOCIAL SCIENCES COMMUNICATIONS | https://doi.org/10.1057/s41599-022-01066-y
Table 3 ESS models. mortality to similar extents. As for the male model, the
Reproduction-maintenance trade-off correlates in a consistent way
with each of its 3 indicators as well. Indeed, female respondents
Data Index ESS Male model ESS Female model
who score high on this latent report a poorer health, reproduced
Training χ2 22.109 (5.225) 21.525 (4.508) earlier, and have more children. The structural model further
CFI 0.993 (0.003) 0.996 (0.001) indicates that Early life adversity is significantly and positively
RMSEA 0.012 (0.002) 0.010 (0.002)
related to Time orientation, meaning that in women, greater levels
SRMR 0.009 (0.001) 0.007 (0.001)
Test χ2 40.409 (13.522) 36.085 (10.366)
of adversity are associated with a more present-oriented world-
CFI 0.971 (0.021) 0.989 (0.010) view. Time orientation is also significantly and positively related
RMSEA 0.014 (0.007) 0.010 (0.006) to the Reproduction-maintenance trade-off latent, suggesting that
SRMR 0.025 (0.004) 0.022 (0.003) in women, a stronger orientation towards the present is asso-
Random χ2 365.720 (61.269) 522.518 (71.897) ciated with greater investments in reproduction to the detriment
CFI 0.000 (0.000) 0.000 (0.000) of health. Putting the above two together, the estimation of the
RMSEA 0.070 (0.007) 0.074 (0.006) total and indirect effect of Early life adversity on Reproduction-
SRMR 0.075 (0.005) 0.081 (0.004) maintenance trade-off indicates that the indirect effect is sig-
Stratified fivefold cross-validation. Values are medians over 50 iterations, values in brackets are
nificant but represents a small part of the total effect (~2.9%).
median absolute deviations. Overall, comparing the male and female models reveals that most
effects point in the same direction. The female model, however,
overall has larger or equal effect sizes in all relationships. This is
ESS data set true both for the measurement and structural models.
Cross-validated goodness of fit. Both the male and female
models provide an excellent fit. This is supported by scaled CFI
Nonlinear effects of perceived control and time orientation.
values > 0.95, RMSEA values < 0.05, and SRMR values < 0.08 on
Visualising the relationships between the latent constructs of the
the test data set (Table 3 and Fig. 2a). These results indicate
EVS and ESS male and female models reveals an interesting and
that the discrepancies between the observed covariance matri-
unexpected pattern (see Supplementary Figs. S1 and S2): whereas
ces on the test data and the model-implied covariance matrices
there is an approximately linear decrease in the Reproduction-
on the training data are minimal (RMSEA), and that the
maintenance trade-off and Early life adversity latent scores with
models performed better than their null versions including only
increasing Perceived control and Time orientation scores, this
the variance of the indicators as parameters fitted on the test
trend seems to break somewhat at more extreme values of the
data (CFI, SRMR). This is also corroborated by the random fits,
latter variables, especially for women. In order to quantify these
which show the degree to which models fail at predicting test
effects we ran a series of exploratory mixed-effects models. These
data whose internal structure is broken down by means of
post-hoc analyses first revealed that, for both males and females,
random permutations. The model fits are overall better for the
the model that best fitted the association of Perceived control with
female models. The female models have significantly higher
Early life adversity as well as with Reproduction-maintenance
CFI (medianfemales = 0.989, medianmales = 0.971, Wilcoxon
trade-off was a degree 3 polynomial (cubic) model that included
W = 613, p < 0.001), lower SRMR (medianfemales = 0.025,
linear, quadratic and cubic terms as fixed-effects (see Supple-
medianmales = 0.022, Wilcoxon W = 2031, p < 0.001) and
mentary Tables S4 and S5). Similarly, for both males and females,
RMSEA indices (medianfemales = 0.010, medianmales = 0.014,
the model that best fitted the association of Time orientation with
Wilcoxon W = 1883, p < 0.001).
Early life adversity as well as with Reproduction-maintenance
trade-off was a degree 2 polynomial (quadratic) model that
Male model parameters. In the male model (Table 4 and Fig. 2b,
included both a linear and a quadratic term as fixed-effects (see
c), the measurement model shows that none of the three indi-
Supplementary Tables S6 and S7).
cators of the composite Early life adversity has a convincing
predictive weight on the other variables of the model. However,
the Reproduction-maintenance trade-off latent variable shows a Control analyses for respondents without children. To make
good consistency in this male model, with respect to its EVS sure that our results were not biased by our initial decision to
counterpart. Indeed, the latent correlates positively with the exclude respondents without children from the analyses, we
Health indicator, negatively with the Age at 1st reproduction carried out a set of control analyses, in which we included
indicator, and positively with the Number of children indicator. childless respondents and used FIML to also include these par-
Therefore, male respondents who score high on the latent tially complete cases during parameter estimation. The inclusion
Reproduction-maintenance trade-off report a poorer health, of childless respondents led to larger sizes of the EVS (females:
reproduced earlier, and have more children. The structural N = 34,510; males: N = 27,414) and ESS (females: N = 23,941;
model confirms that Early life adversity is not significantly males: N = 20 584) samples. Both the EVS and ESS control
related to either Time orientation or Reproduction-maintenance models had extremely similar goodness of fit indices to our main
trade-off. It shows however that Time orientation is significantly results (Supplementary Tables S8 and S10). Parameter estimates
and positively related to the Reproduction-maintenance trade-off in the female models were also qualitatively unchanged (Sup-
latent, suggesting that in men, more present orientation is plementary Tables S9 and S11). The only notable differences were
associated with greater investments in reproduction to the observed in the male models in both datasets. In the EVS control
detriment of health. Given the complete absence of effects of male model, the association between the Reproduction-
Early life adversity in this model, the indirect and total effects maintenance trade-off latent and the Number of children indi-
are not discussed. cator became statistically significant. In the ESS control male
model, we also observed a number of changes. The contribution
Female model parameters. In the female model (Table 4 and of Experienced mortality to the Early life adversity composite
Fig. 2b, d), the measurement part indicates that the predictive became statistically significant, which suggests that in our main
power of the composite Early life adversity is driven by Human models, the absence of such a contribution was due to the lack of
capital deprivation, Economic capital deprivation and Experienced positive cases on the Experienced mortality variable. The positive
8 HUMANITIES AND SOCIAL SCIENCES COMMUNICATIONS | (2022)9:52 | https://doi.org/10.1057/s41599-022-01066-yTable 4 ESS models.
ESS Male model
Model part Latent variables Indicators Unstd. est. CI se z p Std. est.
Measurement model Early life adversityARTICLE HUMANITIES AND SOCIAL SCIENCES COMMUNICATIONS | https://doi.org/10.1057/s41599-022-01066-y
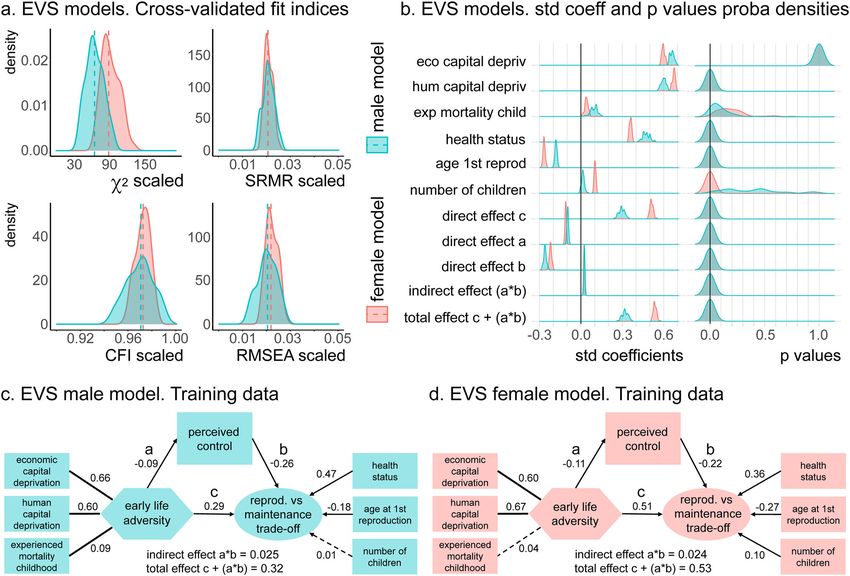
Fig. 1 EVS models. Main results. a Distributions of the goodness-of-fit indices of the male and female models cross-validated on the test datasets. Vertical
lines indicate the median. b Distributions of the standardised coefficients and associated p-values of the indicators (see rectangles in panel c) estimated
from fitting the model to the training datasets. The indirect effect represents the part of the effect of Early life adversity on the Reproduction-maintenance
trade-off that is routed through Perceived control. c, d Structures and standardised parameters (median values) of the male (c) and female (d) models
estimated from fitting the training datasets. Ellipses represent latent variables, rectangles represent their indicators, composite variables and direct
measures. Significant paths are represented by bold lines and arrows.
relationship between Early life adversity and Time orientation, measurement of early life adversity is extremely challenging with
and between Early life adversity and the Reproduction- our current conceptual models (Smith and Pollak, 2021). As a
maintenance trade-off also reached the conventional significance consequence, we only found weak support for our main
level. As a result, so did the overall indirect and total effects. Effect hypothesis: only a small proportion of the positive association
sizes in all models also tended to be larger in the control models. between adverse childhood conditions and the reproduction-
Thus, these control analyses indicated that our findings are robust maintenance trade-off is mediated by perceived control. Inter-
to the inclusions of childless subjects. estingly, a similar set of results emerged from the application of
the same cross-validated SEMs to the independent data set of the
European Social Study, with time orientation taken as the med-
Discussion iator of the association between early life adversity and the
In this study, we investigated two psychological traits—perceived reproduction-maintenance trade-off. At least in the female sam-
control and time orientation—that possibly mediate the effect of ple, adverse childhood environments were weakly associated with
early life adversity on reproductive behaviour and health status. a present-oriented worldview (a moderate negative effect of
To do so, we made use of a cross-validated structural equation current income was however detected: median std.coeff = −0.18;
modelling analysis on a large, public survey database, the Eur- median p < 0.001), which in turn was moderately associated with
opean Values Survey (EVS). Confirming previous studies the reproduction-maintenance trade-off described above. How-
(Brumbach et al., 2009; Mell et al., 2018; Nettle, 2011), we found ever, the mediating effect of time orientation in the association
that deprivation in human and economic capital is associated between early life adversity and the reproduction-maintenance
with poorer health, earlier reproduction and a higher overall trade-off is again weak. In the male sample, these effects were
number of children. Importantly, our models also revealed a simply absent.
moderate effect of perceived control on the shape of a hypothe- Contrary to our initial hypotheses, these results suggest that
tical trade-off between reproductive and maintenance traits. early life adversity, perceived control and time orientation impact
However, the effect of early life adversity on perceived control reproductive timing, fertility and health status in a relatively
was small. The effect of current income on this psychological trait independent manner. This is mainly due to the fact that perceived
was of a similar magnitude, suggesting that the ecological factors control and time orientation are weakly associated with our early
(past or current) that we used here are only weak proxies for the life adversity latent factor. A possible explanation of these weak
experiences that actually influence this trait. Indeed, the accurate associations is that the way perceived control and time
10 HUMANITIES AND SOCIAL SCIENCES COMMUNICATIONS | (2022)9:52 | https://doi.org/10.1057/s41599-022-01066-yHUMANITIES AND SOCIAL SCIENCES COMMUNICATIONS | https://doi.org/10.1057/s41599-022-01066-y ARTICLE Fig. 2 ESS models. Main results. a Distributions of the goodness-of-fit indices of the male and female models cross-validated on the test datasets. Vertical lines indicate the median. b Distributions of the standardised coefficients and associated p-values of the indicators (see rectangles in panel c) estimated from fitting the model to the training datasets. The indirect effect represents the part of the effect of Early life adversity on the Reproduction-maintenance trade-off that is routed through Time orientation. c, d Structures and standardised parameters (median values) of the male (c) and female (d) models estimated from fitting the training datasets. Ellipses represent latent variables, rectangles represent their indicators, composite variables and direct measures. Significant paths are represented by bold lines and arrows. orientation are measured here could be too simplistic to accu- Other interesting features of our results are worth discussing. rately represent such complex psychological constructs. For First, while human and economic capital deprivation indicators example, some authors (Shapiro et al., 1993) argue that perceived were robustly associated with our latent composite adversity, control (as well as time orientation, (Zimbardo and Boyd, 2015) experienced mortality was not (the only exception was with the might be better conceptualised as a combination of several ESS female model). Previous studies have shown mortality to be dimensions such as locus of control (i.e., the degree to which similarly associated with other adversity variables (Mell et al., individuals believe that they, as opposed to external factor such as 2018). This could be the result of relatively little variation in this chance or other agents, have control over their lives, Rotter, 1966; measure in the industrialised and affluent European countries Lefcourt, 1976), self-efficacy (i.e., a person’s ability to cope with a that constitute the EVS data set. Furthermore, our extrinsic given situation based on the skills he or she possesses and the mortality variable is indexed to the loss of the respondents’ circumstances he or she faces, Bandura, 1977), learned help- parents, which provides a very restricted view of what the true lessness (i.e., acceptance of powerlessness after repeated exposure extrinsic mortality rate really is. Alternatively, there may be a to harsh events, Maier and Seligman, 1976), and desire of control. meaningful dissociation between the economic and social vari- In other words, a more precise measure of perceived control and ables on the one hand, and experienced mortality on the other. time orientation might have increased our chance of detecting an One important difference is that mortality is a more objective association between these constructs and early life adversity, an measure, whereas the other variables we used reflect more sub- association often reported in the literature (Culpin et al., 2015; Di jective judgments about relative deprivation. Interestingly, a Pentima et al., 2019; Kraus et al., 2012; Pepper and Nettle, 2017). recent study found that subjective indicators of SES were more Nevertheless, this explanation is challenged by the robust asso- strongly associated with a number of health and well-being out- ciations we found between perceived control and time orientation comes than objective indicators (Rivenbark et al., 2020). with the reproduction-maintenance trade-off. An alternative Second, we found important differences between the models explanation of the weak associations described above is that they fitted separately on male and female data. Overall, the model fit represent the visible end of broader correlations encompassing was better on the female data. This was notably caused by the fact higher levels of adversity than those found in the Western, that the number of children was significantly associated with the industrialised, and affluent countries that comprise our two reproduction-maintenance trade-off only in the female model, datasets. If this is true, running our models on more diverse hence making the factorial structure of this latent variable more samples could help validate our initial hypotheses. robust than in the male model. One plausible explanation for this HUMANITIES AND SOCIAL SCIENCES COMMUNICATIONS | (2022)9:52 | https://doi.org/10.1057/s41599-022-01066-y 11
ARTICLE                                  HUMANITIES AND SOCIAL SCIENCES COMMUNICATIONS | https://doi.org/10.1057/s41599-022-01066-y

difference is the fact that pregnancy itself is a reproductive trait        concluded that while some change in this trait was observable, it
that conveys direct maintenance costs for women (Jasienska et al.,          was rather stable in the observed period. This is even more
2017). Indeed, the number of pregnancies (parity) has been found            remarkable as adolescence is thought to be a period of con-
to be associated with markers of accelerated aging in women                 siderable developmental changes in various psychological traits.
(Ryan et al., 2018). In addition, parity is robustly associated with        Similarly, while Holman et al. (2016) have found that 34–48% of
increased risk of cardiovascular disease (Lawlor et al., 2003; Ness         the variance in Time perspective scales was due to changes
et al., 1993) and diabetes (Hinkula et al., 2006).                          within individuals across their observation period of 3 years, it
   Third, we have uncovered some unexpected nonlinearities                  might also be appreciated that the majority (52–66%) of the
between the latent constructs. Specifically, the shape of the rela-          variance was due to inter-individual long-term differences. In
tionship between Perceived control with both Early life adversity           conclusion, while certainly not unchanging, we believe that
and the Reproduction-maintenance trade-off followed a cubic                 existing research indicate that both Perceived control and Time
pattern; whereas the shape of the relationship between Time                 orientation are stable enough constructs, for our analyses to be
orientation and both Early life adversity and the Reproduction-             meaningful (Holman et al., 2016; Kulas, 1996). Second, other
maintenance trade-off followed a quadratic pattern. These non-              studies with longitudinal designs have also provided support for
linear patterns could result from some methodological artefacts,            time-dependent associations between early life adversity and the
but they could also reveal a meaningful effect so far unaccounted           development of reproductive physiology (Amir et al., 2016). An
for. Based on recent evidence of increased competences in indi-             additional caveat of our work is related to the fact that the
viduals who have experienced more adversity (Frankenhuis and                EVS and ESS datasets are by definition restricted to European
Nettle, 2020; Ellis et al., 2020), an intriguing possibility is that the    countries. Cross-cultural variability should not be under-
nonlinear patterns we characterised above are, in these indivi-             estimated when considering supposedly universal phenomena
duals, the outcomes of an increased sense of confidence in their             (Henrich et al., 2010). Our results therefore need to be replicated
own abilities. More specifically, some individuals who have                  in a more diverse sample, which would include non-Western
experienced significant adversity might develop better abilities in          and non-industrialised societies. Note however that previous
certain cognitive and behavioural domains (e.g., threat detection,          studies working with more culturally diverse groups of subjects
task set shifting). The increased sense of control and present              have shown that environmental adversity (measured directly or
orientation observed at the highest scores of early life adversity          indirectly) impacts cognition (e.g., intertemporal choice) and
and reproduction-maintenance trade-off could then be the result             behaviour (social and academic behaviours) in relatively similar
of (accurate) perception of these increased abilities: individuals          ways across these groups (Bulley and Pepper, 2017; Chang et al.,
feel (and may in fact be) well equipped to deal with challenges             2019; Lee et al., 2018).
found in adverse conditions and would therefore experience                     In conclusion, our study contributes to elucidating the complex
greater control over events that affect their lives. Alternatively,         effects of early life adversity on human psychology. Theory sug-
these observations could be simple methodological artefacts. For            gests that perceived control and time orientation may be two
example, if respondents were unable to answer the perceived                 important psychological traits that mediate the effects of adversity
control or time orientation item questionnaire accurately (either           in health and reproduction. Individuals may be less willing to
because they did not understand the wording or because they                 invest in long-term strategies such as health maintenance when
were under high cognitive load and could not deliberate thor-               they believe that their lives, and the events that affect them, are
oughly), they might have responded with the maximum score. In               not under their own control. Instead, they might invest in
this case, respondents with a perceived control score of 10 (or a           activities that offer more immediate fitness benefits, such as
time orientation of 0) would reflect both people who deliberately            reproduction. We tested this hypothesis using a public survey
and accurately answered in this way and those who got it wrong,             data set and cross-validated structural equation models and found
and whose actual scores would be distributed throughout the                 some support for it. Nevertheless, the small effect size indicates
range of the variable.                                                      that much work remains to be done to fully characterise the
   Finally, our study also presents important limitations. Owing            relevant constructs and trade-offs.
to the correlational nature of the EVS and ESS datasets, it is
impossible to draw any conclusions about causality from our
results. Individuals with a generally lower perceived control may           Data availability
be more likely to experience economic and social adversity, and             The EVS and WVS data used in the present study are respectively
people who favour reproductive goals over health goals may be               available at http://www.worldvaluessurvey.org/WVSDocumentation
more likely to have less control over their lives, rather than the          WVL.jsp and at https://dbk.gesis.org/dbksearch/sdesc2.asp?no=
other way around. However, this interpretation is unlikely to               4804&db=e&doi=10.4232/1.12253. The imputed EVS and WVS
hold for several reasons. First, data were collected on adversity           data used in the present study, the R codes developed to extract and
experienced during childhood, rather than currently. It is unli-            pre-process the data, to perform multiple imputations, to fit and
kely that the current perceived control retrospectively affects             cross-validate the models on the imputed data files are available at
past experience, even though in the EVS and the ESS surveys,                https://osf.io/dh4jq/.
self-reported past experience may be corrupted by some sources
of noise, such as social desirability effects or distorted memories.        Received: 16 July 2021; Accepted: 18 January 2022;
Moreover, a crucial assumption underlying our model is that
Perceived control and Time orientation are relatively stable life
traits. This is certainly not true, as multiple studies have shown
within-individual variability in time in both of these constructs
(Holman et al., 2016; Trommsdorff et al., 1979). It is very likely          References
that this fact is partially responsible for the weak indirect effects.      Amir D, Jordan MR, Bribiescas RG (2016) A longitudinal assessment of associa-
However, the mere existence of such variability does not entirely                tions between adolescent environment, adversity perception, and economic
                                                                                 status on fertility and age of menarche. PLoS ONE 11(6):e0155883. https://
preclude the existence and the investigation of longer-term                      doi.org/10.1371/journal.pone.0155883
associations. For example, Kulas (1996) has measured Locus of               Arlot S, Celisse A (2010) A survey of cross-validation procedures for model
control over a 3-year-period in an adolescent sample and                         selection. Stat Survey 4:40–79. https://doi.org/10.1214/09-SS054

12                          HUMANITIES AND SOCIAL SCIENCES COMMUNICATIONS | (2022)9:52 | https://doi.org/10.1057/s41599-022-01066-y
You can also read