Do Photovoltaic Energy Systems Increase Home Values? - Ben Hoen Lawrence Berkeley National Laboratory October 1st, 2011
←
→
Page content transcription
If your browser does not render page correctly, please read the page content below
Do Photovoltaic Energy
Systems Increase
Home Values?

Ben Hoen
Lawrence Berkeley National Laboratory
October 1st, 2011
Lawrence Berkeley National Laboratory
Member of the National Laboratory System supported by the U.S.
Department of Energy through its Office of Science.
Located in Berkeley, California
Founded in 1931 by Ernest Orlando Lawrence
Annual Budget of $811 Million
4,200 Employees and 800 University Students
11 Nobel Laureates
24 Divisions and Departments

“To achieve our energy and climate goals, we need a strong and sustained commitment to
research and development. These investments are needed for our country’s future economic
prosperity, energy security, and environmental sustainability”
                                                 Steven Chu, Secretary of Energy, January 21, 2010

                                                                                                2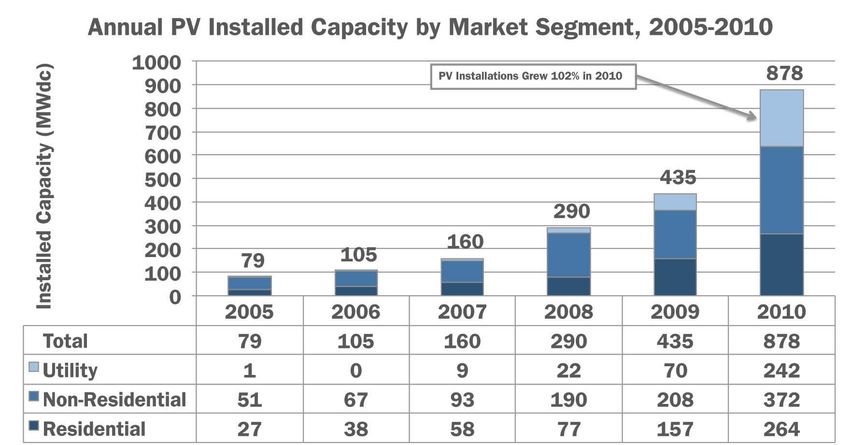
Do Photovoltaic Energy Systems Increase
              Home Values?
• Residential PV Market Summary
• There Are Still Significant Market Barriers
• Previous Literature On Impacts To Home Values
• LBNL Research Findings
• Where Do Stakeholders Go From Here?
• Questions?
                                                  3
What is a Watt?
• A Watt is a unit of electrical
  energy (or “power”).
• PV systems are rated based on
  the amount of Watts they can      5,000 Watts
  produce under perfect
  conditions.
• The higher the Watt rating, the
  more energy a PV system will
  produce.
• PV systems are priced in
  dollars per Watt or $/Watt        50,000 Watts
                                                   4
Average Gross Installed Costs For
Residential PV Have Declined Through 2010

       Source: Lawrence Berkeley National Laboratory (2011) Tracking the Sun III
                                                                                   5
Average Net Installed Costs Have Remained
     Fairly Flat Through 2008 Near $5/Watt
Yet Declined Sharply Thru 2010 To Near $4/Watt

  Net Installed Cost = Average cost of installing PV, after deducting available state/federal incentives

                Source: Lawrence Berkeley National Laboratory (2011) Tracking the Sun III                  6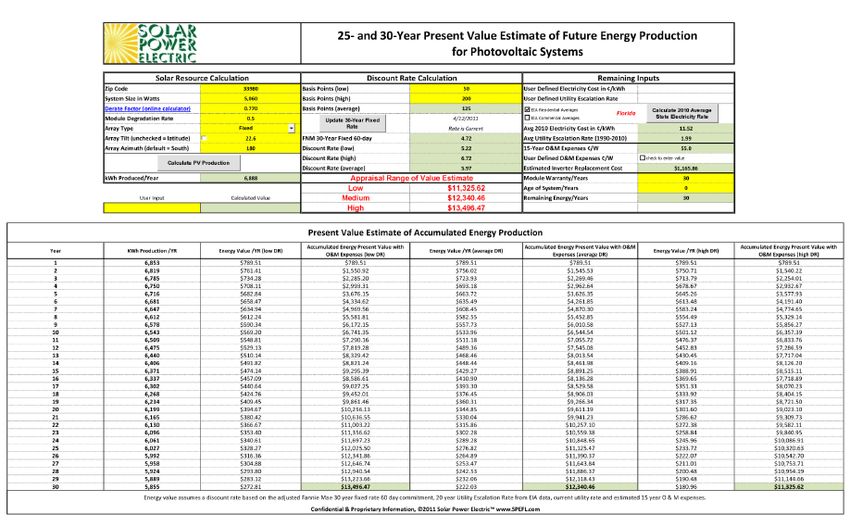
Solar PV Installations Have Been Increasing
Dramatically In The US, Including Residential

 Source: Solar Energy Industries Association, U.S. Solar Market Insight™: 2010 Year-In-Review
                                                                                                7
Through 2011 There Are 150,000 Residential Installations.
   Mostly In California, Yet Other States Are Growing
                            9,983
     By Frequency
                                         9,468
                                                                 Cumulative Residential
                                                 7,479
                                                                    PV Installations
                                                    5,029            as of 2011 Q1
                                                         4,902
                                                                       California - 60%
                                                                       Arizona - 7%
                                                                       New Jersey - 6%
                                                         23,104        Colorado - 5%
                                                                       New York - 3%
   90,790
                                                                       Hawaii - 3%
                                                                       All Other States - 15%

                                       Total = 150,755
 Source: Solar Energy Industries Association
                                                                                                8
Do Photovoltaic Energy Systems Increase
              Home Values?
• Residential PV Market Summary
• There Are Still Significant Market Barriers
• Previous Literature On Impacts To Home Values
• LBNL Research Findings
• Where Do Stakeholders Go From Here?
• Questions?
                                                  9
Barriers To PV Adoption Are Multi-Faceted
• Lack of government policy
• Lack of consumer awareness
• High cost of solar
• Difficulty overcoming established energy systems
• Inadequate financing options
• Failure to account for all costs and benefits of energy choices
• Inadequate workforce skills and training
• Lack of adequate codes, standards, and interconnection and net-
  metering guidelines
• Poor perception by public of renewable energy system aesthetics
• Lack of stakeholder/community participation in energy choices
    Source: National Renewable Energy Lab, 2006
                                                                    10
There Is A Perception That
PV Systems Are Expensive
Survey of residents of
Santa Clara County, CA
• Santa Clara has 15 MW of PV
installed (~3,000 systems), and
therefore a high likelihood of PV
familiarity
• 82% perceived PV as “expensive”
• 11% perceived PV as “affordable”
Source: www.SolarTech.org
11Homeowners/Builders May Be Hesitant To
Invest Given Uncertain Resale Values
12Although Change is Proposed, Appraisers
Have Been Slow To Account For Energy
Features In Their Residential Valuations
13Do Photovoltaic Energy Systems Increase
Home Values?
• Residential PV Market Summary
• There Are Still Significant Market Barriers
• Previous Literature On Impacts To Home Values
• LBNL Research Findings
• Where Do Stakeholders Go From Here?
• Questions?
14Nevin & Watson (1998)
"Evidence of Rational Market Values for Home Energy Efficiency"
• Multiple models with sample sizes
ranging from 600 to 46,000 across
various parts of the country
• Concluded 20:1 reasonable
average for sales price to energy
savings ratio given a 5% after tax
mortgage rate
• This implies for every $1 saved via
energy efficiency the home’s value
is increased by $20
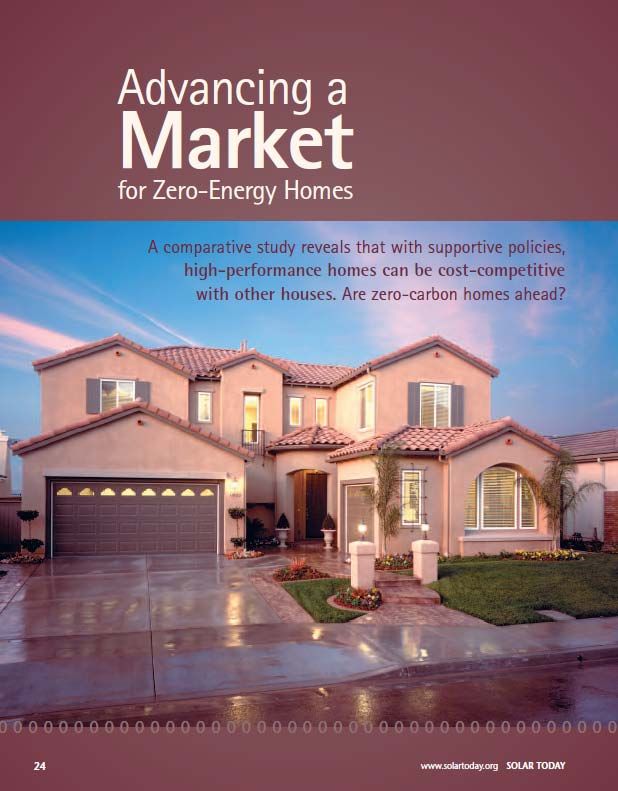
15Farhar and Coburn (2008)
“A New Market Paradigm
for Zero-Energy Homes:
A Comparative Case Study"
16Dastrop, Ziven, Costa & Kahn (2010)
“Understanding the Solar Home Price Premium"
• Investigated 279 PV homes that
sold in Greater San Diego
• Found significant difference
between PV and non-PV sales
prices
• Premiums of approximately
3.5% for PV homes found
• Equates to approximately $4.40
per installed watt (DC)
17Do Photovoltaic Energy Systems Increase
Home Values?
• Residential PV Market Summary
• There Are Still Significant Market Barriers
• Previous Literature On Impacts To Home Values
• LBNL Research Findings
• Where Do Stakeholders Go From Here?
• Questions?
18Hoen, Wiser, Cappers & Thayer (2011)
“An Analysis of the Effects of Residential Photovoltaic Energy
Systems on Home Sales Prices in California"
• Build on available literature
• Investigate selling prices of
homes with PV relative to
comparable non-PV homes
• Concentrate on California PV but
across multiple counties
• Use a variety of different tests to
determine premiums
19PV Sales Data Are Well Arrayed Across California, Among
Home Types, Utility Service Areas, And Years
72,319 homes: 70,425 non-PV; 1,894 PV
• 31 Counties
• 4 Different Utility
Service Areas: PG&E,
SCE, SDG&E, SMUD
• 11 Years: 1999-2009
• 50% New Homes
50% Existing Homes
20Estimated $/Watt (DC, STC) Premiums For
The Full Sample Are Between $3.9 and $6.4
$10 Base Models
Estimated Sale Price Premium For Average
Subdivision Robustness Models
$9
California PV Home (in $/Watt DC)
Matched Robustness Models
$8 PV Only Robustness Model
$7
$6
$5
$4
$3
$2
$1
$5.5 $5.4 $3.9 $5.8 $5.6 $4.8 $6.4
$0
Fixed Effect Continuous Effect
Hedonic Model Hedonic Model
21Buyers And Sellers Might Be Using
Net Installed Costs As A Price Signal
$10 Base Models
Estimated Sale Price Premium For Average
Mean Net Installed Subdivision Robustness Models
$9
California PV Home (in $/Watt DC)
Costs For Residential Matched Robustness Models
$8 PV Systems in CA PV Only Robustness Model
(2001 - 2009)
$7
$6
$5
$4
$3
$2
$1
$5.5 $5.4 $3.9 $5.8 $5.6 $4.8 $6.4
$0
Fixed Effect Continuous Effect
Hedonic Model Hedonic Model
22Large Differences In Premiums Were Found
Between New and Existing Homes
$10
Estimated Sale Price Premium For All, New &
Existing California PV Homes (in $/Watt DC)
$9 New Homes
$8 Existing Homes
$7
$6
$5
$4
$7.7
$3 $6.5 $6.4
$2
$1 $2.3 $2.6 $2.6
$0
Base Subdivision Robustness Matched Robustness
Hedonic Models Hedonic Models Hedonic Models
23Differences Might Be Partly Explained By
Disparity In Net Installed Costs
$10
Estimated Sale Price Premium For All, New &
Exizitng California PV Homes (in $/Watt DC)
$9 Mean Net Installed Costs
New Homes For Residential PV
$8
Existing Homes existing Systems in CA
$7 homes (2007 - 2009)
$6
$5
$4
$7.7
$3 $6.5 $6.4
$2 new
homes
$1 $2.3 $2.6 $2.6
$0
Base Subdivision Robustness Matched Robustness
Hedonic Models Hedonic Models Hedonic Models
24Disparities Might Be Explained By Other
Factors Besides Net Installed Cost
New Homes Existing Homes
Increased sales velocity? Highest price?
Sales agent less familiarity Homeowner more familiarity
with PV? with PV?
Group PV Differentiate PV
with other features? from other features?
Less expensive homes = More expensive homes =
less discretionary income? more discretionary income?
25LBNL Report Conclusions
• CA PV homes sold for more than non-PV homes
• Average premiums were ~$5.5 per Watt
• Existing home premiums were even higher, and new home
premiums were lower
• New vs. existing premiums may be partly explained by net
installed costs, but also related to varying buyer/seller
motivations (e.g., sales velocity)
26Do Photovoltaic Energy Systems Increase
Home Values?
• Residential PV Market Summary
• There Are Still Significant Market Barriers
• Previous Literature On Impacts To Home Values
• LBNL Research Findings
• Where Do Stakeholders Go From Here?
• Questions?
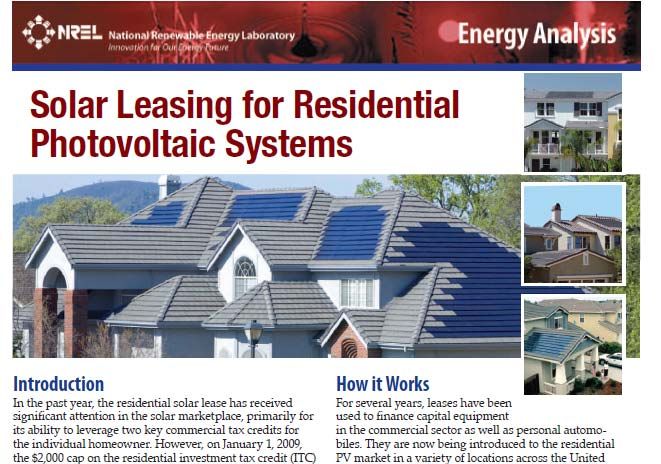
27Residential Solar Leasing Allows Consumers To Pay
Very Little Yet Have A PV System On Their Home
Source: National Renewable Energy Laboratory, www.nrel.gov/docs/fy09osti/43572.pdf 28Residential Solar Leasing
29For Homeowners Who Want to Own A PV System
Low-Interest Loan Options Are Often Available
Database of
State
Incentives for
Renewable
Energy
www.dsireusa.org 30For California Homeowners Who Own A PV System
Or Are Considering It, A Valuation Tool Is Available
http://www.gosolarcalifornia.org/tools/save.php
31A National PV Valuation Tool Will Be
Available Soon
www.spefl.com and http://www.sandia.gov/pv
32Appraisal Institute Has
A Variety Of Courses On How To Analyze
The Value of “Going Green”
www.appraisalinstitute.org
33Therefore Finding A Local Appraiser With
Experience In Valuing Green Building and
Energy Efficiency Features Is Easier
www.appraisalinstitute.org
34Conclusions
• PV Costs are coming down
• Installations are increasing but there are still barriers
• Perceived price and ROI are important
• New data suggests PV home selling price premiums near net
installed costs
• Options are emerging to pay $0 down, and finance at a low
interest rate.
• New tools are available to estimate selling price based on
energy savings
• Growing number of appraisers with experience are available
35Do Photovoltaic Energy Systems Increase
Home Values?
• Residential PV Market Summary
• There Are Still Significant Market Barriers
• Previous Literature On Impacts To Home Values
• LBNL Research Findings
• Where Do Stakeholders Go From Here?
• Questions?
36Questions?
Ben Hoen
Lawrence Berkeley National Laboratory
845-758-1896, bhoen@lbl.gov
Link to report, 2-page summary, and presentation
http://eetd.lbl.gov/ea/emp/re-pubs.html
37Citations
Barbose, G., Darghouth, N. and Wiser, R. (2010) Tracking the Sun III: The Installed Cost of Photovoltaics in the U.S.
From 1998-2009. Lawrence Berkeley National Laboratory, Berkeley, CA. December 2010. 54 pages. LBNL-4121E.
Dastrop, S., Zivin, J. G., Costa, D. L. and Kahn, M. E. (2011) Understanding the Solar Home Price Premium: Electricity
Generation and “Green” Social Status. NBER Working Paper Series. Prepared for National Bureau of Economic
Research, Cambridge, MA. July 2011. 30 pages. Working Paper 17200.
Farhar, B. and Coburn, T. (2008) A New Market Paradigm for Zero-Energy Homes: A Comparative Case Study.
Environment: Science and Policy for Sustainable Development 50(1): 18-32.
Hoen, B., Cappers, P., Wiser, R. and Thayer, M. (2011) An Analysis of the Effects of Photovoltaic Energy Systems on
Residential Selling Prices in California. Lawrence Berkeley National Laboratory, Berkeley, CA. April, 2011. 46 pages.
LBNL-4476E.
Johnson, R. C. and Kaserman, D. L. (1983) Housing Market Capitalization of Energy-Saving Durable Good Investments.
Economic Inquiry. 21: 374 - 386.
National Renewable Energy Laboratory (NREL) (2009) Solar Leasing for Residential PV Systems. Golden, CO. 6 pages.
NREL/FS-6A2-43572.
Nevin, R. and Watson, G. (1998) Evidence of Rational Market Values for Home Energy Efficiency. The Appraisal
Journal. 68: 401-409.
Solar Energy Industries Association (SEIA) and GTM Research (GTM) (2011) U.S. Solar Market Insight - 2010 Year in
Review. GTM Research (GTM) in Boston MA. Prepared for Solar Energy Industries Association (SEIA), Washington,
DC.
SolarTech (2011) Solar PV Adoption Consumer Attitudes: Study and Recommendations for Marketing to Residential
Consumers. Prepared for SolarTech, San Jose, CA. April 2, 2011.
38You can also read