Does Functionality Condition the Population Structure and Genetic Diversity of Endangered Dog Breeds under Island Territorial Isolation? - MDPI
←
→
Page content transcription
If your browser does not render page correctly, please read the page content below
animals
Article
Does Functionality Condition the Population
Structure and Genetic Diversity of Endangered Dog
Breeds under Island Territorial Isolation?
José Manuel Alanzor Puente 1 , Águeda Laura Pons Barro 1 , Manuel Rafael de la Haba Giraldo 2 ,
Juan Vicente Delgado Bermejo 2 and Francisco Javier Navas González 2, *
 1   Serveis de Millora Agrària i Pesquera (SEMILLA), Producció Agrària del Àrea Tècnica Àgraria,
     Conselleria d’Agricultura, Pesca i Alimentació, Majorca, Govern Illes Balears, 07009 Palma, Spain;
     jalanzor@semilla-caib.es (J.M.A.P.); apons@semilla-caib.es (Á.L.P.B.)
 2   Department of Genetics, Faculty of Veterinary Sciences, University of Córdoba, 14071 Córdoba, Spain;
     ge1hagim@uco.es (M.R.d.l.H.G.); juanviagr218@gmail.com (J.V.D.B.)
 *   Correspondence: fjng87@hotmail.com; Tel.: +34-651-679-262

 Received: 19 September 2020; Accepted: 8 October 2020; Published: 16 October 2020

 Simple Summary: Early references to Ca de Rater and Ca de Bestiar endangered autochthonous breeds
 were witnesses to their exceptional ratting/pet and shepherding/guard skills for centuries. Studbooks
 or associations promote an increase in the number of effectives and their genealogies. Genetic diversity
 parameters were evaluated along the history of definition of both dog breeds. Guard or hunting
 purposes condition an increased registration of genealogical information. Hunting animals have
 more complete genealogies and need more time to select breeding animals. Male guard dogs are
 preferred over females due to their suitability for guarding. Selection for performance acts as a
 diversity promoter and breeding policy driver. The uses or purposes for which certain breeds were
 selected condition the genetic diversity evolution of endangered breeds, even if these share the same
 geographic isolation conditions.

 Abstract: Despite the undefinition of the origins of Ca de Rater (CR) and Ca de Bestiar (CB) dogs, references
 to these endangered autochthonous breeds highlighted their ratting/pet and shepherding/guard
 skills for centuries. Genealogical historical records were traced back to founders. Founder number
 in the reference population (146 and 53 for CR and CB, respectively), historical and reference
 maximum generations traced (eight and seven for CR and CB, respectively), and historical average
 number of complete generations (1.04 for both breeds) were determined. Structure assessment
 revealed the existence of subpopulations regarding criteria such as breeders (75 and 17), breeder
 location (32 and eight), owners (368 and 198), and owner location (73 and 51) for CR and CB,
 respectively. Average inbreeding (F) within breed subpopulations ranged from 0.27–1.20% for CB
 breeders and the rest of subpopulation criteria for both breeds, respectively, except for CB owners and
 owner location. F ranged from 0.27–1.41% for CB historical population and CR current population,
 respectively. The study of genetic diversity revealed a relatively similar genetic background between
 subpopulations. Average coancestry between and within breeds suggested a similar evolutionary
 process. However, Mann–Whitney U test determined significant differences for diversity parameters
 (F, ∆R, coancestry, nonrandom mating degree, maximum, complete, and equivalent generations, ∆F,
 and genetic conservation index) between breeds and their functionalities. Conclusively, functionality
 in dog breeds may determine the genetic diversity evolution of endangered breeds, even when these
 share the same geographic isolation conditions.

 Keywords: ratting and hunting; guard and shepherding; functionality; conservation strategies;
 pedigree-based assessment; population structure

Animals 2020, 10, 1893; doi:10.3390/ani10101893                                  www.mdpi.com/journal/animals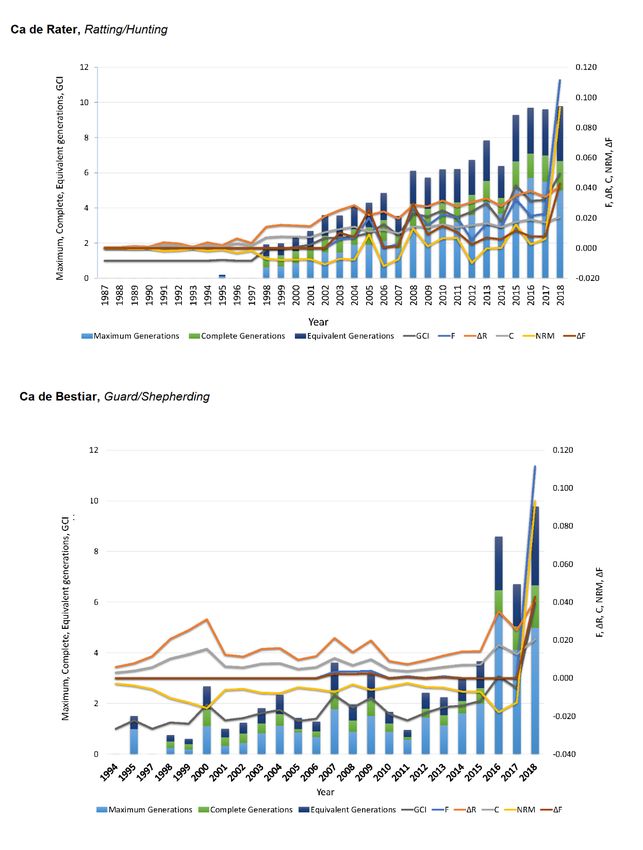
Animals 2020, 10, 1893                                                                              2 of 22

1. Introduction
      An analysis of the historical records of the Majorcan Ca de Rater (CR) suggests rather undefined
origins [1]. The first references of the CR breed were described by the Archduke Lluís Salvador
of Austria [2] around 150 years ago. Contextually, the study of its relationships with other canine
populations supports a presumable ancient origin [3] linked to the Egyptian trunk, which derived in a
fully functional ratting dog [4]. This labor not only provided the breed with its name—CR or Ratter
dog—but also accompanied and defined the connection of the breed with humans until now [4].
      The breed definition may have parallelly occurred with the Majorcan repopulations of Valencian
towns such as Taberna (Gallinera valley) in the 17th century, who potentially introduced a Majorcan
type of dog which fitted the morphology and purposes of a rat terrier [3]. Reciprocally, other authors
ascribe a more recent origin of the breed, to the arrival of Valencians in the Albufera (lagoon) of
Majorca to grow rice (to the town of Alcudia and its extension to the towns of Muro and Sa Pobla) at
the beginning of the 20th century. These new islanders [5] may be responsible for the introduction
and cross of their potentially morphologically and functionally affine animals with the individuals of
autochthonous Majorcan breeds [4], to exterminate the abundant rats of the area and their detrimental
effects on health and crops [1]. In line with this testimony, certain references named the breed as
Majorcan fox terrier, potentially suggesting its relationship with an English namesake [1].
      Gradually, CR spread across many other Spanish regions [4]. The influences received through
the process of conformation and definition of the current population made this dog an exceptional
companion animal. However, the main function for which CRs were bred and selected was its greater
ability to hunt rats and other nonhunting species [3]. Additionally, the use of CRs in rabbit hunting
started to be developed as an attempt to take advantage of their natural instinct toward capturing small
mammals or birds. The CR is used to search dirty and river banks where other larger-size hunting
breeds cannot access for rabbits, making using of its improved olfactory, sight, and hearing aptitudes,
resulting extremely useful in its application for hare coursing, partridge pointing, or thrush retrieving.
The breed’s reconsideration may be linked to the revalorization of sustainable traditional hunting
techniques, agricultural and natural area maintenance, and culture conservation.
      Ca de Bestiar (CB) origins are undefined [1]. The first morphological descriptions of the breed date
from the 19th century [4]. The oldest references suggest the breed could descend from the so-called
Alano or shepherd dog, highlighting its contribution and helpful role to the conquer of Majorca by
Jaime I of Aragon [1]. Another hypothesis [4] establishes the origins of the CB as being linked to mastiff
dog standards, as described by Archduke Lluís Salvador of Austria [2]. After these mastiffs were
introduced to Majorca and crossbred with local breeds, CB reduced its size and its character became
relatively less complex, making it suitable for the custody of autochthonous cattle and as a house
guardian against unwelcome visitors [4]. CB’s current and most relevant application as a shepherd
dog to drive all kinds of livestock (sheep, goats, pigs, cows, or even turkeys) conjoins with its role in
defending houses against strangers (potentially stemming from its former utilization as a fighting dog).
Shepherds used to spend almost all their lives alone in the mountains and needed protection against
other dogs and thieves; thus, testing dogs’ ability to protect them was a common practice.
      Despite the common traditional and popular recognition of both breeds, it would not be until the
1970s when the recovery and orderly breeding of these populations began. During the 1980s, the Board
of Native breeds of Majorca implemented programs to promote breed recovery. The Club of Ca de
Bestiar was unofficially established in 1978, although the breed standard was not drafted until 1980.
The standard established the characteristics and was used as a valid reference for determining both the
morphological and the phaneroptical adscription of animals to the population and to provide advice
on reproduction, which laid the basis for the breed’s recovery. The official recognition of the Club
of Ca de Bestiar did not occur until 2001, when Royal Decree 558/2001 was published. On the other
hand, the Spanish Club of Ca de Rater Mallorquí was set in 1990 but was not officially constituted
until 2001 (Royal Decree 558/2001). The standard of the breed was officially recognized in 2004 (APA
Order/807/2004). Since then, both breeds have been exposed to a high risk of loss of genetic diversity
Animals 2020, 10, 1893 3 of 22
resulting from a long process of breeding during which foreign breeds contributed to the loss of their
genetic identity from the 1950s [3]. This is a common framework, since, during their definition process,
many breeds are characterized by reduced genetic diversity related to a small number of founders.
This situation promotes the overrepresentation of the allelic pool of population founders in later
generations, as these animals often lay the basis for the breed standard.
Initial stages of breed morphofunctional standardization may promote the cross between close
relatives to find and fix the characteristics or qualities that define a breed. This initial mass selection is
carried out without considering the possible harmful effects derived from the loss of simultaneous
genetic diversity and the increase in other parameters such as inbreeding. Concerns on the potential
effects of inbreeding and reduced diversity on health, functionality, and welfare in dog breeds have led
to a call for improved genetic management practices [6]. Functionality or the purpose to which breeds
are aimed conditions the patterns that drive genetic diversity mechanisms. However, authors such as
Pedersen et al. [7] claim that the importance of functionality as a genetic diversity driving agent may
have become masked by other more popular factors such as conformation or morphology.
Dog breeds have traditionally been classified depending on their use, which tended to result
in some genetically unrelated breeds being grouped together, particularly when dogs of widely
different geographical origin were considered [8]. As a result, evaluating the function for which
breeds are currently used may virtually enable tracing back modern dog breeds to their origins [7].
Breeds traditionally linked to a certain functional purpose may have evolved in the context of the
original use on which the human–animal relationship was built (whether it was ratting, pointing,
retrieving, coursing, guarding, shepherding, racing, the hunting of unique types of game, or activities
as obscure as bull-baiting or even dog-fighting). The evolution of human necessities changed owner
and breeder priorities in terms of which qualities should be considered when selecting animals for
their function. This becomes especially patent in equines [9,10] and dogs [7] for which functionality
may have played a pivotal role. Breeding practices for conformation replaced better performance
criteria due to the displacement of several work breeds to assume a pet role.
When selecting for an enhanced performance, breeding practices may less likely lead to pronounced
changes in basic form and function and, hence, in the underlying diversity. Contrastingly, when selecting
for conformation, breeding practices may lead to significant changes in the appearance and performance
skills of many breeds, sometimes distorted to extremes [7]. Although, this situation may have affected
dog breeds through their uses worldwide, certain factors may have acted as mitigators or promoters of
genetic diversity processes. In this regard, the contextual situation of dog breeds, their worldwide
expansion, or their popularity may determine the conservation patterns to implement. Conditioning
factors of genetic diversity, such as functionality, can be decisive in guaranteeing the future of breeds.
Detailed genealogical information of endangered populations, their genetic diversity, the evaluation of
their population structure, and conservation practices or breeding policies implemented have become
indispensable tools for the development of conservation programs, as the value of reproductive
individuals is determined considering their ancestry, which strictly confers an economic basis to
inbreeding control and mating management.
For these reasons, the objectives of this work were as follows: (1) to study the evaluation of the
integrity of the historical pedigree record of CR and CB, controlling the repercussions of the ancestors
and founders; (2) to evaluate the current population structure, genetic variability, and the connections
between genetic and demographic parameters, measuring the existing genetic flow and quantifying
the risk of loss of genetic diversity, evaluating the degree of threat to which each breed is exposed to
suggest effective conservation and selection strategies; (3) to analyze whether functional criteria and
idiosyncrasies related to functional breeding may have conditioned genetic diversity and population
structure throughout the process of isolation and definition of each breed, even when they shared
a common territorial niche. This model can act as a tool to assess the degree of endangerment to
which dog breeds may be exposed, which may help implementing effective conservation strategiesAnimals 2020, 10, 1893 4 of 22
and selection practices that could be extensible to other populations of dogs and other endangered
small populations.
2. Materials and Methods
2.1. Animal Records and Software
The pedigree records used in this study were provided by the Ca de Rater Mallorquí Club (for CR)
and by the Associació de Criadors i Propietaris del Ca Pastor Mallorqui—Club del Ca de Bestiar (for CB).
The complete pedigree file includes 1810 animals (46.91% sires; 53.09% dams) born between January
1987 and September 2017 for the historical population of CR. Contrastingly, for CB, the historical
pedigree file includes 385 animals (49.61% sires; 50.39% dams) born between June 1994 and April 2018.
Genealogical information of each dog was traced back to its ancestors and analyzed. Molecular breed
assignment analyses were performed to check for breed assignment percentage (breed purity) and
to parallelly detect the potential introduction of other breeds to ensure the reliability of our results
using the International Society of Animal Genetics (ISAG) Dog core short tandem repeat (STR) panel
with 22 markers (Table S1, Supplementary Materials). The Canine ISAG STR Parentage Kit (2014) is an
optimized reagent kit for the analysis of the 22 short tandem repeat (STR) loci recommended by the
International Society of Animal Genetics (ISAG) in 2014 for canine parentage determination, allowing
us to check the validity of the pedigree file. Amplification and genotyping protocols could be consulted
in appliedbiosystems [11]. Population structure and genetic diversity evaluation was performed on
the historical pedigree information referred to above and on the currently living populations of both
breeds (1468 animals—48.23% sires and 51.77% dams—born between May 2001 and September 2017
for CR; 307 animals—50.16% sires and 49.84% dams—born between April 2005 and April 2018 for CB).
Demographic and genetic diversity parameters were evaluated using ENDOG (v4.8) software [12]
and CFC software [13] on all datasets.
2.2. Genealogical Information Analysis
The maximum number of offspring per sires and dams and mean offspring number per male or
female were computed by evaluating the trends described by birth number during the period that the
study comprised. Pedigree completeness index (PCI) was assessed through the maximum, complete,
and equivalent number of generations traced [14]. The study of the genealogical information was
computed by calculating the percentage of known individuals from the first to the fifth generation
(from parents to great-great-grandparents).
2.3. Analysis of Breeding Policies
Generation length [15] and the average age of parents at the birth of their offspring (used for
reproduction or not) were calculated for each of the four gametic pathways: sire to son, sire to daughter,
dam to son, and dam to daughter.
2.4. Genetic Diversity
Genetic diversity was evaluated through the parameters described below.
2.4.1. Identity by Descent (IBD) Genealogical Estimators
Individual inbreeding coefficient (F) was computed as described by Luo [16], the average
relatedness (∆R) of each individual was computed as described by Gutiérrez and Goyache [17],
and coancestry (C) coefficient was computed as described by Leroy et al. [18]. The individual rate
of inbreeding (∆F) for the generation was computed as suggested by Gutiérrez et al. [19]. Mean ∆R
and F per generation were used to issue linear and quadratic regression equations to describe and
predict the evolution of both coefficients up to 15 generations, as suggested by Navas et al. [20].Animals 2020, 10, x 5 of 22
Animals 2020, 10, 1893 5 of 22
the evolution of both coefficients up to 15 generations, as suggested by Navas et al. [20]. Regression
equations, their graphical depiction, and their comparison between functionalities are shown in
Regression equations, their graphical depiction, and their comparison between functionalities are
Figures 1 and 2.
shown in Figures 1 and 2.
Figure1.1.Logarithmic
Figure Logarithmicand
andquadratic
quadraticregression
regressionequations
equationsfor
formean
meaninbreeding
inbreeding(F)
(F)and
andrelatedness
relatedness
coefficients
coefficients (ΔR) from the first to fifth generation and predicted inbreeding (F) andrelatedness
(∆R) from the first to fifth generation and predicted inbreeding (F) and relatedness
coefficients (∆R) from the sixth to 15th generation in the Ca de Rater (CR) and Ca de Bestiar (CB)
coefficients (ΔR) from the sixth to 15th generation in the Ca de Rater (CR) and Ca de Bestiar (CB) dog
dog breeds.
breeds.Animals 2020, 10, 1893 6 of 22
Animals 2020, 10, x 6 of 22
Figure 2. Comparative analysis of quadratic (second-degree polynomic) regression equations for
Figure 2. Comparative analysis of quadratic (second-degree polynomic) regression equations for
mean inbreeding (F) and relatedness coefficients (∆R) from the first to fifth generation and predicted
mean inbreeding (F) and relatedness coefficients (ΔR) from the first to fifth generation and predicted
inbreeding (F) and relatedness coefficients (∆R) from the sixth to 15th generation in the Ca de Rater
inbreeding (F) and relatedness coefficients (ΔR) from the sixth to 15th generation in the Ca de Rater
and Ca de Bestiar dog breeds.
and Ca de Bestiar dog breeds.Animals 2020, 10, 1893 7 of 22
The individual rate of coancestry (∆C) for the generation was computed as suggested by
Cervantes et al. [21]. Assortative mating rate or nonrandom mating degree [22] was assessed to
determine the deviation of mating rates from Hardy–Weinberg proportions through its relationship
with inbreeding coefficients as suggested by Wright [23]. GCI (genetic conservation index) was
computed according to the descriptions in Oliveira et al. [24].
2.4.2. Founder Analysis
The effective number of founders (fe ) was computed as described by Lacy [25], while the effective
number of ancestors (fa ) necessary to explain the complete genetic diversity was computed as described
by Boichard et al. [26] to account for the genetic variability losses caused by population bottlenecks [27].
The effective number of founder genomes (fg ) was computed as defined by Lacy [25] as the inverse of
twice the population individuals’ average coancestry [28]. The expected marginal contribution of each
major ancestor j was computed as its expected genetic contribution independent from the contributions
of the other ancestors [26]. The contributions to inbreeding of nodal common ancestors (with the
largest marginal genetic contributions) were computed according to Colleau and Sargolzaei [29].
The mean effective population size (Ne ) was computed as described by Wright [23] as the size
of an idealized population which would give rise to the rate of inbreeding, or the variance change
rate in gene frequencies observed in the population. The number of equivalent subpopulations was
computed as described by Cervantes et al. [30]. Genetic diversity (GD) was computed as described in
Lacy [25]. GD lost in the population since the founder generation was estimated by deducting GD
from 1. Unequal founder contributions to GD loss were computed as described by Caballero and
Toro [28]. The difference between GD and GD * indicates the GD loss accumulated since the population
foundation [31]. Finally, the effective number of non-founders (Nef ) was computed following the
premises in Caballero and Toro [28] to describe the relationship between the effective number of
founders and founder genome equivalents.
2.4.3. Owner and Breeder Pack Relationships
Nei’s minimum genetic distance [32] among breeders, breeders locations, owners, and owner
locations were computed to assess interherd relationships. In our case, we evaluated the existence
of potential lines when breeders and owners and their locations were considered as the segregation
criteria. Dendrograms for owners and breeders for both breeds were constructed using the construct
Unweighted Pair-Group Method using Arithmetic averages (UPGMA) Tree task from the Phylogeny
procedure of MEGA X 10.0.5. [33].
2.5. Functionality Impact on Demographic and Diversity Parameters
To evaluate the impact of functionality on demographic and diversity parameters, historical and
current populations were subdivided into two groups separately considering each of the breeds and
their functionality (CR, ratting/hunting; CB, guard/shepherding).
The Shapiro–Francia W’ test (for 5 ≤ n ≤ 1000 samples) was performed to study data distribution
using the Shapiro–Francia normality routine of the Stata Version 15.0 software. Levene’s test was
performed to determine the homogeneity of variance across groups using the explore procedure
of the descriptive statistics package in SPSS Statistics, Version 25.0, IBM Corp. [34]. As parametric
assumptions for diversity parameters were not met (normality and homoscedasticity, p < 0.05),
Mann–Whitney U and independent median t-tests were performed to detect potential differences in
population statistics and diversity parameters between CR and CB breeds, respectively (inbreeding
coefficient (F, %), average relatedness coefficient (∆R), number of maximum generations, number
of complete generations, equivalent number of generations, individual increase in mean inbreeding
(∆F, %), and genetic conservation index (GCI)). Mann–Whitney U and independent median t-tests
were performed using the independent samples procedure of the nonparametric tests task of SPSS
Statistics for Windows, Version 25.0, IBM Corp. [34].Animals 2020, 10, 1893 8 of 22
According to Gibbons and Chakraborti [35], the estimated probability of a Type I error was
controlled (in the sense of being reasonably close to the attainable level) by the Mann–Whitney test,
Student’s t-test, and independent median t-tests when the variances are equal, regardless of the sample
sizes. However, it was controlled by the alternate t-test (independent median t-tests) for unequal
variances with unequal sample sizes.
2.6. Publication Ethics Statement
Ca de Rater Mallorquí Club and Associació de Criadors i Propietaris del Ca Pastor Mallorqui—Club
del Ca de Bestiar gave their informed consent for the use of pedigree data before the study was
performed. As biological samples were not taken, further permission was not necessary. The study
was conducted in accordance with the Declaration of Helsinki. The Spanish Ministry of Economy
and Competitivity through Royal Decree Law 53/2013 and its credited entity, the Ethics Committee of
Animal Experimentation from the University of Córdoba, permitted the application of the protocols
presented in this study as cited in the fifth section of its second article, as the animals assessed were
used for credited zootechnical use. This national Decree follows European Union Directive 2010/63/UE,
from 22 September 2010.
3. Results
3.1. Genealogical Information Analysis
Two historical birth peaks occurred for both breeds: from 2002 to 2003 and from 2007 to 2008
in CR; in 2007 and in 2009 in CB. However, a drastic reduction in the number of births of the CR
breed was observed from 2008 onward. Such a drastic reduction was not observed for the CB breed.
The average historical number of births was 58 and 16 and the years for which the highest number of
births were registered were 2007, and 2007 and 2009 (163 and 37 births) for CR and CB, respectively.
However, after 2011 there was a progressive decrease in the number of births in the CR breed which
never reported the minimum levels reached during the 1987–1997 period. Contrastingly, despite CB
presenting remarkable fluctuations in the number of births across years, the highest values found
for 2007 and 2009 (37) were never reached again in the history of the breed. For CB, the trends were
maintained in time and the values never fell below those for the period from 1994–2001. The historical
number of complete generations in the last decade was 1.04 ± 0.79 and 1.04 ± 0.62, for CR and CB,
respectively. The historical number of equivalent generations was 1.50 ± 1.09 and 0.89 ± 0.99 for CR and
CB, respectively. The completeness index of the pedigree experienced a mean increase per generation
of 3.646% and 1.558% when the historical and current populations for CR and CB were compared,
respectively. The minimum index of completeness of the pedigree was reached for the fifth generation
(percentage of great-great-grandparents known) of the historical population for both breeds, with CR
reporting a 1% higher value than CB. In contrast, the maximum completeness index was reached for the
first generation (known parents) for both breeds with CR reporting almost 34% higher values than CB.
The summary of the results for pedigree completeness index-related parameters between the historical
and current populations for both breeds are reported in Table 1. The historical maximum progeny per
male was 117 and that per female was 39 in CR, while the same parameters reached values of 18 and
16, respectively, for CB. These numbers reduced to 72 and 33 per male and female, respectively, in the
current population of the CR, while historical values remained constant for the current population of
CB. The average progenies per male were 1.66 and 1.13 in the CR historical population and reference
population, respectively. These values were reduced to 1.00 and 0.81 in the CB historical and reference
populations, respectively. Contrastingly, the average progenies per female were 1.45 and 1.00 in the
CR historical population and reference population, respectively. These values were reduced to 0.96
and 0.67 in the CB historical and reference populations, respectively. The proportion of females per
male was 1.13/1 and 1.05/1 and 1.02/1 and 0.99/1, for historical and current populations in CR and
CB, respectively. The progeny of males selected for breeding was around 40–45% in historical andAnimals 2020, 10, 1893 9 of 22
current populations of CB, with the exception of progeny of males selected for breeding in the current
population, which was reduced to half this value (21.54%) in the historical and reference populations.
Slightly lower values were found for the CR breed, which were around 15% to 18% for the progeny of
males and females selected for breeding in the historical and current populations. Progeny analysis
results for all studied population subdivisions are presented in Table 1.
Table 1. Summary of demographic and offspring analysis parameters in Ca de Rater and Ca de Bestiar
historical and current population sets.
Population Set Ca de Bestiar Ca de Rater
Parameter Historical Current Historical Current
Population size 385 307 1810 1468
Maximum number of traced generations, n 7 7 8 8
Pedigree completeness level at 1st generation, (known parents) 48.96 50.33 77.71 84.88
Pedigree completeness level at 2nd generation, (known grandparents) 23.05 25.98 41.56 50.80
Pedigree completeness level at 3rd generation,
10.13 12.22 17.54 17.54
(known great-grandparents)
Pedigree completeness level at 4th generation,
4.09 5.13 7.45 8.86
(known great-great-grandparents)
Pedigree completeness level at 5th generation,
1.43 1.79 2.46 2.87
(known great-great-great-grandparents)
Number of maximum generations (mean ± SD) 1.72 ± 2.22 1.96 ± 2.22 2.35 ± 2.09 2.77 ± 2.09
Number of complete generations (mean ± SD) 1.04 ± 0.62 0.57 ± 0.62 1.04 ± 0.79 1.18 ± 0.79
Number of equivalent generations (mean ± SD) 0.89 ± 0.99 0.97 ± 0.99 1.50 ± 1.09 1.74 ± 1.09
Male % 49.61 50.16 46.91 48.23
Mean number of puppies per male, n 1.00 0.81 1.66 1.13
Maximum number of puppies per male, n 18 18 117 72
Average age of male in reproduction, years 14.78 14.09 14.30 13.61
Female % 50.39 49.84 53.09 51.77
Mean number of puppies per female, n 0.96 0.67 1.45 1.00
Maximum number of puppies per female, n 16 16 39 33
Average age of female in reproduction, years 13.16 12.32 14,91 14.07
Female/male ratio 1.02/1 0.99/1 1.13/1 1.05/1
Progeny from male selected for breeding, % 39.13 21.54 14.86 15.29
Progeny from female selected for breeding, % 44.00 40.54 17.74 18.22
The average age of the males and females in reproduction was very similar (~14 years) for the
historical and reference populations of both breeds. Generation length was 3.94 and 3.93 years and 3.09
and 4.04 for the historical and reference populations of CR and CB, respectively. The lowest values
reported for generation interval were 3.76, 3.63, and 2.70 for the gametic routes of sire to son and dam
to son in the historical populations and sire to daughter in the current populations of the CR and
CB, respectively (Table S2, Supplementary Materials). Table S2 suggests that the mean age (years)
of the parents at the birth of their offspring for the four gametic routes in both breeds was around 4.
A summary of the demographic and offspring statistics derived from the analysis of the pedigree of
the two breeds is reported in Table 1.
3.2. Genetic Diversity
3.2.1. Identity by Descent (IBD) Genealogical Estimators
Inbreeding coefficients for the historical and current populations were 1.15% and 1.41% and 0.27%
and 0.34% for CR and CB, respectively. Despite these relatively low coefficients, highly inbred animals
were recorded in the historical and current populations. The maximum percentage of inbreeding
(26.41%) was reported for the historical and current populations of CR. CB reached half the value
reported for CR in both populations (13.38%). The percentage of inbred animals was 1–2-fold higher in
the historical and current populations of CR compared to CB (Table 2). Nonrandom mating rate was
0.00 and −0.01 for the historical and reference populations of CR and CB, respectively, as shown in
Table 2.Animals 2020, 10, 1893 10 of 22
Table 2. Summary of identity-by-descent estimators, nonrandom mating rate (α), and genetic
conservation index (GCI).
Population Set Ca de Bestiar Ca de Rater
Parameter Historical (n = 385) Current (n = 307) Historical (n = 1810) Current (n = 1468)
Inbreeding (F, %) 0.27 0.34 1.15 1.41
Average individual increase in
0.13 0.16 0.92 1.13
inbreeding (∆F, %)
Maximum coefficient of
13.38 13.38 26.41 26.41
inbreeding (%)
Inbred animals (%) 4.68 5.86 13.98 17.17
Highly inbred animals (%) 1.30 1.63 3.70 4.77
Average coancestry (C, %) 0.86 0.86 1.24 1.41
Average relatedness (∆R, %) 1.73 1.73 2.49 2.83
Nonrandom mating rate (α) −0.01 −0.01 0.00 0.00
Genetic conservation index (GCI) 2.00 2.10 2.98 3.32
The average coancestry in the historical and reference populations was 1.24% and 1.41%,
respectively, for CR, while it was 0.86% for the historical and reference populations of CB.
3.2.2. Founder Analysis
The results for the analysis of probabilities of gene origin, ancestral contributions, and the loss
of genetic diversity are shown in Table 3. GCI reported values around 3 for historical and current
populations of CR and values of 2 for historical and current populations of CB (Table 2).
Table 3. Summary of the measures of genetic diversity, genetic diversity loss, and analysis of the
probabilities of genetic origin.
Reference Ca de Bestiar (Both Ca de Rater (Both
Parents Known) Parents Known)
Parameter (n = 180) (n = 1367)
Historical population 385 1810
Current population 307 1468
Base population (one or more unknown parents) 205 443
Actual base population (one unknown parent = half-founder) 196.50 403.50
Number of founders, n 53 146
Number of ancestors, n 61 148
Effective number of non-founders (Nef) 171.99 102.51
Number of founder equivalents (fe) 87.32 66.08
Effective number of ancestors (fa) 26 36
Founder genome equivalents (fg) 57.92 40.18
fa/fe ratio 0.30 0.55
fg/fe ratio 0.66 0.61
Genetic diversity, GD 0.99 0.99
Genetic diversity loss, GDL 0.01 0.01
Genetic diversity in the reference population considered to
compute the genetic diversity loss due to the unequal 0.99 0.99
contribution of founders, DG
GDL due to bottlenecks and genetic drift since founders (GBDr) 0.01 0.01
GDL due to genetic drift since founders (GDr) 0 0
GDL due to unequal founder contributions 0.01 0.01
Ancestors explaining 25% of the gene pool (n) 4 5
Ancestors explaining 50% of the gene pool (n) 10 13
Ancestors explaining 75% of the gene pool (n) 21 36
Average individual increase in inbreeding (∆F) 0 0.01
Average relatedness (∆R) 0.02 0.25Animals 2020, 10, 1893 11 of 22
Genetic diversity was around 99% in both breeds. The lowest value was reported for CR,
although the differences with CB were not remarkable (98.76%), which was the population for which
genetic diversity loss was consequently slightly greater. The loss of genetic diversity due to genetic
drift was 0.5% and 0.3% in CR and CB populations, respectively. A value of 1.24% and 0.9% was
reported for the genetic diversity loss that could be attributed to bottlenecks and genetic drift for the
CR and CB reference populations (Table 3).
The average relatedness (kinship) coefficient was 24.09% and 1.73% in the CR and CB reference
populations. For the CR, considering the marginal genetic contributions of ancestors, a single ancestor
(identification number 138) explained 9.25% to 14.13% of the genetic pool of the historical population
and 8.97% to 13.55% of that of the current population. Contrastingly, for CB, marginal genetic
contributions of a single ancestor (identification number 202) explained 9.77% to 15.89% of the genetic
pool of the historical population and 4.42% to 8.37% of that of the current population. Additionally,
15 and 31 individuals explained 50% of the gene pool of the current and historical populations of CR
and CB, respectively.
Results for effective sizes calculated through the individual inbreeding rate and individual
coancestry rate are reported in Table 4. Effective population size calculated through the individual
inbreeding rate was 54.35 and 384.62 in the CR and CB historical populations. Comparatively,
the effective sizes of the population calculated through the individual coancestry rate of the CR and CB
historical populations were 20.08 and 28.90, respectively.
Table 4. Statistical results for effective population size calculated on the basis of the individual
inbreeding rate, the individual coancestry rate, and the number of equivalent subpopulations.
Ca de Bestiar Ca de Rater
Parameter Historical Historical
(n = 385) (n = 1810)
Effective population size based on the individual inbreeding rate 384.62 54.35
Effective population size based on the individual coancestry rate 28.90 20.08
Number of equivalent subpopulations 0.075 0.37
3.2.3. Owner and Breeder Pack Relationships
A total of 67,161 and 19,306 Nei’s genetic distances were considered when the stratification
criterion was the owner for CR and CB, respectively. The average Nei’s genetic distance was 0.103
and 0.274 for CR and CB owners, respectively. Contrastingly, for breeder, breeder location, and owner
location this parameter was 0.074 and 0.038, 0.021 and 0.042, and 0.025 and 0.072 for CR and CB,
respectively. The number of equivalent subpopulations for all population sets was 0.370 and 0.075 for
CR and CB, respectively (Table 4). The average numbers of CRs per breeder, breeder location, owner,
and owner location were 24.133, 56.563, 4.919, and 24.795, respectively, while the average numbers of
CBs per breeder, breeder location, owner, and owner location were 22.647, 12.031, 1.944, and 7.549,
respectively. The mean coancestry within the subpopulations for CR breeder, breeder location, owner,
and owner location was 0.086, 0.050, 0.116, and 0.034, respectively. For CBs, the mean coancestry
within the subpopulations for breeder, breeder location, owner, and owner location was 0.051, 0.034,
0.283, and 0.080, respectively (Table 5).Animals 2020, 10, 1893 12 of 22
Table 5. Summary of Wright’s fixation statistics.
Ca de Bestiar Ca de Rater
Parameter Breeder Owner Breeder Owner
Breeder Owner Breeder Owner
Location Location Location Location
FIS (inbreeding coefficient
−0.051 −0.0323 −0.390 −0.084 −0.082 −0.041 −0.118 −0.023
relative to the subpopulation)
FST (correlation between random
gametes drawn from the
0.0427 0.0255 0.276 0.072 0.075 0.0383 0.105 0.021
subpopulation relative to the
total population)
FIT (inbreeding coefficient
−0.006 −0.006 −0.006 −0.006 −0.001 −0.001 −0.001 −0.001
relative to the total population)
Mean inbreeding within
0.0027 0.0027 0.003 0.003 0.012 0.012 0.012 0.012
subpopulations
Mean number of animals per
22.647 12.031 1.944 7.549 24.133 56.563 4.919 24.795
subpopulation
Total Nei’s genetic distance 120 21 19306 1225 2701 465 67161 2556
Average Nei’s genetic distance 0.042 0.025 0.274 0.072 0.074 0.038 0.103 0.021
Mean coancestry within
0.051 0.034 0.283 0.080 0.086 0.050 0.116 0.034
subpopulations
Autocoancestry 0.501 0.501 0.501 0.501 0.506 0.506 0.506 0.506
Mean coancestry in the
0.009 0.009 0.009 0.009 0.013 0.013 0.013 0.013
metapopulation
Subpopulations 17 8 198 51 75 32 368 73
Mean coancestry in the metapopulation and autocoancestry reported values of 0.013 and 0.506 for
all population subdivisions (breeder, breeder location, owner, and owner location) for CR, while these
values were 0.009 and 0.501, respectively, for all population subdivisions (breeder, breeder location,
owner, and owner location) for CB. The analysis of population structure through Wright’s F statistics
(Table 5) reported that the inbreeding coefficient of a certain individual with respect to the total
population (FIT ) was −0.001 and −0.006 for all subpopulations and criteria considered. The coefficient
of inbreeding of an individual with respect to the subpopulation (FIS ) varied from −0.390 for the
subpopulations of the CB breed when the owner criterion was followed to a maximum of −0.023 for
the subpopulations of CR when the owner location criterion was considered (Table 5). The correlation
between random gametes drawn from the subpopulation relative to total population (FST ), i.e., the effect
of the subpopulations compared to the total population, reached a maximum value of 0.276 for the
owner subdivision or stratification criterion in CB and a minimum of 0.021 for the owner location
subdivision or stratification criterion in CR.
The analysis of the structure of owners and breeders revealed that none of them could be
considered as the nucleus of the population. We found that 100% of owners used foreign sires in both
breeds, and none of them could be considered totally isolated. In total, 173 owners used the maximum
percentage of own parents (66.67%) for CB, while 315 owners used the maximum percentage of own
parents (25.00%) for CR.
In total, 29 pairs of owners of CRs presented the longest genetic distance, which was 0.547.
On the other hand, 236 pairs of owners of CBs were distanced by the longest genetic distance (0.508).
Figures S1 and S2 display four dendrograms representing all the relationships between populations
considering the criteria of owner and breeder for both CR and CB breeds. Breeder dendrograms match
the patterns of the initial part of each owner dendrogram, as they constitute the basis from which the
population of each breed was historically derived. Figure 3 represents the connection between breeder
territorial areas. In the case of CR, two main currents could be observed. The first went from the north
of Majorca to the southwest, while the second horizontally crossed the island, forming a bidirectional
flux from east to west and vice versa. For CB (Figure 3), an ascending current was formed from the
southeastern region of the island upward. This flux of animals would later cross the island diagonally,
ending in two locations in the southwestern territories of Majorca, thereby depicting a remarkably
more disperse distribution than that shown by CR breeder structure.Animals 2020, 10, 1893 13 of 22
Animals 2020, 10, x 13 of 22
Figure 3. Breeder location connection maps for Ca de Rater and Ca de Bestiar breeds.
3.3. Functionality Impact
3.3. Functionality Impact on
on Demographic
Demographic and
and Diversity
Diversity Parameters
Parameters
Table
Table S3
S3 (Supplementary
(Supplementary Materials)
Materials) shows
shows aa summary
summary of of the
the descriptive
descriptive statistics
statistics of
of genetic
genetic
diversity population parameters for historical and current populations of CR and CB
diversity population parameters for historical and current populations of CR and CB breeds.breeds. The outputs
The
derived from Mann–Whitney U and independent median t-tests (Table S4, Supplementary
outputs derived from Mann–Whitney U and independent median t-tests (Table S4, Supplementary Materials)
report that report
Materials) all genetic
that diversity
all geneticpopulation statistics differed
diversity population between
statistics functionalities.
differed between functionalities.Animals 2020, 10, 1893 14 of 22
Animals 2020, 10, x 14 of 22
4. Discussion
4. Discussion
The number of births recorded in the pedigree of CR and CB dog breeds describes an irregular
The number of births recorded in the pedigree of CR and CB dog breeds describes an irregular
evolutionary
evolutionarytendency
tendency(Figure
(Figure 4). The two
4). The two peaks
peaksininthe
thenumber
numberofofbirths
birthsinin
CRCR took
took place
place after
after thethe
official
officialrecognition
recognitionby bythe
the Ministry
Ministry ofof Agriculture andFisheries
Agriculture and FisheriesofofthetheBalearic
Balearic Government
Government thatthat
occurred
occurred on 28 December 2002 (in 2003 and 2007). This 2007 peak coincides with the first peak of CB, of
on 28 December 2002 (in 2003 and 2007). This 2007 peak coincides with the first peak
CB, followed
followed by aby a second
second peak peak in During
in 2009. 2009. During these
these years, theyears, theofactivity
activity of these associations
these associations was increasedwas
increased by morphological
by morphological and monographic
and monographic competitions
competitions to publicize
to publicize their their activity
activity and and promote
promote thethe
autochthonous
autochthonousbreedsbreedsofofthe
thearchipelago,
archipelago, which may
may explain
explainsuch
suchan anincrease.
increase.
Figure4.4.Birth
Figure Birthnumber
number evolution
evolution from 1987 to
from 1987 to2018
2018for
forCa
Cade
deRater
Raterand
andCaCa
dede Bestiar
Bestiar dog
dog breeds.
breeds.
Pedigree
Pedigreecompleteness
completenesslevels levels were lower than
were lower thanthose
thosereported
reportedbybyLeroy Leroy etet
al.al. [36],
[36], who who reported
reported
common approximate levels for the fifth generation of 100% for internationally
common approximate levels for the fifth generation of 100% for internationally recognized breeds recognized breeds
(not isolated nor endangered). The lower levels found in the autochthonous
(not isolated nor endangered). The lower levels found in the autochthonous breeds in this study may breeds in this study may
derive
derivefrom fromtheir
theirendangered
endangered status statusandandthe thelack
lackofof genetic
genetic management
management occurring
occurring in bothin breeds,
both breeds,
as
asofficial
officialstructures
structureswere wererecognized
recognizedrelatively
relatively recently.
recently. Contrastingly,
Contrastingly, ourour results
results forfor
PCIPCI (around
(around
60%)
60%) may maybebeininline
linewith
withthose
those ofof Cecchi et et al.
al.[37]
[37]for
foranimals
animalsbelonging
belonging toto internationally
internationally recognized
recognized
dogs
dogs suchasasLabrador,
such Labrador,GoldenGolden Retriever,
Retriever, and German
GermanShepherd
Shepherdused usedasasguide
guide dogs.
dogs. These
These results
results
suggest
suggest thethe collateral
collateral application
application of certain
of certain breedsbreeds to purposes
to purposes that maythat differmay
fromdiffer
their from their
consideration
asconsideration
pets, which may as pets, which may
condition conditioninformation
genealogical genealogicalregistration
informationfrom registration from these
these animals, animals,
as, in the latter,
as, in the latter, other factors, such as conformation, may
other factors, such as conformation, may potentially be rather highly considered. potentially be rather highly considered.
The The lowlowPCIPCI levels
levels found
found contraststhe
contrasts thelevels
levelsreported
reportedfor forthe
thecommon
commoncontext
contextofofdog dogbreeds
breedsthat
that are internationally recognized, which may enjoy greater worldwide
are internationally recognized, which may enjoy greater worldwide popularity. Contextually, the low popularity. Contextually,
thelevels
PCI low for PCIthelevels
fifth for the fifthmay
generation generation
derive frommay thederive fromgenetic
fact that the fact that geneticprograms
management management of both
programs of both breeds are still in their first stages of development. The conservation strategies
breeds are still in their first stages of development. The conservation strategies implemented in both
implemented in both breeds started with a low number of effectives on which to support
breeds started with a low number of effectives on which to support management structures (studbook,
management structures (studbook, association, among others) which are only around 10 to 15 years
association, among others) which are only around 10 to 15 years old, even if a great breeding tradition
old, even if a great breeding tradition of these breeds can be found in the archipelago prior to the
of these breeds can be found in the archipelago prior to the recognition of the breed [36]. This may
recognition of the breed [36]. This may be supported by the fact that the mean number of equivalent
begenerations
supported was by the fact that the mean number of equivalent generations was maintained over time,
maintained over time, as suggested by Marin et al. [38].
as suggested by Marin
Maximum, complete, et al.and
[38].equivalent generations in CB were significantly lower than the values
Maximum, complete, and equivalent
reported for CR (Tables S3 and S4, Supplementary generations in CB wereFigure
Materials; significantly
5). Thelower
meanthan the values
number of
reported for CR (Tables S3 and S4, Supplementary Materials; Figure 5).
equivalent generations (EqG) for both breeds was lower than that observed for Italian Bracco by The mean number of equivalent
generations
Cecchi et al. (EqG)
[39], for
for both breedsFrançais
the Braque was lower typethan that observed
Pyrénées by Cecchifor et Italian
al. [40],Bracco
and forby CaCecchi
Mè byet al. [39],
Marin
foretthe Braque
al. [38], withFrançais
the lattertypesharingPyrénées
the same byterritorial
Cecchi et al. [40],conditions
isolation and for Ca Mèbreeds
as the by Marin
in ouretstudy.
al. [38],Animals 2020, 10, 1893 15 of 22
Animals 2020, 10, x 15 of 22
Thethe
with latter breeds
latter differed
sharing from those
the same in our
territorial study inconditions
isolation terms of their hunting
as the breedsapplication in comparison
in our study. The latter
to the differed
breeds ratting/domestic
from those andinshepherding/guard
our study in termsapplications of CRapplication
of their hunting and CB, respectively,
in comparison which may
to the
have conditioned the results. In line with our results, the study by Leroy et al.
ratting/domestic and shepherding/guard applications of CR and CB, respectively, which may have [36] reported similar
EqG in breeds
conditioned the of a renowned
results. shepherding/guard
In line with our results, thebackground to those
study by Leroy et al.reported for the
[36] reported upperEqG
similar limit
infound
breeds for
ofCB.
a renowned shepherding/guard background to those reported for the upper limit found
for CB.
Figure 5. Trends for identity by descend estimators (F, C, ∆F), ∆R, nonrandom mating degree (NRM),
and genetic conservation index (GCI) from 1987 to 2018 for Ca de Rater and Ca de Bestiar dog breeds.
Figure 5. Trends for identity by descend estimators (F, C, ΔF), ΔR, nonrandom mating degree (NRM),
Breeder dendrograms
and genetic layindex
conservation the historical
(GCI) frombasis
1987oftoowner dendrograms;
2018 for hence,
Ca de Rater and breeder
Ca de Bestiarpack structures
dog breeds.
can be inferred to build the skeleton of the owner pack network (Figures S1 and S2). Both breeds were
Breederaround
predominant dendrograms
the centerlayof the historical
the island basis oftoowner
as opposed dendrograms;
the coastal areas, sincehence,
it is inbreeder pack
these zones
structures
where their can be inferred
functional to build
aptitude, the skeleton
linked of the systems
to production owner pack network
(cattle herding(Figures S1 and S2).
and privately Both
owned
breeds were predominant around the center of the island as opposed
preserves) and occupational habits of the population (vacation houses), extends. to the coastal areas, since it is
in these zones where their functional aptitude, linked to production systems (cattle herding and
privately owned preserves) and occupational habits of the population (vacation houses), extends.Animals 2020, 10, 1893 16 of 22
Generation intervals resembled the values found by Leroy et al. [34] for Basset fauve de Bretagne,
French Bulldog, Dogue de Bordeaux, Barbet, Berger des Pyrénées, Beauceron, Epagneul Breton,
and Pyrenean Mountain Dog and were somehow lower than those found by Leroy et al. [41]
and Cecchi et al. [40] for the breeds recognized by Fédération Cynologique Internationale (FCI).
Hunting dogs reported the longest generation intervals, which may be based on the time that breeders
take to test the performance of animals before choosing their offspring for the next generation [38].
Guard dogs [36] on average reported similar values of ~5, which were similar to those found in the
current population of CB. Shorter generation intervals for French Bulldog and CR may be related to
their application as pets, which may make performance testing a secondary or irrelevant position.
In general, mean generation intervals were slightly longer for male offspring (via both sire and
dam) than for female offspring, with the highest value being reported for the gametic pathway of sire
to son for the current population of CB, which may derive from the higher number of male dogs than
female dogs whose age at the birth of their offspring was above the mean. A certain preference for
dogs of a particular sex has been reported and may be based on a perceived dimorphic superiority
in some desired traits, which may condition the time taken by breeders to determine the validity of
a certain animal as a mating animal. For instance, males have normally been reported to be bolder,
higher driven, and more aggressive than females, who tend to learn faster, be somehow less territorial,
and more biddable. Differences in boldness and shyness are acknowledged predictors of performance
in working dogs, with bolder animals being the better performers [42]. Boldness is an individual
characteristic providing less aversion to risk or novelty that enables the individual actively seeking
out and engaging in social cooperative and competitive interactions [43]. This mirrors the recently
reported opinions of working farm dog handlers, who identified boldness in their dogs as a desirable
trait. By contrast, although it is possible that male and female dogs may differ in boldness, there is
limited evidence of sex differences in the herding style of working farm dogs [44].
The policies of breeders denote the use of certain males or females which may be more popular
among the individuals in the population. Contextually, having a low replacement rate could contribute
to generation elongation which has been reported for other endangered dog or equine breeds [20].
Both species, equines and canines, may share certain similarities with respect to the over-consideration
of the value provided to ancestors and the conditioning effect of such ancestral value on the relevance
of the individuals in the current population.
A slightly higher number of females than males selected for breeding was reported in both
breeds. However, female to male ratio inverted in CB, which suggests a certain interest for breeders
and owners in the males of the CB breed, which could be presumably linked to their application
as guard or shepherding animals. In nature, for males, territorial defense versus access to female
success ratio may be balanced by ameliorative reproductive success, whereas females have fewer direct
advantages from this ratio; hence, the energy invested in the defense may be detracted by the functions
related to the sex-specific behaviors linked to reproduction [43]. The same authors suggested that
male dogs tend to be more social and to engage more in dog/human contact than females, whereas,
in cooperative behavior in trying to solve a problem, the opposite trend has been found. These features
may condition breeder preference when the selection criterion is performance for a specific outcome,
such as guarding [43], as already discussed. However, hunters reported no differences between males
or females in hunting performance [45], even if a certain interaction between breed sex conditioning
effect was suggested, with male Dachshunds and West Highland White Terriers being found to be
significantly more trainable than females of the same breeds [46].
Mating between dogs that are related beyond second cousins (F < 0.0156) has been reported in
small territorially isolated populations such as the ones in our study as suggested by Marin et al. [38].
However, these values should be cautiously regarded as low levels of pedigree completeness indices
for fifth generation may denote that diversity estimators are underrated. For instance, Marin et al. [38]
reported higher F values for Ca Mè, which were supported by considerably higher levels of PCI
across generations, which may derive from the greater importance of the knowledge of genealogy inAnimals 2020, 10, 1893 17 of 22
hunting dogs when compared to guard dogs or even domestic dogs without a marked functionality.
According to Navas et al. [20], remote levels of inbreeding may not determine a relevant impact on
health, although they may still give way to a marked increase in homozygosity levels, which is often
sought when the breed is defined in accordance with a certain standard, whether it is morphological,
functional, or zootechnical.
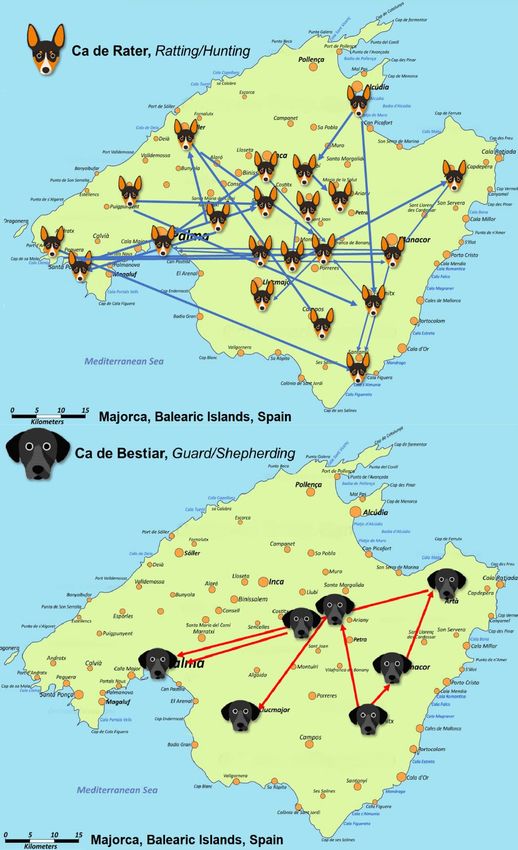
In our study, inbreeding levels showed an increasing trend which stabilized around 14 or eight
maximum generations for CR and CB, respectively (Figure 1). This contrasts ∆R levels which increased
over the years, describing a rather exponential curve, which may suggest the progressively increase in
breeders using related animals for the obtention of their litters (Figure 2). The values for F and ∆R
fall within the range of values reported by the study of Leroy et al. [41] for 61 breeds. These authors
suggested that F ranged from 0.2% (for Czechoslovakian Wolfdog) to 8.8% (for the Pyrenean Shepherd).
Concretely, CB values were the same as those reported by the Romagna Water Dog, while CR values
were the same as those reported by the Italian Mastiff. ∆R levels ranged from 0.4% (for poodle) to 8.8%
(for Saint Germain pointing dog), while CB reported the same values as Cairn Terrier and CR reported
the same values as Cavalier King Charles Spaniel. These results suggest a weaker ancestral connection
in breeds of a remarkable pet application than in those with a rather distinctive functionality such as
hunting, shepherding, or guarding.
All diversity parameters differed highly statistically between guard/shepherding dogs and
ratting/hunting/pet dogs (Tables S3 and S4, Supplementary Materials), with the latter reporting double
the values for F, ∆R, ∆F, and GCI. Pedersen et al. [7] suggested that the diversity parameters of
conformation-type breeds differed from that in breeds heavily used for performance, with the latter
clustering more closely with village dogs. The same authors concluded that, in comparison to their
village dog relatives, all modern breed dogs exhibit reduced genetic diversity, which was even more
reduced among breeds under selection for show/conformation, which may suggest that selection for
performance may act as a diversity promoter.
Provided the historical territorial isolation to which CR and CB have been exposed, a solid
interconnection between available genetic resources through the implementation of appropriate
breeding practices may have been attempted, as suggested by nonrandom mating results in CR,
which could be said to be in genetic equilibrium. This may suggest that this population will be
balanced as soon as no external influence such as selection can promote the increase in mutation
rates. The negative values for CB may imply that mating among the animals may not have been
performed seeking particular phenotypical, phaneroptic, or functional characteristics. These values
contrast the ones obtained for Ca Mè by Marin et al. [38], whose positive value of 0.02 may imply that
certain characteristics were sought after along the trajectory of the breed, such as specific desirable coat
patterns as a complement of a greater adaptability or suitability of the animals for hunting.
The number of equivalent subpopulations below 2 indicates a high structuration of both populations
(0.37 and 0.075 for CR and CB, respectively) whose values were lower than those found for Ca Mè [38].
According to Fernández et al. [47], maintaining subdivided populations has the advantage of a reduced
extinction risk derived from potential natural catastrophes or health-related factors, as these events
may only affect reduced individual groups. Similarly, the higher levels of genetic diversity may have
been attained when a certain population was subdivided in time in as many groups as possible, while
considering that subdivision in lines may be detrimental due to the smaller effective size of each
subline, which may, thus, translate to an increased level of inbreeding.
The FST value of zero suggests no population structuring or subdivision, i.e., complete panmixia
or random mating. The concept of panmixia is opposed to the concept of assortative or nonrandom
mating (Table 2). Panmixia via weak positive assortative mating has been reported to be typical for
natural animal populations, while disassortative mating is rare or absent [48], as reported for CB
(Table 2). In this context, repeated backcrossing may be considered as a particular application of
disassortative mating [49]. Generally, disruptive selection will indirectly favor positive assortative
mating to avoid producing less fitted offspring; conversely, stabilizing selection will favor negativeYou can also read