Domestic Medium Term Note Programme Deal Roadshow November 2019 - Discovery
←
→
Page content transcription
If your browser does not render page correctly, please read the page content below

Domestic Medium Term Note Programme
Deal Roadshow

November 2019

 1
Team introduction

 Group Chief Financial Officer

 Group Chief Risk Officer

 Group Corporate Finance

 2
Business Model and Financial Performance

Operating Model

Debt Overview

Discussion Points

DMTN Issuance

 3
Business Model and Financial
 Performance

 4
Financial results overview | 12 months to 30 June 2019

 Core new business1 Normalised operating profit Normalised headline Net cash flow
 earnings

 Operating cash flow
 to R18 299m to R7 747m to R5 035m

 Return on Embedded Earnings investment in Interest cover2 Bank & DMTN Debt
 Value new initiatives

 Other Borrowings3

 closing EV R71 217m Including associated
 financing costs

1 Appliedto core new business
2 InterestCover = EBIT / Finance Costs; EBIT and finance cost excludes IFRS16 adjustments relating to 1DP
3 Other borrowings excludes the head office finance lease liability (R3,321m), and is the amount owed to the Prudential in respect of historic new business liquidity funding
 5
Core new business

 12 months 12 months
 Rm % change
to R18 299m to 30 Jun 2019 to 30 Jun 2018
 1
 6 640 6 573 +1%
 18,299

 ESTABLISHED BUSINESSES
 2 312 2 188 +6%

 16,137 2 604 2 454 +6% +5%
 14,660
 1 346 1 107 +22%
 13,303
 12,320
 1 291 1 172 +10%

 1 041 1 047 -1%

 EMERGING BUSINESS
 2
 922 645 +43% +43%

 NEW
 3
 2 518 1 434 +76%

 New businesses 4
 386 -
 2015 2016 2017 2018 2019

1 Excludes new scheme take-ons 3 Represents 25% of Ping An Health New Business API
2 Includes gross recurring and lump sum revenues 4 Vitality Invest, Umbrella Funds and Discovery Insure Commercial 6
Normalised operating profit

Normalised operating profit 12 months 12 months
 Rm
 to 30 Jun 2019 to 30 Jun 2018 % change
to R7 747m
 3 044 2 777 +10%

 ESTABLISHED BUSINESSES
 3 230 3 551 -9%

 7,980 966 885 +9% +3%
 7,747
 6,860 758 589 +29%
 6,261
 5,703 578 515 +12%

 155 68 +128%

 EMERGING BUSINESS
 161 94 +71% +94%
 106 56 +89%
 1 17% of
 New businesses (1 311) (613) +114%
 NEW

 earnings

 2015 2016 2017 2018 2019
 21% after
 financing costs
 Operating profit Investment in New

1 Includes Discovery Card profits, excludes financing costs Non-insurance based business excluded – Vitality SA
 7
Operating Model

 8
Operating model

 9
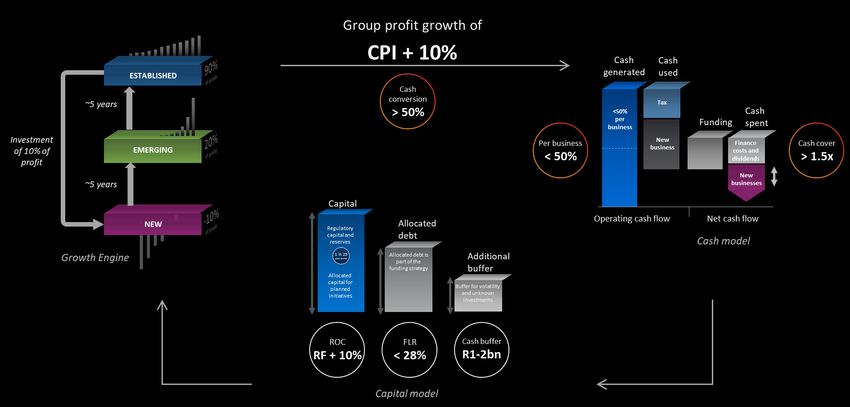
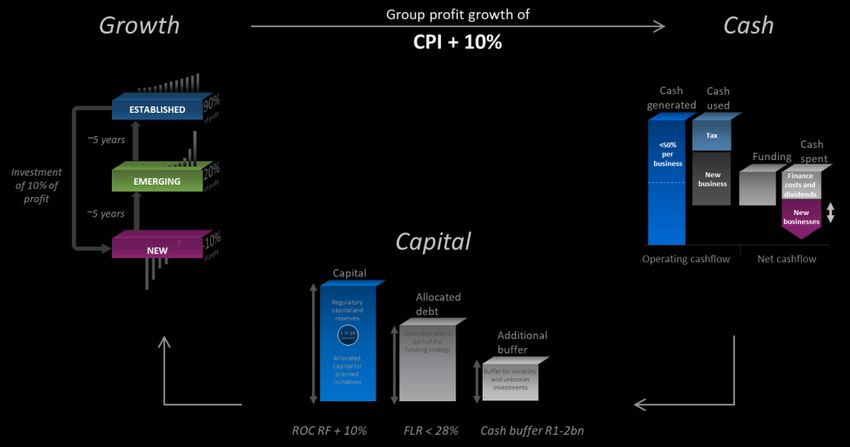
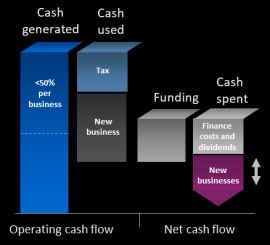
Cash management supports growth methodology

 Net cash flow
 Cash Funding Cash
 generated used

 Debt R1.2bn Tax
 Equity Raise
 R1.2bn Finance costs

 R1.5bn Dividend
 Cash generated from
 in-force business New business

 R14.6bn R8.1bn

 New businesses

 R3.6bn
 Net cash flow1 R1.7bn

 10
1 Movement in shareholder free cash
Operating to net cash flow

Cash from Operations Funding and investment decisions

 Tax
 R1.4bn R1.2bn
 Finance costs
 Funding
 R1.2bn
Cash generated
 from in-force
 R2.6bn Dividend

 business New business R1.5bn
(Excl. One-offs)
 R8.1bn SAM one-off New businesses

R11.1bn R3.5bn R3.6bn
 Business development
 Operating cash flow R1.4bn
 Net cash flow

 Cash Funding &
 Cash used Cash spent
 generated One-offs

 11
Group’s positive cash generating businesses is growing

Net operating cash flow (Rm) Relative increase in cash contributing business (%)

 3 500 80%

 3 000
 60%
 2 500
 40%
 2 000

 1 500 20%
 R millions

 1 000
 0%

 500
 -20%
 0

 ( 500) -40%

 (1 000)
 -60%

 (1 500) FY2016 FY2017 FY2018 FY2019
 FY2016 FY2017 FY2018 FY2019 Positive Operating Cashflow Negative Operating Cashflow

 12
Improving cash generation

Diversification of cash flow improving Cash conversion above target Cash cover on target
Cash from any one business should not contribute more More than 50% of operating profit must be cash Operating cashflow should be enough to at least cover
than 50% of the total operating cash earnings dividends and finance costs 1.5x

 ℎ ℎ ℎ
max(σ ) < 50% > 50% > 1.5x
 ℎ +

100% 70% 4.0
 Finance cost cover
 90% 3.5
 60%
 80%
 3.0
 70% 50%
 Target > 50% 2.5
 60% 40%
 50% 2.0
 30% Cash cover
 40% Target < 50% 1.5
 30% 20%
 Target > 1.5
 1.0
 20%
 10% 0.5
 10%
 0% 0% -
 2017 2018 2019 2020 2021 2022 2023 2024 2017 2018 2019 2020 2021 2022 2023 2024 2017 2018 2019 2020 2021 2022 2023 2024

 13
De-risking the balance sheet

Strongly capitalised FLR is decreasing Cash buffer has grown strongly
 Statutory capital
 Rm Cover
 requirements 29%
 28%
 28%
 R17 396m 1.6x 27%
 26%
 R789m 1.7x 25% Cash buffer: R1bn – R2bn
 24%
 R1 777m 1.4x 23%
 22%
 R3 810m 1.5x
 21%
 Jun-17 Dec-17 Jun-18 Dec-18 Jun-19 Dec-17 Jun-18 Dec-18 Jun-19

 14
FLR and cash buffer projection

FLR is decreasing Cash buffer stabilises over projection period
 28%

 25.8%
 23.3%

 Cash buffer: R1bn – R2bn

 FY2018 FY2019 FY2020 FY2021 FY2022 FY2023 FY2024 FY2019 FY2020 FY2021 FY2022 FY2023 FY2024

 15
Key focus areas

 The Bank has made Actions taken to mitigate low
 significant progress since its interest rates in the United
 public launch in July Kingdom

 16
Timeline Bank costs (Rm)
Slightly delayed to ensure the delivery of a robust, brilliant bank Within expectation due to the disciplined management of costs

 ACTUAL S.17
 First
 Gallagher Public roll Media
 Licence
 deposit
 Launch out launch R3 172m R3 212m
 received VS
 ~three- Actual cost Expected cost
 month
 1,738
 delay
 BUILD
 Client
 ramp 1,500
 TEST BETA
 up

 RUN

 860
 EXPECTED First
 S.17 Public roll
 deposit 676
 Licence received out 614 631

 BUILD

 TEST 189 176
 RUN

 Oct ‘17 Dec ‘17 Nov ‘18 Mar ‘19 Jun ‘19 Sep ‘19 Build Test Run Infrastructure

 17
The Bank has made significant progress in the last 8 months
Accounts Clients Retail deposits Total credit card facilities

 R584m
 Credit used

 R518m

 Utilised Credit Credit Facility
 18
UK Interest rate exposure

 Recent movement in UK Interest Rates
 • UK long-term interest rates have decreased to their

% 6 during October 2019
 25 year GBP IRS Since 2000
 • IFRS sensitivity to interest rate movements:
 5
 (Previously communicated)
 Global Financial
 Crisis • Primarily a back book issue, with the
 4
 Quantitative
 Easing
 3 • Impact of fair valuing the reserves to current interest rates is
 Post Brexit
 Referendum
 2
 • The risk of a further decline in interest rates is beyond our risk
 appetite, therefore we have taken
 1

 0 • VitalityLife has entered into an
 June-00

 June-01

 June-02

 June-03

 June-04

 June-05

 June-06

 June-07

 June-08

 June-09

 June-10

 June-11

 June-12

 June-13

 June-14

 June-15

 June-16

 June-17

 June-18

 June-19
 (detailed explanation of hedge further on)

 19
UK Interest rate hedge

IFRS/Potential Cashflow impact on VitalityLife Illustrative example of IFRS/Cashflow position
 Impact of Hedge
 150 From 25 October 2019
• The payoff profile of the underlying

 Indicative VL gross earnings sensitivity (£ millions)
 .
 100
 30 June 2019 Level
• At current rates plus 200bp, profits (before margining) are close to
 25 Oct 2019 Level
 £100m. The 50

 .
 -
• At current rates less 100bp (effectively zero long term interest rates)
 significant losses would occur.
 -50
 .
 No Hedge - Economic Hedge - Economic
• If rates remain at current levels until June 2020, reported -100
 No Hedge - IFRS Hedge - IFRS
 .
 -150
• This is the result of a and

 -100bps

 -75bps

 -50bps

 -25bps

 0bps

 +25bps

 +50bps

 +75bps

 +100bps

 +125bps

 +150bps

 +175bps

 +200bps
 .
 Indicative interest rates from point of hedge

 Note: Above chart is at specified point in time, assuming no basis or other risks or
 operational variances
 20
Debt overview

 21
Existing debt maturity profile South African debt maturity profile UK debt maturity profile 3,000 45 40 2,500 35 2,000 30 R Millions £ Millions 25 1,500 20 1,000 15 10 500 5 - - FY2020 FY2021 FY2022 FY2023 FY2024 FY2025 FY2026 FY2027 FY2028 FY2020 FY2021 FY2022 FY2023 FY2024 Other Funding DMTN • Syndicated loan of R3.6bn 5-year bullet and amortising raised in FY2016 • Two UK bank loans: • Bank Funding of R0.5bn on 5-year basis raised in FY2017 £100m 5-year amortising loan £50m 5-year bullet loan • Bank loan of R1bn on 5-year basis issued in FY2018 • DMTN funding of R1.5bn on 5-year and 7-year basis in FY2018 • Syndicated loan of R1.4bn 5-year bullet refinanced in H1 FY2019 • DMTN funding of R0.7bn on 8-year basis in H1 FY2019 22
Existing bank debt covenants

Covenant Minimum Requirement 30-Jun-19 30-Jun-18

Group Debt to EBITDA ratio Less than 2.5X 1.59 1.53

Group financial Indebtedness to EV Less than 30% of Group EV 18.4% 19.9%

Group EV Greater than R30 billion ZAR 71,217 ZAR 65,624

Discovery Life SCR Cover Current: SCR Cover > 1.1
 1.6x 3.5x
(Previously: CAR Cover) Prior Year: CAR Cover > 1.5x

 June 2019: R1,322 June 2018: R1,552
 Positive VNB for 3 consecutive
New Business EV not negative Dec 2018: R1,300 Dec 2017: R1,274
 6-month period
 June 2018: R1,552 Jun 2017: R 1,281m

 23
Key drivers of known funding requirements

 1-3 years 3-5 years

 • Transfer of Vitality Life business from Prudential balance sheet to • Refinance maturing South African and UK bank debt
 Vitality Life Limited (Part VII) arrangements
 • Vitality Life new business funding • New initiatives
 • Bank regulatory capital & J-curve funding • General corporate purposes
 • Refinance maturing South African and UK bank debt arrangements
 • New initiatives
 • General corporate purposes

 All included in 5-year financial projections

 Discovery Bank Funding programme:
 • Regulatory capital funding: included in the Discovery Group Capital Plan
 • Card book and other: migration in progress, will initially be funded through institutional funding (with some parental guarantees)
 transitioning to retail deposits
 • Lending activities: managed within the Bank, with support from Group in the short-term
 • R1bn, 2yr facility entered into. R500m guaranteed by DSY Limited
 24
Group’s debt requirements
 Group debt projection overlaying DMTN*

 FY2018 FY2019 FY2020 FY2021 FY2022 FY2023 FY2024

 Other DMTN

* The mix between bank and DMTN funding may vary depending on market conditions at the time 25
Discovery’s credit rating
 Credit strengths
Moody’s Insurance Financial
Strength Rating (IFSR) 1. Very and
 • Baa2 2. and non-insurance from
 • 1 above the Sovereign (Baa3)
 Supported by
 and 3. because of the capital-light
 nature of its business
Moody’s long-term issuer (LT 4. on both
Issuer) rating

 • Ba1 (global) / Aa3.za (national)
 Strength offsets

 1. Substantial to South Africa
Rating outlook
 2. C inherent in insurance
 • Stable outlook reflects outlook on
 South African sovereign 3. initiatives

 26
Discussion Points

 27
Discussion Points:
 NHI

 28
Section 33
Role of medical schemes
Once National Health Insurance has been fully implemented as
determined by the Minister through regulations in the Gazette, medical
schemes may only offer complementary cover to services not
reimbursable by the Fund.

Section 8 (2)
Access to health care services
A person or user, as the case may be, must pay for health care services
rendered directly, through a voluntary medical insurance scheme or through
any other private insurance scheme, if that person or user—
(a) is not entitled to health care services purchased by the Fund in terms of
 the provisions of this Act;
(b) fails to comply with referral pathways prescribed by a health care service
 provider or health establishment;
(c) seeks services that are not deemed medically necessary by the Benefits
 Advisory Committee; or
(d) seeks treatment that is not included in the Formulary.

 29
Discovery supports the principles of the NHI, but strongly believes in the
role of private medical schemes
Significant inequality in Implied tax increase to fund
access and quality of care Total health expenditure p.a. medical scheme contributions Result is not optimal
Healthcare spend per capita, per 2019 estimates, ZAR billion Different proportions of current total Medical Healthcare spend per capita, per month
month Scheme contributions

 4,035 90% Corporate tax
 500 469
 450 80% 1,726
 400 70%
 350 60%
 300
 3x
 50% Personal tax
 1,726 1,702 250 223 206 40%
 200
 30% 576
 150
 20% 372
 100
 372 40 10%
 50
 - 0%
 Medical Public NHS NHS Public Medical Out of pocket Combined 10% 50% 75% 100% Medical Public health Weighted
 healthcare Scheme and other total
 schemes health adjusted budget contributions private
 schemes average
 for PPP Proportion of R206bn Medical Scheme
 contributions
 people people people

 Scarce resources and high level of inequality necessitate active collaboration and the private
 sector as a partner in achieving UHC
National Treasury and CMS 30
NHS equivalent from WHO Global Health Expenditure Database for 2016
Discussion Points:
Discovery Life Accounting

 31
Strong historic cash generation and significant value created in Life & Invest

 Illustrative example: Annual Cash inflows and outflows Historic net shareholder capital invested in Discovery Life
 for a new protection policy and Invest
 Capital invested
Cash Inflows and Outflows

 R5.2bn repaid to group over
 the period resulting in net
 Cumulative investment cumulative repayment of
 reached a peak of R1.8bn R3.1bn to the group at June
 in 2006. Total of R2.2bn 2019.
 invested over full period.

 Year of Projection
 1 5 9 13 17 21 25 29

 Cumulative cashflow after layering the new protection policy assuming 2001 2002 2003 2004 2005 2006 2007 2008 2009 2010 2011 2012 2013 2014 2015 2016 2017 2018 2019

 new business growth of 15% p.a. Example portfolio growing at 15% only Funds returned in the form of dividends and loans
 Funds Invested by Financial Year
 generates cash after c25 years Cumulative
 Cumulative Cashflow

 Effectively received Cash +
 Return on Capital Invested 8% p.a with Embedded Value
 on top of that
 20.8% 21.8%

 8.0%

 Return excl EV*
 Actual past cash Return incl EV* Return incl AV**
 1 5 9 13 17 21 25 29 return to date (illustrative) (illustrative)

 *EV = Embedded Value at risk discount rate (risk free yield curve + 2.625%)
 **AV = Appraisal Value including 5 years of new business.

 32
Illustrative example: Cashflow profile vs. IFRS emergence
1. Risk business characterised by significant upfront acquisition costs Cashflow profile (Life & Invest) as at 30 June 2019 (R’millions)
 100
 50
 Includes c.R3.4bn
 Cashflow 0
 SAM release
 -50
 -100 Excluding Cashless Structure
 and Cash FinRe, existing
 -150
 book generates c.R7.8bn
 1 2 3 4 5 IRR = c19%
 4,222 cash

2. Reserve transfers effectively defer the recognition of these acquisitions costs into the Net Cashflow
 1,790 generated
 earnings profile over time R4.1bn
 13,855
 3,126
 100
 1,255 1,899
 50
 7,842
 Transfer to Reserves 0
 -50 4,072
 -100
 -150
 1 2 3 4 5 Premiums Claims Expenses Cash from NB strain FinRe Repayments Net
 and fees and and other existing of FinRe cashflow
 reserves
3. Reflects as a stable emergence of profit over time

 100
 75
 • Significant cashflow generation of cR7.8bn from existing book
 50
 IFRS Earnings
 25 • Investment into new business of cR3.1bn
 0
 1 2 3 4 5
 • Positive net cashflow generation for Life company

 33
Illustrative simplified example of a 5-year Term Life policy
Insurance policy fair value principles are best illustrated when compared
 to a Bond instrument
 Bond Insurance Policy

Cashflows
Simplified 5-year
cash flow profile 0 1 2 3 4 5
 0 1 2 3 4 5

 Initial Investment Coupons Initial expenses (IE) IE loadings Net Cashflows above IE loadings (Margins)

 Income Statement Item Bond valuation terminology Income Statement Item Reserving terminology
 Premiums
Income
 = ℎ = ℎ
Statement Investment Income
 =
 Claims
 = +
 Expenses

 Fair value adjustment = ( = ∆
 Transfer from Assets under insurance contracts
 (Mark-to-Market) − −1 ) = − −1

 - Bond purchase - Initial Expenses
 Assets Under
Balance Bond Asset Cash Insurance Cash
Sheet Contracts

 + Interest Rate Coupon + Interest Rate + Margins
 IE Loadings
 x Market Valuet-1 x NegRest-1
 34
IFRS reserve assumptions include significant margins vs Best Estimate
assumptions
Published variances are on a best estimate basis hence Expected to realise the full IFRS Negative Rand Reserve
don’t allow for these margins (NRR) in cash in the first 16 years
 Assumption Prescribed reserving margins**
 Years
 Mortality 7.5%
 1 6 11 16 21 26 31 36
 Morbidity 10%
 Lapses 25% Reserve equivalent to
 best estimate cash flows
 Expenses 10% in first c16 years
 Expense Inflation 10%
 Margins increases
 Interest rates 0.25% additive reserve by c40%

 Cumulative of discounted best estimate cash flows
 Full IFRS Reserve at June 2019
Historic non-economic experience variances: EV vs. IFRS reserving basis
R million, includes DSY Life and Invest

 • Significant margins in IFRS basis
 • Discovery life has never experienced
 negative variances relative to the IFRS
 reserving basis
 • >R9bn IFRS gross of tax margin over last
 decade
 Jun 2010 Jun 2011 Jun 2012 Jun 2013 Jun 2014 Jun 2015 Jun 2016 Jun 2017 Jun 2018 Jun 2019

 EV Basis Reserving Basis
 **Discretionary margins may be added Discounted at the term structure of interest rates

 35
Allowing for these margins in the IFRS basis the IFRS NRR exhibits a high degree of
resilience
 Assumptions
 Available margin under various 1 in 200 stresses Resilient under 1/200 stresses

 Compulsory and RESILIENCE TESTING
 Discretionary
 margins

 Base Nominal Int Rate Real Int Rate Up Mortality Morbidity Lapse Mass Lapse level up Expense Mortality Morbidity 1-in-200
 Up Catastrophe Catastrophe
 INDIVIDUAL SAM STRESSES APPLIED

 15%
 Mortality
 40% Mass 50% level The risk of emerging cashflows being
 lapse Lapse Up
 Up stress lower than the recognised IFRS NRR is
 Assets under extremely remote
 insurance
 contracts and Risk of reserving strain does remain
 other negative Economic Value under each stress >
 liabilities Recognised IFRS NRR at 30 June 2017

 Economic Value highly resilient

 Economic Negative Rand Reserve Recoverable with >99.5% probability

Detailed Resilience of NRR technical paper based on June 2017 analysis available
on website 36
DMTN Issuance

 37
Key features of the DMTN programme
ISSUER Discovery Limited
SIZE (NOMINAL AMOUNT) R10 billion of which 4 issuances made totalling R2.2 billion
GUARANTORS Discovery Health and Discovery Vitality (as per current SA Bank Loans)
LISTING The Interest Rate Market of the JSE Limited
 Notes that can be issued under the Programme may comprise:
 • Senior notes (the “Senior Notes”);
TYPES OF NOTES • Subordinated notes which are subordinated to the Senior Notes (the “Subordinated Notes”); and/or
 • Capital subordinated notes with terms capable of qualifying the proceeds of such Notes as Regulatory Capital. Regulatory Capital Notes will require FSB approval at the
 time of Issuance.
CROSS DEFAULT The cross default will be triggered by a default by Discovery Limited and or its Guarantors in relation to the greater of R50m or 1% of EBITDA
 A material subsidiary is defined as:
 • any Guarantor; and
 • any Subsidiary
MATERIAL SUBSIDIARY • of which the Issuer owns more than 50% (fifty percent) of the ordinary shares and
 • which has EBITDA (calculated on an unconsolidated basis), representing 10% (ten percent) or more of the EBITDA of the Discovery Group (calculated on a
 consolidated basis), according to the methodology used in the latest audited financial statements of the Issuer, consistently applied, but excluding any Subsidiary

 Investors will have the option to redeem their Notes should the following events occur:
OPTIONAL REDEMPTION • Issuer is no longer listed on a Financial Exchange
EVENTS • The Notes are no longer listed on a financial Exchange
 • There is no rating assigned to the Notes
 Standard events of default including but not limited to non-payment, breach of the negative pledge, liquidation or winding up, judicial proceedings, cross default, inability
EVENTS OF DEFAULT
 to continue to operate the whole or substantial part of the business

 38
DMTN issuances to date

 Stock code DSY01 DSY02 DSY03 DSY04

 Nominal Value (Rm) 500 800 200 700

 Tenor (years) 5 7 7 8

 Date Issued 21-Nov-17 21-Nov-17 21-Nov-17 29-Aug-18

 Maturity Date 21-Nov-22 21-Nov-24 21-Nov-24 29-Aug-26

 Type of Notes Floating Rate Floating Rate Fixed Rate Floating Rate

 Pricing Benchmark 3m Jibar 3m Jibar 10.46% 3m Jibar

 Clearing spread (bps) 161 191 180

 Interest Payments Quarterly Quarterly Semi-annual Quarterly

 39
DMTN - Proposed Termsheet

 Stock code DSY05 DSY06 DSY07

 Nominal Value (Rm) Targeting between R1.25bn and R1.5bn

 Tenor (years) 3 5 7
 Week commencing Week commencing Week commencing
 Issue Date
 18-Nov-19 18-Nov-19 18-Nov-19
 Maturity Date Nov-22 Nov-24 Nov-26

 Type of Notes Floating/Fixed Rate Floating/Fixed Rate Floating/Fixed Rate

 Pricing Benchmark 3m Jibar 3m Jibar/ R186 3m Jibar / R186

 Clearing spread (bps) TBA TBA TBA

 40
Disclaimer

Strictly private and confidential
This presentation has been prepared by Discovery Limited (“Discovery”).

The information contained in this presentation is confidential and intended solely for the intended recipient. This presentation may contain information
proprietary to Discovery and accordingly may not be reproduced, acted upon or disseminated in whole or in part without Discovery’s prior written consent. By
attending this presentation the Attendee undertakes to keep the information contained in the presentation confidential and not to do any act or allow same to be
done on his/her behalf which is in breach of the abovementioned prohibition.

This presentation contains information prepared by Discovery, which has not been independently verified or audited.

Any liability of whatsoever nature and howsoever arising on the part of Discovery, its directors, officers, employees and agents relating to the contents of this
presentation is hereby expressly disclaimed.

This presentation is intended for discussion purposes only.

 41
Domestic Medium Term Note Programme
Deal Roadshow

November 2019

 42
43
44
You can also read