Downhill, Ultrafast and Fast Folding Proteins Revised - MDPI
←
→
Page content transcription
If your browser does not render page correctly, please read the page content below
International Journal of
            Molecular Sciences

Article
Downhill, Ultrafast and Fast Folding Proteins Revised
Mateusz Banach 1 , Katarzyna Stapor 2 , Leszek Konieczny 3 , Piotr Fabian 2              and
Irena Roterman 1, *
 1    Department of Bioinformatics and Telemedicine, Jagiellonian University—Medical College, Lazarza 16,
      31-533 Krakow, Poland; mateusz.banach@uj.edu.pl
 2    Institute of Computer Science, Silesian University of Technology, Akademicka 16, 44-100 Gliwice, Poland;
      katarzyna.stapor@polsl.pl (K.S.); piotr.fabian@polsl.pl (P.F.)
 3    Chair of Medical Biochemistry, Medical College, Jagiellonian University, Kopernika 7,
      31-034 Krakow, Poland; mbkoniec@cyf-kr.edu.pl
 *    Correspondence: myroterm@cyf-kr.edu.pl; Tel.: +48-12-619-96-93

 Received: 30 August 2020; Accepted: 11 October 2020; Published: 15 October 2020

 Abstract: Research on the protein folding problem differentiates the protein folding process with
 respect to the duration of this process. The current structure encoded in sequence dogma seems to
 be clearly justified, especially in the case of proteins referred to as fast-folding, ultra-fast-folding or
 downhill. In the present work, an attempt to determine the characteristics of this group of proteins
 using fuzzy oil drop model is undertaken. According to the fuzzy oil drop model, a protein is a
 specific micelle composed of bi-polar molecules such as amino acids. Protein folding is regarded
 as a spherical micelle formation process. The presence of covalent peptide bonds between amino
 acids eliminates the possibility of free mutual arrangement of neighbors. An example would be the
 construction of co-micelles composed of more than one type of bipolar molecules. In the case of fast
 folding proteins, the amino acid sequence represents the optimal bipolarity system to generate a
 spherical micelle. In order to achieve the native form, it is enough to have an external force field
 provided by the water environment which directs the folding process towards the generation of a
 centric hydrophobic core. The influence of the external field can be expressed using the 3D Gaussian
 function which is a mathematical model of the folding process orientation towards the concentration
 of hydrophobic residues in the center with polar residues exposed on the surface. The set of proteins
 under study reveals a hydrophobicity distribution compatible with a 3D Gaussian distribution, taken
 as representing an idealized micelle-like distribution. The structure of the present hydrophobic core
 is also discussed in relation to the distribution of hydrophobic residues in a partially unfolded form.

 Keywords: ultrafast folding; downhill folding; hydrophobic core

1. Introduction
     Despite many years of research [1], the mechanism of the protein folding process remains
unresolved. The protein folding process turns out to be varied, including the time it takes to obtain
the native structure. There are proteins with a small number of amino acids in the chain which are
characterized by a very fast folding process. This group of proteins is known as fast-folding, ultrafast
folding or downhill [2].
     Another group of proteins are those that fold on their own, although the participation of the
ribosome is required [3]. An example of an extremely demanding process is the folding process which
requires the participation of chaperones or chaperonins [4–8].
     When discussing the issue of protein folding, the presence of many intrinsically disordered
proteins should also be noted [9]. Generally speaking, in statistical terms, the course of the folding
process should last a very long time [10]. However, this is not so. Fast-folding proteins reach their

Int. J. Mol. Sci. 2020, 21, 7632; doi:10.3390/ijms21207632                           www.mdpi.com/journal/ijms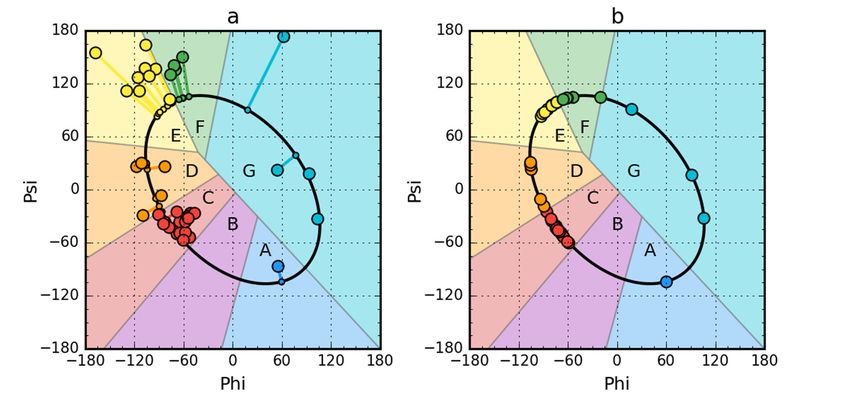
Int. J. Mol. Sci. 2020, 21, 7632                                                                     2 of 18

final structural form within a dozen microseconds [11]. The identified multi-stage nature of the
folding process introduces the term intermediates, the number of which is characteristic for a given
protein. [12–15]. An often identified state of partial unfolding is referred to as the molten globule
state [16,17].
      New perspectives are emerging with the appearance of techniques based on the “single molecule”
experiment, including nuclear magnetic resonance, relaxation dispersion NMR spectroscopy [18]
(in particular, photo-protection strategy [19]), as well as single molecule fluorescence spectroscopy
sub-millisecond conformational dynamics [20]. Single molecule fluorescence resonance energy transfer
(SM-FRET) utilizing fluorescent labeling and immobilization of proteins opens the possibility of
quantitative (temporal) analysis of the folding process for fast-folding proteins [21].
      Among the possible mechanisms of the protein folding process, hydrophobic collapse is
considered [22,23]. Thermodynamic analysis even suggests that the smallest proteins are expected to
have very marginal free energy barriers to folding [24–27]. The presence of specific secondary forms,
including the Beta-hair pin, is important in obtaining the final structure of the protein [28,29].
      A list of widely used experimental techniques is provided in a review [30]. The current analysis
takes into account the presence of the water environment in folding the protein structure. The influence
of the water environment on the structure of proteins as described by the fuzzy oil drop model
has already been discussed many times, including structures with distribution expressed by the 3D
Gaussian function and structures showing local incompatibility both in the form of local excess [31]
and deficit hydrophobicity [32].
      The conclusion drawn from these observations indicates that there are sequences that are capable
of generating structures with a highly ordered hydrophobic core. Local non-compatibility with the
idealized distribution can even be treated as intentional. This imperfection is a form of encoding
the biological function of a given protein. Proteins with micelle-like hydrophobicity distribution are
very soluble, but completely lack interaction opportunities with other molecules, except for surface
complexing of ions or low-molecular compounds on the basis of charge interaction. Proteins with a
high degree of similarity in the hydrophobicity distribution to the idealized one would be devoid of
their biological activity. It turns out, however, that the biological function of proteins with micelle-like
distribution is of biological importance in the case of antifreeze type III proteins, where high solubility
is desirable and where binding or complexation of other molecules is not expected [33].
      The aim of the presented analysis is to propose a folding mechanism for proteins characterized by
a fast-folding process based on the active participation of the water environment in the generation of a
hydrophobic core. This directs the process towards the concentration of hydrophobic residues in the
center with simultaneous exposure of polar residues on the surface [34–37].
      To demonstrate an additional factor promoting rapid reach of the native structure, partially
unfolded structures based on the early-stage model have also been included in the analysis [38–40].
Partially unfolded structures that retain the fragmentary concentration of hydrophobic residues and
contain a seed for the construction of a hydrophobic core favor a high prognosis for a reversible process.

2. Results
     As previously mentioned, the potential high rate of folding of the polypeptide chain was considered
by evaluating the degree of generation of the hydrophobic core, in which the water environment was
actively involved as the dominant factor. The hydrophobic core was regarded as an important factor
stabilizing the tertiary structure (apart from the disulfide bonds). According to the fuzzy oil drop
model, the term “presence of a hydrophobic core” means both the concentration of high hydrophobicity
in the center of the molecule together with the presence of a polar surface coating.
     The status expressed by the values of RD (Relative Distance) parameters for both the native and
partially unfolded forms is given in Table 1. Figure 1 presents the idea of obtaining a partially unfolded
form generated based on the Phie and Psie angles.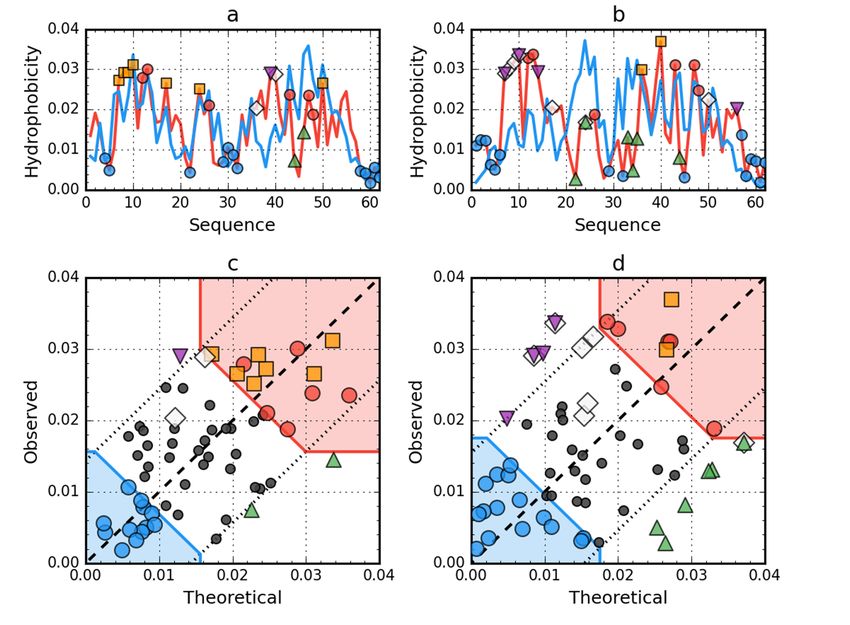
Int. J. Mol. Sci. 2020, 21, 7632 3 of 18
Table 1. The values of the RD (Relative Distance) parameter for proteins under study.
RD—LS after Fragment RD—ES after Fragment
PDB ID RD—LS RD—ES
Selection/Elimination Selection/Elimination
2CYU 0.638 3-helix system 0.493 0.540 18–23 0.431
2L6Q 0.473 0.595 7–10,21–26 0.488
2L6R 0.477 34–37 eliminated 0.462 0.439
12–33 selected 0.349
1BBL 0.556
38–48 selected 0.311
2WXC 0.382 0.525 165-C-term 0.441
2A3D 0.580 21–24 eliminated 0.474 0.710 28–45 selected 0.474
2F21 0.402 0.761
1–49 selected 0.520 0.657
50–163
Int. J. Mol. Sci. 2020, 21, x FOR PEER selected
REVIEW 0.310 0.697 3 of 18
2P6J 0.298 0.504 helix 5–17
The status expressed by the values of RD (Relative Distance) parameters for both the native and
ES (early, limited conformational sub-space) and LS (late stage, structure available in PDB) forms, respectively.
partially
Selected: unfolded
status of theforms is given
given fragment in Table
showing 1. accordance;
the local Figure 1 Eliminated:
presents the idea
the RD ofafter
value obtaining a of
elimination partially
a given fragment; Helix orientation: only the re-orientation
unfolded form generated based on the Phie and Psie angles. of a given helix expected for lowering the RD value;
Values in bold: structure with RD above 0.5.
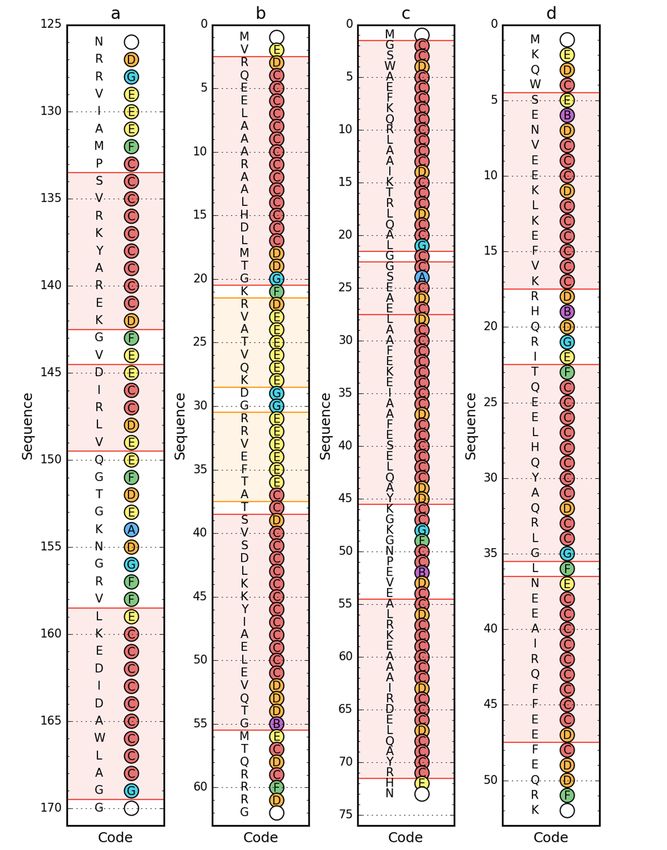
Figure 1. Model
Figure of of
1. Model a partially unfolded
a partially unfoldedstructure forfor
structure peripheral-subunit binding
peripheral-subunit domain
binding domain(PDB ID:ID:
(PDB
1W4E) protein used as example. (a) Phi, Psi angles distribution in the structure available in
1W4E) protein used as example. (a) Phi, Psi angles distribution in the structure available in PDBPDB
transformed to the appropriate Phie and Psie angles (shortest distance criterion). (b) Status after
transformed to the appropriate Phie and Psie angles (shortest distance criterion). (b) Status after
transformation and optimization. The colors distinguish the zones. A–G are defined according to
transformation and optimization. The colors distinguish the zones. A–G are defined according to
seven local maxima on the ellipse path (limited conformational sub-space). The ellipse path defined
seven local maxima on the ellipse path (limited conformational sub-space). The ellipse path defined
according to Phi, Psi change causing the change of radius of curvature of the polypeptide.
according to Phi, Psi change causing the change of radius of curvature of the polypeptide.
Partially unfolded structures for all the proteins under study were obtained as shown in Figure 1.
Partially unfolded structures for all the proteins under study were obtained as shown in Figure 1.
The proteins presented in Table 1 show RD values below 0.5 in the vast majority for the native
structures available in PDB. The structure of the e3-binding domain (PDB ID: 2CYU) for the complete
Table 1. The values of the RD (Relative Distance) parameter for proteins under study.
structure shows an RD greater than 0.5. However, this value is due to loose loops. The system of
RD—LS
three helices constituting the main after
part of whole molecule shows RD =RD—ES
theFragment afterindicates
0.493, which Fragment the
PDB ID RD—LS RD—ES
Selection/Elimination
formation of a hydrophobic concentration in the center of the molecule. Selection/Elimination
2CYU
The molecule0.638 3-helix system
1BBL, also showing an RD above 0.493 0.540the value to
0.5, reduces 18–23
0.462 when the 0.431
four
2L6Q
residues 0.473
in the loop are eliminated. Moreover, the status of two 0.595
components 7–10,21–26 0.488
of the whole molecule
2L6Rof helical
composed 0.477
fragments34–37
12–33eliminated 0.462
and 38–48 (neglecting 0.439
the loose loop) indicates a very high
adjustment of the hydrophobicity distribution
12–33 selected to the0.349
micellar system (both values below 0.4).
1BBL 0.556
38–48 selected 0.311
2WXC 0.382 0.525 165-C-term 0.441
2A3D 0.580 21–24 eliminated 0.474 0.710 28–45 selected 0.474
2F21 0.402 0.761
1–49 selected 0.520 0.657
50–163 selected 0.310 0.697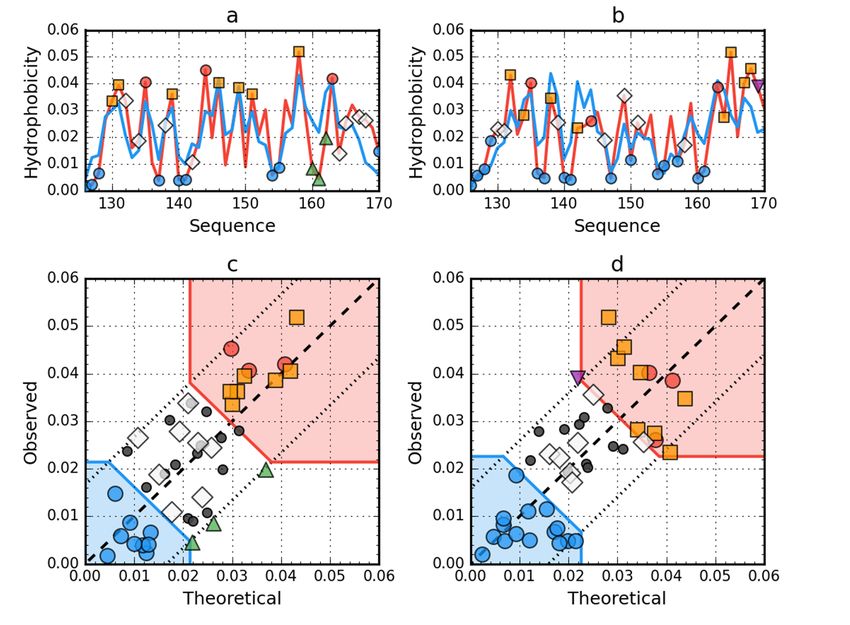
Int. J. Mol. Sci. 2020, 21, x FOR PEER REVIEW 4 of 18
The molecule 1BBL, also showing an RD above 0.5, reduces the value to 0.462 when the four
residues in the loop are eliminated. Moreover, the status of two components of the whole molecule
Int. J. Mol. Sci. 2020, 21, 7632 4 of 18
composed of helical fragments 12–33 and 38–48 (neglecting the loose loop) indicates a very high
adjustment of the hydrophobicity distribution to the micellar system (both values below 0.4).
The
The hypothesis
hypothesis thatthat the active
the active participation
participation of theof the environment
water water environment in folding,
in protein protein in
folding,
which in
thewhich the formation
formation of the hydrophobic
of the hydrophobic core is important,
core is important, has been demonstrated.
has been demonstrated.
2.1.2.1.
Peripheral-Subunit Binding
Peripheral-Subunit Domain
Binding (1W4E)
Domain (1W4E)
The peripheral-subunit
The peripheral-subunit binding
binding domain
domain(PDB ID:ID:
(PDB 1W4E)
1W4E)represents
representsa set of of
a set models
modelswith an an
with
identical
identical sequence. The status of both the native and partially unfolded form shows the presencea of
sequence. The status of both the native and partially unfolded form shows the presence of
high
a degree of arrangement
high degree compatible
of arrangement with the fuzzy
compatible with oil
thedrop model.
fuzzy oil In this model.
drop case, theInreconstruction
this case, the
of reconstruction
a structure withofa ahigh degreewith
structure of packing
a high which
degreesatisfies the conditions
of packing resulting
which satisfies from this model,
the conditions resulting
is obvious
from this(Figure
model,2).
is obvious (Figure 2).
Figure 2. Hydrophobicity
Figure 2. Hydrophobicity density
densitydistributions
distributionsand 3D3D
and presentation
presentationof native (a,c,e)
of native andand
(a,c,e) early stage
early stage
(b,d,f) forms of peripheral-subunit binding domain (PDB ID: 1W4E). Blue line on (a,b):
(b,d,f) forms of peripheral-subunit binding domain (PDB ID: 1W4E). Blue line on (a,b): theoretical theoretical
distribution
distribution(T); red
(T); line
red lineonon(a,b):
(a,b):observed
observed distribution (O); red
distribution (O); red zone
zoneon on(c,d):
(c,d):hydrophobic
hydrophobic core;
core; blue
blue zone on (c,d): hydrophilic surface; red circle markers: common hydrophobic
zone on (c,d): hydrophilic surface; red circle markers: common hydrophobic core members in both core members in
both models;
models; orange
orange square
square markers:
markers: hydrophobic
hydrophobic corecore members
members in this
in this model
model but in
but not not
theinother
the other
model;
model;
white rhombus markers: hydrophobic core members in other model but not in this model model
white rhombus markers: hydrophobic core members in other model but not in this (possible
(possible
overlap overlap with markers);
with other other markers); blue circle
blue circle markers:
markers: hydrophilic
hydrophilic surface
surface members
members in this
in this model;
model; green
green triangle markers: T value >> O value; purple triangle markers: T value > O value; purple triangle markers: T value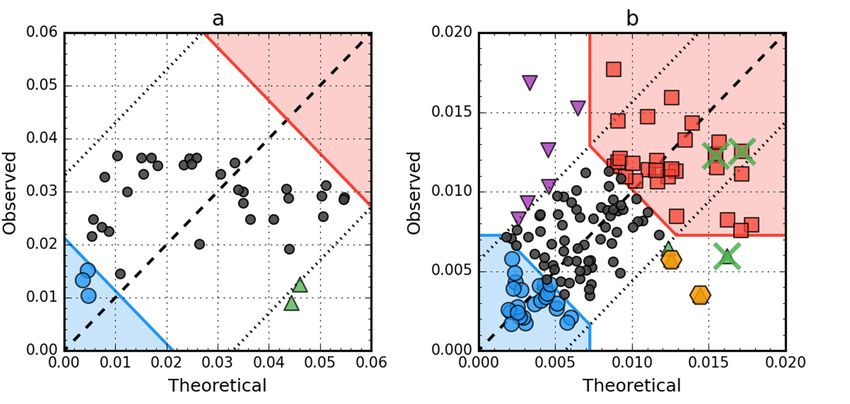
Int. J. Mol. Sci. 2020, 21, x FOR PEER REVIEW 5 of 18
hydrophobically
Int. J. Mol. Sci. 2020, 21, 7632insignificant residues. Colored segments on (e,f) correspond to markers of the same
5 of 18
color on (a–d), respectively (hydrophobic core is shown as surface).
2.2. WW
2.2. Protein of of
Protein Bacteriophage Lambda
Bacteriophage (2L6Q)
Lambda (2L6Q)
The
Thestructure
structure of of
WW protein
proteinof of
bacteriophage
bacteriophage lambda
lambda (PDB
(PDB ID:ID:
2L6Q)
2L6Q)shows
shows thethepresence
presence of of
anan
arranged
arrangedcore in in
core itsits
native form
native form(Figure
(Figure 3 and
3 andTable 1).1).
Table InIn
thethe2L6R,
2L6R, thethepresence
presence ofofthe fuzzy
the fuzzy oiloil
drop
drop
model
modelarrangement
arrangement was
wasalso demonstrated
also demonstrated in in
a partially
a partiallyunfolded
unfolded form.
form.InIn
the case
the of of
case thethe
unfolded
unfolded
2L6Q,
2L6Q,only
onlythe
thesegment
segmentBeta-strand
Beta-strand 22–28 showsshows aalocal
localdistribution
distributiondifferent
differentfrom
from thethe expected
expected one.
one.
TheThe
lowlowRDRD valuefor
value forthe
thenative
nativeform,
form, however,
however, suggests that that the
theprocess
processofofhydrophobic
hydrophobiccore core
generation
generationgives
givesthis segment
this segment a status compatible
a status compatible with
withthethe
idealized
idealized distribution
distribution(Figure
(Figure3a).3a).
Figure Hydrophobicity
3. 3.
Figure Hydrophobicity density
density distributions
distributions and
and 3D3D
presentation
presentation of of
native
native(a,c,e) and
(a,c,e) andearly stage
early stage
(b,d,f) forms
(b,d,f) formsof of
WW protein
proteinof of
bacteriophage
bacteriophage lambda
lambda (PDB
(PDB ID:ID:
2L6Q).
2L6Q). Blue
Blueline onon
line (a,b): theoretical
(a,b): theoretical
distribution
distribution(T);
(T);red
redline
lineon
on(a,b):
(a,b): observed distribution
distribution (O);
(O);red
redzone
zoneonon(c,d):
(c,d): hydrophobic
hydrophobic core;
core; blue
blue zone on (c,d): hydrophilic surface; red circle markers: common hydrophobic
zone on (c,d): hydrophilic surface; red circle markers: common hydrophobic core members in both core members in
both models; orange square markers: hydrophobic core members in this model
models; orange square markers: hydrophobic core members in this model but not in the other model.but not in the other
model.
WhiteWhite rhombus
rhombus markers:markers: hydrophobic
hydrophobic core members
core members in otherinmodel
other model
but notbut not model
in this in this (possible
model
(possible
overlapoverlap withmarkers);
with other other markers); blue circle
blue circle markers:
markers: hydrophilic
hydrophilic surfacesurface
membersmembers in model;
in this this model;
green
green triangle markers: T value >> O value; purple triangle markers: T value > O value; purple triangle markers: T value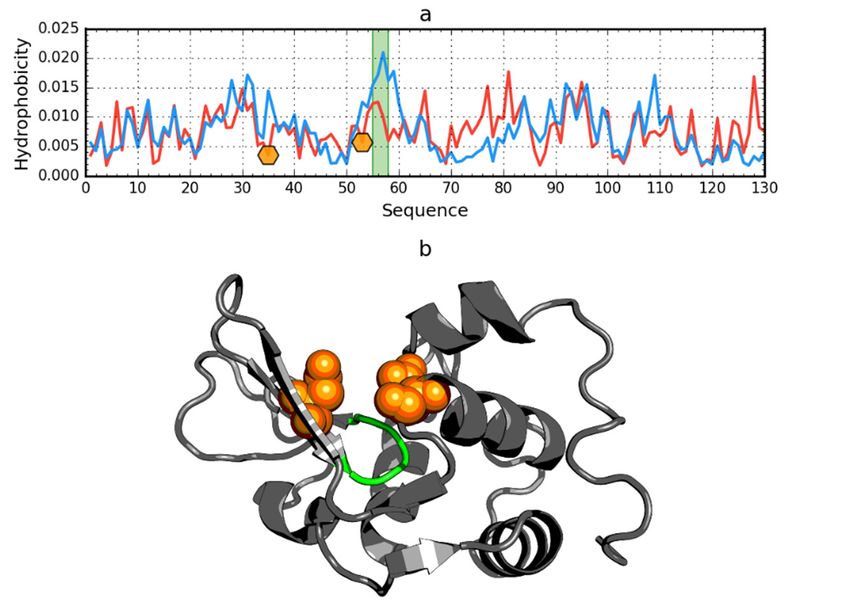
Int. J. Mol. Sci. 2020, 21, 7632                                                                                                  6 of 18
        Int. J. Mol. Sci. 2020, 21, x FOR PEER REVIEW                                                                            6 of 18

     2.3. Other
2.3. Other      Proteins
           Proteins
          The analysis of two further sample proteins (thermostable protein variant engrailed
     The analysis of two further sample proteins (thermostable protein variant engrailed homeodomain
     homeodomain (PDB ID: 2P6J) and de novo designed triple helix bundle protein (PDB ID: 2A3D)) are
(PDB ID: 2P6J) and de novo designed triple helix bundle protein (PDB ID: 2A3D)) are included in
     included in Supplementary Materials (Figures S1 and S2) to avoid redundancy.
Supplementary Materials (Figures S1 and S2) to avoid redundancy.
     2.4. Comparative Analysis of Partially Unfolded Structures
2.4. Comparative Analysis of Partially Unfolded Structures
           Using a set of structural codes (A–G) where C stands for the right-handed helix, E stands for the
     Using a set of structural codes (A–G) where C stands for the right-handed helix, E stands for the
     beta structure and G represents the left-handed helix, the presence of these forms of the secondary
beta structure and G represents the left-handed helix, the presence of these forms of the secondary
     structure of the proteins in question was determined (Figure 4). The D code, which expresses a
structure of the proteins in question was determined (Figure 4). The D code, which expresses a structural
     structural form intermediate between the helix and the beta form, is also worth mentioning. Also
formimportant
      intermediate
                 is thebetween  the helix
                        F code, which     and thethe
                                       represents  beta  form,
                                                      forms     is alsoatworth
                                                              present     the endmentioning.   Also important
                                                                                  of the beta strand,            is
                                                                                                       introducing
the Facode,  whichreduction
       significant   representsinthe
                                  theforms
                                      radiuspresent  at the in
                                             of curvature    end  of the to
                                                               relation   beta
                                                                            thestrand,  introducing
                                                                                large radius  values afor
                                                                                                        significant
                                                                                                          the beta-
reduction  in the
     strand form.  radius  of curvature  in relation to the  large radius   values  for the beta-strand   form.

      Figure  4. Sequence
            Figure             (left)(left)
                     4. Sequence       andand
                                            structural    codes
                                                 structural      (right)
                                                             codes       of of
                                                                    (right) peripheral-subunit
                                                                               peripheral-subunitbinding
                                                                                                      bindingdomain
                                                                                                                domain (PDB
                                                                                                                          (PDB ID:
      1W4E)   (a); W(a);
            1W4E)     protein    of bacteriophage
                           W protein                  lambda
                                         of bacteriophage       (PDB ID:
                                                              lambda       2L6Q)
                                                                        (PDB   ID: (b);
                                                                                   2L6Q)de novo
                                                                                           (b); dedesigned    triple helix
                                                                                                    novo designed           bundle
                                                                                                                       triple helix
      protein  (PDBprotein
            bundle     ID: 2A3D)
                               (PDB(c);ID:and  thermostable
                                            2A3D)               protein variant,
                                                    (c); and thermostable    proteinengrailed
                                                                                      variant, homeodomain        (PDB ID: (PDB
                                                                                                engrailed homeodomain         2P6J)
            ID: 2P6J)
      (d). Colors   of (d). Colorsmarkers
                        the circle    of the circle markers correspond
                                                correspond     to structuraltocodes
                                                                               structural codesB:
                                                                                      (A: blue,   (A:purple,
                                                                                                      blue, B:C:purple,
                                                                                                                  red, D:C:orange,
                                                                                                                            red, D:
            orange,
      E: yellow,   F: E:  yellow,
                      green,        F: green,
                               G: cyan).       G: cyan).
                                             Chain   terminiChain
                                                               are termini
                                                                    markedare bymarked    by blank
                                                                                  blank circles.   Thecircles.
                                                                                                         framesTheare
                                                                                                                    frames   are as
                                                                                                                       as follows:
            follows:
      red, helical    red,(code
                    form    helicalCform    (code Cyellow/orange,
                                       expected);     expected); yellow/orange,
                                                                       β-structuralβ-structural    (code E expected).
                                                                                      (code E expected).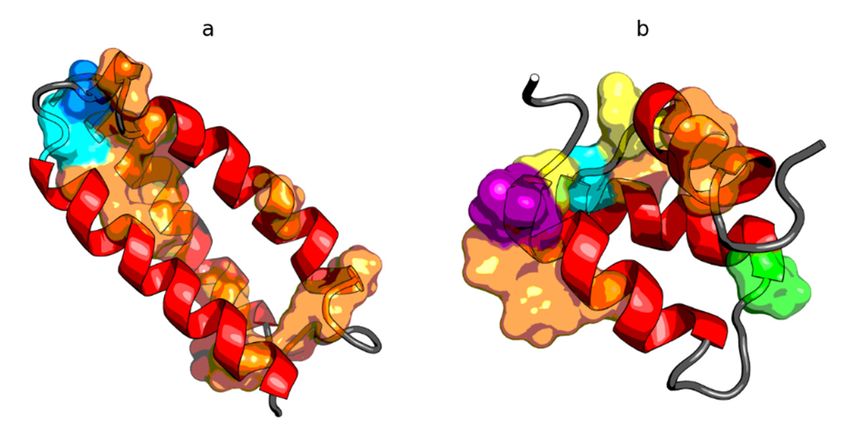
Int. J. Mol. Sci. 2020, 21, 7632 7 of 18
Int. J. Mol. Sci. 2020, 21, x FOR PEER REVIEW 7 of 18
The form of secondary
secondary structure
structureas asclassified
classifiedby byPDB
PDB[40][40]with
withPROMOTIF
PROMOTIF [41] turns
[41] outout
turns to be
to
different
be to to
different those
thosedetermined
determined bybystructural
structuralcodes
codes(Figure
(Figure5).5). This
Thisisis especially
especially true engrailed
true of engrailed
homeodomain(PDB
homeodomain (PDBID: ID: 2P6J),
2P6J), where
where in helical
in helical fragments
fragments 5–17
5–17 and andare
23–35 23–35 are alsobydefined
also defined by
structural
structural
codes othercodes
thanother
C. In than
otherC. In other
cases, cases, differing
the codes the codesfromdiffering from theform
the classified classified
occurform
onlyoccur
for theonly
N-
for the
and N- and C-terminal
C-terminal residues insegments.
residues in individual individualThissegments. This is an
is an irrelevant irrelevant
difference fromdifference
the pointfrom the
of view
point
of of view of
determining thedetermining the status
status of a given residueofina the
given residue
context of thein accompanying
the context of segment.
the accompanying
However,
segment.
it stronglyHowever,
influencesitthe
strongly influences
formation the formation
of ES structural form.of ES structural form.
Figure 5. 3D presentation of de novo designed triple helix bundle protein (PDB ID: 2A3D) (a) and
Figure 5. and
engrailed
engrailed homeodomain
homeodomain (PDB(PDB ID:
ID: 2P6J)
2P6J) (b) with localization of residues representing structural
structural codes
other than the expected C within the helical fragments. These discrepancies are shown as the surface,
with
with colors
colors matching
matching the
the color
color codes
codes in
in Figure
Figure 4c
4c or
or Figure
Figure 4d
4d respectively
respectively (the
(the helices
helices themselves
themselves are
are
red, just like code C is represented by red on Figure
red, just like code C is represented by red on Figure 4).4).
2.5. Negative Control
2.5. Negative Control
Among the proteins acting as an anti-freeze agent is the winter flounder derived protein (PDB ID:
Among the proteins acting as an anti-freeze agent is the winter flounder derived protein (PDB
1WFA). This short polypeptide chain (37 aa) does not generate a globular form; instead, it takes the form
ID: 1WFA). This short polypeptide chain (37 aa) does not generate a globular form; instead, it takes
of a helix that spans the entire chain. This form is unable to generate a hydrophobic core. The use of the
the form of a helix that spans the entire chain. This form is unable to generate a hydrophobic core.
fuzzy oil drop model unanimously reveals the status of this protein as not representing a micelle-like
The use of the fuzzy oil drop model unanimously reveals the status of this protein as not representing
form. The RD value for this protein is 0.837. The T and O profiles illustrating the hydrophobicity
a micelle-like form. The RD value for this protein is 0.837. The T and O profiles illustrating the
distribution show the expected hydrophobicity concentration, which was not observed (Figure 6).
hydrophobicity distribution show the expected hydrophobicity concentration, which was not
There was also no significant reduction in the level of observed hydrophobicity as one approached the
observed (Figure 6). There was also no significant reduction in the level of observed hydrophobicity
terminal positions of xthe amino acids.
asInt.
one J. Mol. Sci. 2020, 21,
approached theFOR PEER REVIEW
terminal positions of the amino acids. 8 of 18
In addition to the drastic example of the incompatibility of the hydrophobicity distribution
versus the idealized distribution, human lysozyme is an example of a protein (PDB ID: 1LZ1) with
clearly marked fragments with the distribution O and T highly compatible with the present chain
segments showing local incompatibility (Figure 7).
The region of incompatibility is located in the active center of this enzyme, as shown by the
compared T and O profiles of this protein. The RD value for lysozyme is 0.529. The elimination of the
catalytic residues (35 and 53) from the status calculations (according to divergence entropy) results
in the reduction of the RD value to 0.515. After further elimination of residues 55–58, the value RD =
0.499 was obtained. It should be noted that residues 55–58 are located in the immediate vicinity of
the active site and are probably an integral component of the active site (Figure 7).
The elimination of the indicated distributions
6. 6.Hydrophobicity residues (catalytic and a segment in the immediate vicinity of
Figure
Figure Hydrophobicitydensity (a) and
density distributions (a) and3D
3Dpresentation
presentation (b)(b)
of of antifreeze
antifreeze protein
protein from
the catalytic
from residues)
winter flounderresultingID:
in an RD value less than 0.5 indicates that the
(T); entire remainder
observedof the
winter flounder (PDB(PDB 1WFA).
ID: 1WFA). Bluetheoretical
Blue line: line: theoretical distribution
distribution (T); red line: red line:
observed distribution
chaindistribution
satisfies
(O).
the
(O).micelle-like degradation conditions. It also means that the remainder of the chain
guarantees the solubility of the protein in question.
In addition to the drastic example of the incompatibility of the hydrophobicity distribution versus
the idealized distribution, human lysozyme is an example of a protein (PDB ID: 1LZ1) with clearly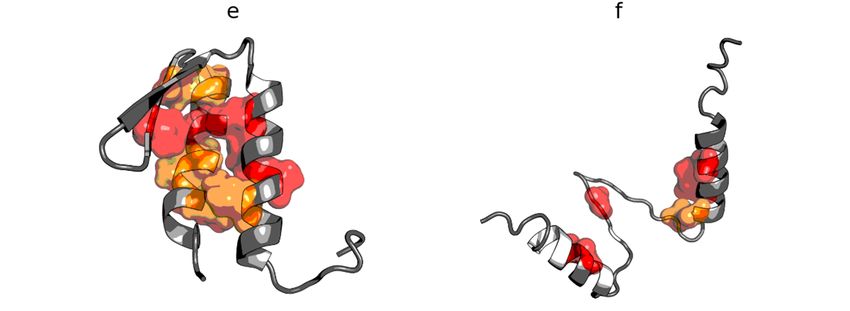
Int. J. Mol. Sci. 2020, 21, 7632                                                                                     8 of 18

          Figure 6. Hydrophobicity density distributions (a) and 3D presentation (b) of antifreeze protein from
markedwinter
       fragments   with
             flounder   theID:
                      (PDB  distribution
                               1WFA). BlueOline: T highly distribution
                                            andtheoretical compatible(T);
                                                                       with
                                                                          redthe present
                                                                              line:       chain
                                                                                    observed     segments
                                                                                             distribution
showing local
      (O).    incompatibility  (Figure 7).

      Figure  7. 7.Hydrophobicity
         Figure     Hydrophobicitydensity
                                     density distributions  (a) and
                                             distributions (a)   and3D
                                                                     3Dpresentation
                                                                         presentation(b)(b)
                                                                                          of of human
                                                                                             human       lysozyme
                                                                                                     lysozyme    (PDB
      (PDB   ID:  1LZ1).    Blue  line: theoretical  distribution   (T); red  line:   observed   distribution  (O).
         ID: 1LZ1). Blue line: theoretical distribution (T); red line: observed distribution (O). Orange markers
      Orange
         on (a)markers
                and orangeon spheres
                             (a) and on
                                      orange  spheres
                                         (b) denote     on (b)residues
                                                    catalytic    denote (E35,
                                                                         catalytic
                                                                               D53).residues  (E35, D53).
                                                                                      Green segments         Green
                                                                                                        on (a,b)  span
      segments
         residueon  (a,b)55–58.
                  range   span residue range 55–58.

     The   region O
        T versus     of plots
                        incompatibility
                               of these two is proteins
                                               located in    the active
                                                          (Figure         center of this
                                                                    8) corroborate          enzyme,
                                                                                      the above          as shown
                                                                                                     findings.  Therebyare
                                                                                                                         theno
compared     T   and  O  profiles   of this protein.     The  RD   value   for lysozyme      is 0.529.
   hydrophobic core members in the antifreeze protein (red zone in Figure 8a) and the location of         The  elimination
of residues
   the catalytic
              in theresidues   (35 and
                      T × O space        53) from
                                     suggests    verythe  status
                                                        low       calculations
                                                             correlation         (according
                                                                           between               to divergence
                                                                                     the distributions,      which entropy)
                                                                                                                     is in fact
results in the   reduction   of the  RD  value   to 0.515.  After  further  elimination    of
   approximately equal to 0.08. In the lysozyme, catalytic residues are marked by the FOD modelresidues   55–58,  the value as
    = 0.499 was
RDshowing           obtained.   It should   be  noted   that residues   55–58  are located    in  the  immediate
               hydrophobicity deficiency in the center of the molecule, just like the F57 and Q58, which            vicinity
of contribute
   the active site   andRD
                 to the   arevalue
                               probably
                                     beinganhigher
                                              integral   component
                                                      than  0.5. Theirof  the active (together
                                                                        elimination    site (Figure    7). the rest of the 55–
                                                                                                    with
   58 segment) is enough to offset the other increase of RD above 0.5 caused by three vicinity
     The   elimination    of  the  indicated   residues    (catalytic and   a segment     in the   immediate     exposedofcys
theresidues
    catalytic(numbers
                residues)6,resulting
                             77, 128), which can be seen as the top-most triangle markers (purple) onofFigure
                                       in an  RD   value   less than  0.5 indicates  that   the  entire  remainder       the
chain
   8b. satisfies the micelle-like degradation conditions. It also means that the remainder of the chain
guarantees the solubility of the protein in question.
     T versus O plots of these two proteins (Figure 8) corroborate the above findings. There are
no hydrophobic core members in the antifreeze protein (red zone in Figure 8a) and the location
of residues in the T × O space suggests very low correlation between the distributions, which is
in fact approximately equal to 0.08. In the lysozyme, catalytic residues are marked by the FOD
model as showing hydrophobicity deficiency in the center of the molecule, just like the F57 and Q58,
which contribute to the RD value being higher than 0.5. Their elimination (together with the rest of
the 55–58 segment) is enough to offset the other increase of RD above 0.5 caused by three exposed
cys residues (numbers 6, 77, 128), which can be seen as the top-most triangle markers (purple) on
Figure 8b.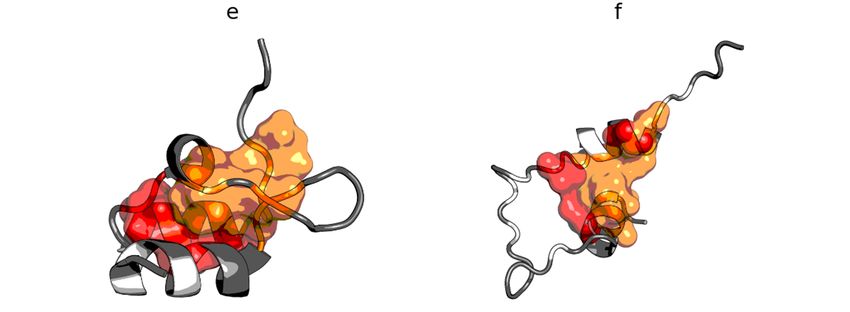
Int. J. Mol. Sci. 2020, 21, 7632                                                                                             9 of 18
   Int. J. Mol. Sci. 2020, 21, x FOR PEER REVIEW                                                                               9 of 18

     Figure
        Figure8. 8.Hydrophobicity
                    Hydrophobicitydensitydensity scatter
                                                   scatter plots   (X-axis:T,T,
                                                            plots (X-axis:      Y-axis:
                                                                              Y-axis: O) O)  of antifreeze
                                                                                         of antifreeze         protein
                                                                                                         protein   fromfrom
                                                                                                                          winter
     winter  flounder
        flounder     (PDB(PDB
                            ID: ID:  1WFA)
                                  1WFA)     (a)(a)
                                                andandhuman
                                                         humanlysozyme
                                                                  lysozyme (PDB
                                                                             (PDB ID:
                                                                                    ID: 1LZ1)
                                                                                        1LZ1) (b).
                                                                                                 (b).Red
                                                                                                      Redsquare
                                                                                                              squaremarkers:
                                                                                                                       markers:
     hydrophobic
        hydrophobic   corecore
                            members;    blue circle
                                 members;     blue markers:     hydrophilic
                                                      circle markers:         surface members;
                                                                         hydrophilic              green triangle
                                                                                       surface members;             markers:
                                                                                                                green    triangle
     T value  >>   O  value; purple   triangle  markers:    T value  > O value; purple triangle markers: T value  0.5, it is enough to eliminate single residues
   often in a protein with the status expressed by the value of RD > 0.5, it is enough to eliminate single
or small fragments of the chain to obtain the value of RD < 0.5. The residues identified in this way
   residues or small fragments of the chain to obtain the value of RD < 0.5. The residues identified in
often turn out to be catalytic residues or residues involved in the complexation of another protein.
   this way often turn out to be catalytic residues or residues involved in the complexation of another
This issue is discussed in the book [42] with a detailed analysis of examples.
   protein. This issue is discussed in the book [42] with a detailed analysis of examples.
      For the topic discussed in this article, it is also important to demonstrate the highly ordered
        For the topic discussed in this article, it is also important to demonstrate the highly ordered
hydrophobic core observed in titin [43]. This molecule, used in the SM-FRET method [21] as a
   hydrophobic core observed in titin [43]. This molecule, used in the SM-FRET method [21] as a frame
frame for the analysis of the protein unfolding process, has a single-step unfolding form. Therefore,
   for the analysis of the protein unfolding process, has a single-step unfolding form. Therefore, easy
easy identification of the unfolding of the frame for other proteins enables a detailed analysis of the
   identification of the unfolding of the frame for other proteins enables a detailed analysis of the
unfolding process of other proteins with more complex kinetics. The low RD value for the sandwich
   unfolding process of other proteins with more complex kinetics. The low RD value for the sandwich
domain observed in the immunoglobulin domains just in titin distinguishes it from many other
   domain observed in the immunoglobulin domains just in titin distinguishes it from many other
immunoglobulin-like domains [44]. The specificity of the incompatibility of the T and O distributions
   immunoglobulin-like domains [44]. The specificity of the incompatibility of the T and O distributions
in other immunoglobulin-like domains assigns them their specificity.
   in other immunoglobulin-like domains assigns them their specificity.
      The early-stage intermediate structure, based on the relaxed arrangement of peptide bond planes,
        The early-stage intermediate structure, based on the relaxed arrangement of peptide bond
reveals the degree of presence of a seed with a hydrophobic core. The presence of local hydrophobicity
   planes, reveals the degree of presence of a seed with a hydrophobic core. The presence of local
maxima compatible with those expected in the structure generated on the basis of Phie and Psie
   hydrophobicity maxima compatible with those expected in the structure generated on the basis of
angles(and thus partially unfolded) means that the further folding process will be an expansion of
   Phie and Psie angles(and thus partially unfolded) means that the further folding process will be an
the hydrophobic core. Protein folding simulations taking into account the influence of the water
   expansion of the hydrophobic core. Protein folding simulations taking into account the influence of
environment in the form of introducing an external force field directing the folding process consistent
   the water environment in the form of introducing an external force field directing the folding process
with 3D Gauss function were carried out [45]. A large-scale protein folding project taking into account
   consistent with 3D Gauss function were carried out [45]. A large-scale protein folding project taking
these external conditions is currently being implemented.
   into account these external conditions is currently being implemented.
      The widely discussed phenomenon of cooperativity in protein folding seems to have its
        The widely discussed phenomenon of cooperativity in protein folding seems to have its
mathematical expression [45]. Generation of the hydrophobic core requires cooperativity and is
   mathematical expression [45]. Generation of the hydrophobic core requires cooperativity and is the
the effect of a specific synergy, which is obtained in the process of folding in a way strongly dependent
   effect of a specific synergy, which is obtained in the process of folding in a way strongly dependent
on the amino acid sequence. For a given polypeptide chain, the degree of ease/difficulty to obtain
   on the amino acid sequence. For a given polypeptide chain, the degree of ease/difficulty to obtain this
this synergy is primarily expressed by the folding time. This ease is obviously determined by the
   synergy is primarily expressed by the folding time. This ease is obviously determined by the amino-
   acid sequence, which favors the micelle-like structure more or less. The proteins discussed here are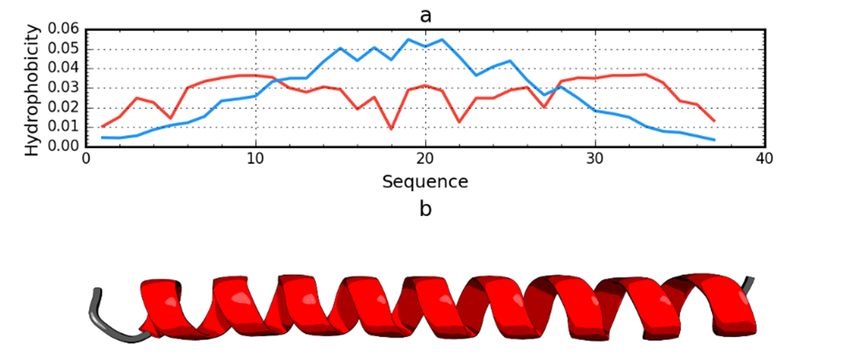
Int. J. Mol. Sci. 2020, 21, 7632                                                                    10 of 18

amino-acid sequence, which favors the micelle-like structure more or less. The proteins discussed here
are present in hyperthermophilic bacteria. The stable arrangement form of the hydrophobic core is
probably the reason for protein stability in these organisms.
     The entire non-redundant PDB database showed that a significant number of domains (over 90%)
have a hydrophobicity arrangement consistent with the 3D Gaussian distribution [46]. This is in strict
accordance with the reports on two-state systems present in protein domains as structural units [47].
     The same is true of antifreeze type III proteins, which show hydrophobicity distribution consistent
with the 3D Gauss distribution [48]. Interpretation of this phenomenon explains their antifreeze action
relying on the arrangement of water molecules in a way resulting from the distribution of charges on
the surface of this protein, which is different from those present in the ice structure.
     Noteworthy is the de novo protein synthesis experiment, the aim of which was to obtain a
significant structural change with a minimum number of introduced mutations. It was obtained for a
set of four proteins (56 aa), which differ in turn by one introduced mutation, resulting in alternating
structures: 2LHC—3α, 2LHD—4β + α, 2LHG 3α and 2LHE 4β + α [49]. The analysis carried out
on the basis of the fuzzy oil drop model showed that the cause of the different secondary structure
involved different chain fragments in the construction of the hydrophobic core [37].
     What do we learn from this paper that we did not know before?

1.    Protein folding is the process of micellization of bipolar molecules (amino acids are molecules
      with different forms of bipolarity) with limited freedom of movement resulting from the presence
      of peptide bonds [42].
2.    Down-hill proteins (fast-folding, ultrafast-folding) are proteins with an amino acid sequence that
      allows construction of a micelle-like structure, which in the case of antifreeze proteins guarantees
      solubility (i.e., the basic condition enabling the performance of a biological function, which is the
      order of water molecules imposed by the distribution of charges on the protein surface preventing
      the structuring present in the ice structure). This issue is discussed in this paper.
3.    Amino acid sequence determining the protein structure is a sequence with a specific coding
      system excluding the possibility of generating the perfect micelle, which is the local discordance
      versus 3D Gauss. The discordance is represented as local hydrophobicity deficiency and usually
      appears in the ligand or substrate binding cavity [32] or local hydrophobicity excess which is
      “used” by proteins to construct interfaces in protein–protein complexes [31]. Lysozyme is an
      example of cavity identification as shown in this paper.
4.    The form and degree of the encoded inability to reconstruct the micelle-like pattern determines
      the specificity of a given protein.
5.    In this context, amyloid (formed in physiological conditions) is also a result of micellization.
      The final product however takes the form of ribbon-like micelle since these polypeptides are not
      able to construct the globular forms [50].

     The above mentioned conclusions are the generalizations resulting from the current work but also
from the analysis of numerous proteins described in other publications [33–36,42,43,50]. The present
work discusses a set of proteins representing a high agreement of hydrophobicity distribution in
relation to an idealized distribution consistent with 3D Gauss function. In summary, proteins can
be defined as “intelligent micelles” with encoded local discordance which expresses the specificity
of particular protein molecules. “Amino acid sequence determines the structure” can be substituted
by, “amino acid sequence determines the form and degree of specific disability in forming the ideal
micelle.” This disability determines the specificity of the protein.
Int. J. Mol. Sci. 2020, 21, 7632 11 of 18
4. Materials and Methods
4.1. Data
The object of analysis are the proteins listed in Table 2. They represent examples of proteins
classified as fast folding. Proteins except de novo, viral and ones derived from Homo sapiens are
bacterial proteins.
Table 2. List of proteins under consideration in this paper.
PDB-ID Protein Chain Length Characteristics Ref
2CYU e3-binding domain 39 aa Downhill [51]
2L6Q Viral protein 62 aa [52]
2L6R Viral protein 62 aa [53]
Peripheral-subunit
1W4E 45 aa Ultrafast [54]
binding domain
1W4F 45 aa [54]
1W4G 45 aa [54]
1W4H 45 aa [54]
2BTH 45 aa [54]
1W4J 51 aa [54]
1W4K 51 aa [54]
1BBL 37 aa [55]
2WXC 47 aa [56]
Negative Control
1WFA Antifreeze 37 aa Antifreeze [57]
1LZ1 Lysozyme 130 aa Enzyme [58]
The list of proteins that are the subject of analysis also includes a negative example in the sense of
being assessed by the fuzzy oil drop model. It is a protein of small size (37 aa) taking a helical form
along the entire chain length. This form, not representing the globular form, does not necessarily
generate the presence of a hydrophobic core.
4.2. Late Stage Model—Fuzzy Oil Drop
The fuzzy oil drop model (FOD) has already been described in detail [59–61]. The oil drop model
introduced by Kauzmann [62] was modified to form the fuzzy oil drop model. There are two levels in
this model, which are high in the center of the molecule and low in the surface layer. These have been
modified to a continuous form by introducing a 3D Gaussian function spread over the protein molecule.
In this situation, each amino acid can be assigned the so-called Ti , which is the level of hydrophobicity
resulting from the location of a given residue represented by the effective atom (averaged position of
atoms making up the amino acid). This is the so-called idealized level (i.e., the level that a given residue
would represent if the distribution was completely compatible with the theoretical distribution (T)).
In order to determine the status consistent with the 3D Gaussian distribution, the following
function was used:
−(xi − x)2 −( yi − y)2 −(zi − z)2
T
e = 1
H i T
exp exp exp . (1)
Hsum 2σ2x 2σ2y 2σ2zInt. J. Mol. Sci. 2020, 21, 7632 12 of 18
The point (x, y, z) is the position of the geometric center of the protein in the 3D coordinate system,
placed in its origin, at (0,0,0). The protein should be oriented, making the line linking the longest
distance between two effective atoms in the molecule coaxial with the X-axis. It is then rotated around
the X-axis to make the line linking the two most distant positions of the projections of effective atoms on
the YZ plane coaxial with the Y-axis. The three parameters σx , σy , σz represent standard deviations of
the size of the protein, equal to 1/3 of the highest absolute values of the x-coordinate, y-coordinate and
z-coordinate, respectively (according to the 3-sigma rule). The normalizing coefficient Hsum T represents
T T
the sum of all Hi values of amino acids of the protein, making the Hi value unit-less. The only
input information for the theoretical distribution is a geometrical term concerning the full protein
(i.e., the size of the ellipsoid “drop” containing the protein, characterized by σx , σy , σz ). Traditionally,
the value of the Gauss function is interpreted as a theoretical idealized hydrophobicity density at any
given point.
However, the status of a given amino acid may not be as expected. The actual status is the effect
of the magnitude of the interactions of a given residue with neighboring residues. Thus, it depends on
the distance between the interacting residues and on their own hydrophobicity. The observed level of
hydrophobicity, called O, characterizes the status of a given residue in a given protein.
The equation proposed in [63] was applied to calculate the observed hydrophobicity:
2 rij 4 rij 6 rij 8
rij
1 X Hir + Hrj 1 − 12 7 c − 9 c + 5 c − c , f or rij ≤ c,
Hi0 =
0
(2)
Hsum 0, f orrij > c
j
where HiO denotes the experimentally observed hydrophobic density at a particular point which
collects the hydrophobic interaction in distance-dependent form, as given in the formula with the
cutoff distance (c) assumed according to original work 9Å. The denominator HsumO (sum of all HiO )
r r
makes the value in normalized form. Hi and H j express the intrinsic hydrophobicity of i-th and j-th
residues, which can be taken according to the arbitrarily selected scale.
After normalizing distributions T and O, it becomes possible to compare them quantitatively
using divergence entropy DKL introduced by Kullback-Leibler [64].
X P(i)
DKL (P||Q) = P(i) log2 , (3)
i Q(i)
where P(i) denotes the observed probability (hydrophobicity density) localized on the i-th residue,
which in this paper is called Oi and Q(i) denotes the expected (target distribution) hydrophobicity
localized on the same residue, which in this paper is called Ti (theoretical one) corresponds to the
distance between O and T, the latter of which is regarded as the reference.
Equation (3) takes the following form in our paper:
XN
DKL (O|T ) = Oi log2 (Oi /Ti ), (4)
i=1
with Ti treated as reference distribution.
DKL expresses the formal distance between both distributions (T and O). However, since it
constitutes a measure of entropy, it cannot be interpreted on its own and a second reference model must
be provided. Since T simulates a “perfect” hydrophobic core, we may add a reference distribution
which lacks any concentration of hydrophobicity at any point in the protein body. This type of
distribution—called the unified distribution (R)—assigns hydrophobicity of 1/N to each residue
(N being the number of residues in the chain). It represents the status deprived of any form of
hydrophobicity differentiation in the protein body.
XN
DKL (O|R) = Oi log2 (Oi /Ri ), (5)
i=1Int. J. Mol. Sci. 2020, 21, 7632 13 of 18
with Ri as the reference distribution.
When considering O and R, the value of DKL tells us to what degree the observed distribution
approximates the unified distribution. Comparing both values (for O/T and O/R) provides a description
of the protein’s status. When O/T < O/R, the observed distribution is aligned with the theoretical
distribution, and therefore the protein may be assumed to contain a hydrophobic core. In the opposite
case (O/T > O/R) the protein lacks a prominent core.
By applying the 3D Gaussian model and calculating divergence entropy, we obtain a fine-grained
description of the protein’s status, a procedure which would not be possible under the original oil
drop model. In order to avoid having to deal with two distinct values of DKL , we compute another
parameter referred to as relative distance (RD):
DKL (O T )
RD = . (6)
DKL (O T )+DKL (O R)
The parameter RD is used to determine the status of a given molecule or domain. When assuming
values less than 0.5, this indicates an arrangement consistent with the idealized system. Otherwise,
the situation differs from the centric system of the hydrophobic core. The status determined may refer
to the whole protein or to a domain and an appropriate 3D Gaussian function is generated for such a
defined structural unit. It is also possible to determine the status of a selected chain fragment within a
given unit (protein, domain), or to identify those residues which together represent a status deviating
from the centric arrangement. Such a calculation is used, for example, to determine the status of
the segment forming a disulfide bond, the surroundings of the catalytic residue, or the status of the
residues involved in ligand binding. This procedure has been used in the analysis discussed here.
The RD parameter can be calculated for any structural unit under consideration. The status of the
selected chain fragment can also be estimated. The status of the chain fragment can be treated only
as part of a formerly defined structural unit. The status of a chain fragment requires normalization
(sum of Ti and Oi belonging to selected chain fragments shall be equal to 1.0). Then the RD can be
calculated after defining the structural unit it has been selected from. It may happen that the status of
selected a chain fragment can be expressed by RD > 0.5 in respect to the chain or the domain of the
status expressed by RD < 0.5.
4.3. Early-Stage Intermediate Model—Partially Unfolded Protein
When looking for sources of generating clusters of hydrophobic residues in the center of the
molecule, an early-stage intermediate model was used for the analyzed proteins. It should be noted
that it was constructed based solely on the preferences of the backbone itself. The system of peptide
bonds—including the system of peptide bond planes in particular—showed that the relaxed forms
of these planes determine the relationship of Phi and Psi rotation values and the radius of curvature
for the pentapeptide is treated as a unit. The value of the angle between the planes of peptide bonds
(with the virtual Cα-Cα bond as the axis of rotation) determines the value of the radius of curvature.
Following angle changes from 0◦ to 180◦ , the radius of curvature changes from the smallest present in
the helix to the largest present in the extender or beta form. These changes, determined with the use of
the approximation function, indicate on the Ramachandran map an elliptical path connecting all areas
with a specific secondary structure. It is assumed that as long as the backbone alone determines the
structural form, we are dealing with an early state of the folding process. Replacing the Phi and Psi
angles with the corresponding Phie and Psie angles (angles belonging to the elliptical path determined
by the shortest distance between Phi and Psi and the ellipse) generates the form of an early intermediate
when inter amino acid interactions do not take place yet.
Early intermediate structures are obtained using the Phie and Psie values. Such an analysis leads
to the recognition of the 3D structure, in which—if the non-binding interactions present in proteins are
included in the calculations—the final form is obtained.Int. J. Mol. Sci. 2020, 21, 7632 14 of 18
The simulation of the folding process, where the starting structure is determined precisely on the
basis of the described model and the folding process relies on minimizing non-binding interactions
and taking into account the active participation of the water environment by introducing an external
force field in the form of a 3D Gaussian function, has been presented [65].
Here, the early intermediate structures determined for the proteins in question will be analyzed
comparatively in order to identify a common factor leading to downhill or fast-folding structures
characterized by a high degree of agreement between the T and O distribution. This observation
is interpreted as an example of the folding process dominated by a tendency to the generation of a
hydrophobic core. The unequivocal orientation of the folding process as dominated by the environment
explains the speed of the folding process and its reversibility. The distribution of the Phie and Psie
angles obtained for the non-redundant protein database shows the presence of seven local maxima
who have been assigned codes A through G. The C code represents the helical form, the G code is the
left-handed helix, the E code is the beta structure, and the F code represents the structure of the end of
beta structure segment. The interesting state is represented by the D code that connects the helical
region to the beta structure region.
The early intermediate structures of the proteins in question will be expressed in the codes given
above. With the help of the determined Phie and Psie values, it is possible to construct a partially
unfolded structure determined due to the optimal arrangement of the planes of peptide bonds.
4.4. Tools and Software
3D images of the protein structures were rendered with PyMOL [66] while data charts were
plotted using Matplotlib library [67]. Online calculations of fuzzy oil drop hydrophobicity profiles and
structural codes are available at http://fod.cm-uj.krakow.pl web server.
5. Conclusions
In the present study, significant participation of the arrangement of hydrophobicity distribution
compatible with that present in the spherical micelle and expressed by means of 3D Gauss function in
fast and ultrafast folding as well as downhill proteins were demonstrated [68]. The reversibility of
this process results from the presence of the seed of the hydrophobic core in the early intermediate
structure, which is the partially folded structure. In the present work, the participation of hydrophobic
interactions in the process of shaping the structure of proteins has been expressed by means of
a mathematical model [42,69]. The fuzzy oil drop model is nothing more than the mathematical
expression of the commonly observed hydrophobic core generation. The model allows quantitative
description and comparison of the status of different protein molecules.
The practical use of the fuzzy oil drop model allows for the quantitative assessment of the status
of a given protein, enabling comparative analysis. The higher the RD value, the lower the stability
guaranteed by the presence of the hydrophobic core. For proteins with low RD values, a one-step
unfolding process is predicted. The low value of RD observed for most domains treated as individual
structural units (3D Gaussian function determined for the domain) suggests their spontaneous folding
as an expression of the influence of the external field, which is the water environment, directing this
process towards the generation of a hydrophobic core.
Supplementary Materials: Supplementary materials can be found at http://www.mdpi.com/1422-0067/21/20/
7632/s1. Figure S1. Hydrophobicity density distributions and 3D presentation of native (a,c,e) and early stage
(b,d,f) forms of de novo designed triple helix bundle protein (PDB ID: 2A3D); Figure S2. Hydrophobicity density
distributions and 3D presentation of native (a,c,e) and early stage (b,d,f) forms of engrailed homeodomain (PDB ID:
2P6J).
Author Contributions: Conceptualization, I.R. and L.K.; methodology, M.B.; software, M.B. and P.F.; validation,
M.B., K.S. and I.R.; formal analysis, I.R.; investigation, M.B.; resources, M.B.; data curation, P.F.; writing—original
draft preparation, K.S.; writing—review and editing, I.R., K.S. and M.B.; visualization, M.B. and K.S.; supervision,
I.R.; project administration, I.R.; funding acquisition, M.B. and I.R. All authors have read and agreed to the
published version of the manuscript.Int. J. Mol. Sci. 2020, 21, 7632 15 of 18
Funding: This research was funded by Jagiellonian University—Medical College, grant numbers N41/DBS/000211,
N41/DBS/000208.
Acknowledgments: Many thanks to Anna Żaremba-Śmietańska for technical support.
Conflicts of Interest: The authors declare no conflict of interest.
Abbreviations
FOD Fuzzy oil drop
PDB Protein data bank
RD Relative distance
References
1. Dill, K.A.; Maccallum, J.L. The Protein-Folding Problem, 50 Years On. Science 2012, 338, 1042–1046. [CrossRef]
[PubMed]
2. Muñoz, V. Conformational Dynamics and Ensembles in Protein Folding. Annu. Rev. Biophys. Biomol. Struct.
2007, 36, 395–412. [CrossRef]
3. Schmeing, T.M.; Ramakrishnan, V. What recent ribosome structures have revealed about the mechanism of
translation. Nat. Cell Biol. 2009, 461, 1234–1242. [CrossRef]
4. Ellis, R.J.; Van Der Vies, S.M. Molecular Chaperones. Annu. Rev. Biochem. 1991, 60, 321–347. [CrossRef]
[PubMed]
5. Ellis, J. Proteins as molecular chaperones. Nat. Cell Biol. 1987, 328, 378–379. [CrossRef] [PubMed]
6. Fernández-Fernández, M.R.; Valpuesta, J.M. Hsp70 chaperone: A master player in protein homeostasis.
F1000Research 2018, 7, 1497. [CrossRef] [PubMed]
7. Mayer, M.P.; Bukau, B. Hsp70 chaperones: Cellular functions and molecular mechanism. Cell. Mol. Life Sci.
2005, 62, 670–684. [CrossRef]
8. Gruber, R.; Horovitz, A. Allosteric Mechanisms in Chaperonin Machines. Chem. Rev. 2016, 116, 6588–6606.
[CrossRef] [PubMed]
9. Oldfield, C.J.; Dunker, A.K. Intrinsically Disordered Proteins and Intrinsically Disordered Protein Regions.
Annu. Rev. Biochem. 2014, 83, 553–584. [CrossRef]
10. Zwanzig, R.; Szabó, A.; Bagchi, B. Levinthal’s paradox. Proc. Natl. Acad. Sci. USA 1992, 89, 20–22. [CrossRef]
11. Cavalli, A.; Haberthür, U.; Paci, E.; Caflisch, A. Fast protein folding on downhill energy landscape. Protein Sci.
2003, 12, 1801–1803. [CrossRef] [PubMed]
12. Creighton, T.E.; Darby, N.J.; Kemmink, J. The roles of partly folded intermediates in protein folding. FASEB J.
1996, 10, 110–118. [CrossRef]
13. Gelman, H.; Gruebele, M. Fast protein folding kinetics. Q. Rev. Biophys. 2014, 47, 95–142. [CrossRef]
[PubMed]
14. Eaton, W.A.; Muñoz, V.; Hagen, S.J.; Jas, G.S.; Lapidus, L.J.; Henry, E.R.; Hofrichter, J. Fast Kinetics and
Mechanisms in Protein Folding. Annu. Rev. Biophys. Biomol. Struct. 2000, 29, 327–359. [CrossRef] [PubMed]
15. Baldwin, R.L. The Search for Folding Intermediates and the Mechanism of Protein Folding.
Annu. Rev. Biophys. 2008, 37, 1–21. [CrossRef] [PubMed]
16. Creighton, T.E. How important is the molten globule for correct protein folding? Trends Biochem. Sci. 1997,
22, 6–10. [CrossRef]
17. Kuwajima, K. The Molten Globule, and Two-State vs. Non-Two-State Folding of Globular Proteins.
Biomolecules 2020, 10, 407. [CrossRef]
18. Sanchez-Medina, C.; Sekhar, A.; Vallurupalli, P.; Cerminara, M.; Muñoz, V.; Kay, L.E. Probing the Free Energy
Landscape of the Fast-Folding gpW Protein by Relaxation Dispersion NMR. J. Am. Chem. Soc. 2014, 136,
7444–7451. [CrossRef]
19. Campos, L.A.; Liu, J.; Wang, X.; Ramanathan, R.; English, D.S.; Muñoz, V. A photoprotection strategy for
microsecond-resolution single-molecule fluorescence spectroscopy. Nat. Methods 2011, 8, 143–146. [CrossRef]
20. Ramanathan, R.; Muñoz, V. A Method for Extracting the Free Energy Surface and Conformational Dynamics
of Fast-Folding Proteins from Single Molecule Photon Trajectories. J. Phys. Chem. B 2015, 119, 7944–7956.
[CrossRef]You can also read