Overberg - Overberg District Municipality
←
→
Page content transcription
If your browser does not render page correctly, please read the page content below

Overberg

                       District Municipality
                       Distriksmunisipaliteit
                        Umasipala Wesithili

                                               Draft 2018/2019
                   Integrated Development Plan (IDP)
                                                                     Review
                                                 [First Review of 2017/2021]
                                  As prescribed by Section 34 of the Local Government:
                         OVERBERG        Municipal Systems Act, 2000 (Act 32 of 2000)
1|ODM DRAFT 2018/2019 ID P REVIEW
                       District Municipality               Draft tabled 26 March 2018
                       Distriksmunisipaliteit
                        Umasipala Wesithili
REVIEW TABLE OF CONTENTS
                                                   5-Year        Review
                                                    IDP   1st   2nd 3rd   4th
COUNCIL APPROVAL: DRAFT 2018/2019 IDP REVIEW         11    6

FOREWORD BY EXECUTIVE MAYOR                          13    7

FOREWORD BY MUNICIPAL MANAGER                        15    8

STRATEGIC DIRECTION 2018/2019                        16    9

CHAPTER 1: EXECUTIVE SUMMARY
  1.1       Introduction                             18   10

  1.1.2.1   Political Leadership of ODM              20   11

  1.1.2.2   Administrative Leadership of ODM         24   13

  1.1.2.3   The Overberg Region                      25   14

  1.2.2     The IDP Planning Process                 34   20

  1.2.3     Key Stages and Consultations             36   20

  1.2.5     Time Schedules/Process Plans             37   20

CHAPTER 2: PUBLIC PARTICIPATION AND IGR
  2.1.      Public Participation                     44   22

  2.2.1     Response to IDP Assessment July 2017     57   22

  2.2.2     Integrated Strategic Engagements         55   23

CHAPTER 3: STATE OF THE DISTRICT
  3.2.1     Clean Audit                              62   24

  3.2.3     Budget-related Policies in IDP           63   24

  3.2.4     National Government Allocations          64   25

  3.2.5     Budget Schedules                         65   25

  3.3       Environmental Analysis                   71   31

  3.3.1     Climate Change                           71   31

  3.3.6     Drought and Dam Levels                   73   32

  3.3.7     Solid Waste Management                  172   34

  3.4       Economic Analysis                        75   34

  3.4.4.3   Value Chains                             83   34

 2|ODM DRAFT 2018/2019 IDP REVIEW
3.4.4.4    Agriculture Infrastructure                            82    36

  3.4.6      Unemployment                                                36

  3.5        Socio-Economic Analysis                               91    37

  3.5.4      Access to Basic Services                              94    37

  3.5.5      Education                                             99    38

  3.5.6      Health                                                100   38

  3.5.7      Safety and Security                                   103   39

  3.5.8      Social Development                                    104   39

  3.5.10.2   Sports Tourism                                        107   39

CHAPTER 4: DEVELOPMENT PRIORITIES : REVISED KPIS
  4.1.1      Internal Audit                                        109   40

  4.1.2      IDP & Communication                                   113   40

  4.1.3      Performance & Risk Management                         119   41

  4.1.4      Risk Management (Shared Services Model)               126   41

  4.2.1      Human Resources                                       132   42
             Committee Services, Records Management &
  4.2.2                                                            139   42
             Councillor Support; Support Services
  4.3.1      Financial Services                                    144   43

  4.3.3      Supply Chain Management                               151   43

  4.4.1      Municipal Health Services                             156   44

  4.4.2      Environmental Management                              168   44

  4.4.3      Emergency Services                                    185   45

  4.4.4      Roads Services                                        194   45

  4.4.5      RED, Tourism, Resorts & EPWP                          199   46

  4.4.6      Social Development                                          46

  4.5        Summation of Development Priorities                   213   47

CHAPTER 5: GOVERNMENT POLICIES AND IMPERATIVES
  5.5        Alignment of Government Strategic Directives          219   48

CHAPTER 6: SECTOR ALIGNMENT
  6.1        Overberg Sector Plans                                 225   53
             Sustainable Local Government: Integration of Sector
  6.2                                                              228   57
             Plans: Regional Impact

 3|ODM DRAFT 2018/2019 IDP REVIEW
6.4           Western Cape Government Footprint in Overberg        230   58

 6.5           Joint Planning Initiatives (JPIs)                    240   65

 6.6           Expanded Public Works Programme (EPWP)               241   65

CHAPTER 7: REGIONAL ECONOMIC DEVELOPMENT (RED) & TOURISM
 7.3           District RED/Tourism Strategy                        246   66

 7.4           Agri-Parks                                           247   66

 7.5           RED Initiatives in Overberg Region                         67

CHAPTER 8: SPATIAL DEVELOPMENT FRAMEWORK (SDF)
 8.4           Overview of SDFs across the Region                   255   68

CHAPTER 9: DISASTER MANAGEMENT
 9.1           District Disaster Risk Management                    257   69

 9.2           Disaster Risk Register 2018/2019                     260   71

CHAPTER 10: FINANCIAL PLANNING
 10.2          Consolidated Budgeted Financial Performance          265   73

 10.3          Capital Budget                                       266   74

CHAPTER 11: PERFORMANCE MANAGEMENT
               TL Service Delivery & Budget Implementation Plan
 11.2                                                               269   75
               (SDBIP)

CHAPTER 12: PROJECTS
 12.1          District Roads Projects                              271   76

 12.2          Proposed Provincial Roads Projects                   272   77

 12.3          Environmental Sector Projects List                   273   78

CHAPTER 13: STRATEGIC RISKS : OVERBERG REGION
               Regional Strategic Risks Register 2018/2019                89

REFERENCED DOCUMENTS
  Spatial Development Framework (SDF)

  Top Layer Service Delivery & Budget Implementation Plan (SDBIP)

  Regional Strategic Risks Register 2018/2019

 4|ODM DRAFT 2018/2019 IDP REVIEW
ACRONYMS
CCRF     Climate Change Response Framework
CMP      Coastal Management Programme
DICT     Dyer Island Conservation Trust
DoRA     Division of Revenue Act
EPWP     Expanded Public Works Programme
FPSU     Farmer Production Support Unit
FTE      Full-Time Equivalent
IDP      Integrated Development Plan
IGR      Intergovernmental Relations
IWP      Integrated Work Plan
IWMP     Integrated Waste Management Plan
ITP      Integrated Transport Plan
KPI      Key Performance Indicator
LBRCT    Lower Breede River Conservancy Trust
LED      Local Economic Development
LGMTEC   Local Government Medium-Term Expenditure Committee
LTO      Local Tourism Office
MGRO     Municipal Governance Review and Outlook
MoU      Memorandum of Understanding
PPComm   Public Participation and Communication
RED      Regional Economic Development
RTLC     Regional Tourism Liaison Committee
RTO      Regional Tourism Organisation
SANS     South African National Standards
SDBIP    Service Delivery and Budget Implementation Plan
SDF      Spatial Development Framework
SEP      Socio-Economic Profile
SG       Strategic Goal
SIME     Strategic Integrated Municipal Engagement
SLA      Service Level Agreement
WO       Work Opportunity

 5|ODM DRAFT 2018/2019 IDP REVIEW

COUNCIL APPROVAL: DRAFT 2018/2019 IDP REVIEW

EXTRACT FROM THE COUNCIL MINUTES OF MEETING HELD 26 MARCH 2018
COUNCIL RESOLUTION No.: A216. 26.03.2018

DRAFT 2018/2019 INTEGRATED DEVELOPMENT PLAN (IDP) REVIEW
______________________________________________________________________________________________________________________________________
V Zeeman: Head: IDP and Communication                                                                                  (Ref.: 16/7)

PURPOSE OF REPORT

To present to Council for approval the Draft 2018/2019 Integrated Development Plan (IDP) Review which includes
the approved District Spatial Development Framework (SDF) as a core component of the IDP.

BACKGROUND

In prescribing to relevant legislation, Council adopted the 4th Generation IDP for period 2017/18 to 2021/22 on
15 May 2017. The 5-year Plan contains key municipal plans and priorities for the current political term of office. It is
confirmed that the existing SDF was approved by Council on 30 June 2017.

The Local Government: Municipal Systems Act, 2000 (Act 32 of 2000) states:

    Section 34: “A municipal council must review its integrated development plan annually in accordance with an
    assessment of its performance measurements and to the extent that changing circumstance so demand...”

    Section 26(e): “An integrated development plan must reflect a spatial development framework which must include
    the provision of basic guidelines for a land use management system for the municipality.”

PROGRESS

The First Review of the 2017/21 IDP will contribute to the adjustment of the Municipality’s 5-year Plan, as well as
inform the Service Delivery and Budget Implementation Plan (SDBIP), the Budget and Risk Register for 2018/19.

It is noted that the approved SDF will be revised in 2021/2022 in order to ensure alignment with the next 5-year IDP
development cycle.

It is therefore imperative that the Draft 2018/2019 IDP Review be read in conjunction with the 5-year Plan
adopted on 15 May 2017, as the Review does not constitute a new IDP.

The approved Draft 2018/2019 IDP Review will be advertised for public comment/input until 30 April 2018,
following which the Final 2018/2019 IDP Review will be tabled to Council for adoption on 28 May 2018.

LEGISLATIVE FRAMEWORK

    Sections 26 & 34: Local Government: Municipal Systems Act, 2000 (Act 32 of 2000)

FINANCIAL IMPLICATIONS

None (developed in-house)

RECOMMENDATIONS

1) That Council adopt the Draft 2018/2019 Integrated Development Plan (IDP) Review.

2) That the Draft 2018/2019 IDP Review be published for comment/input until 30 April 2018.

3) That Council note the existing District Spatial Development Framework (SDF), approved by Council on
   30 June 2017, will be revised in 2021/2022 in order to ensure alignment with the next
   5-year IDP development cycle.

6|ODM DRAFT 2018/2019 IDP REVIEW
FOREWORD BY EXECUTIVE MAYOR

To be included in Final 2018/2019 IDP Review.

7|ODM DRAFT 2018/2019 IDP REVIEW
FOREWORD BY MUNICIPAL MANAGER

To be included in Final 2018/2019 IDP Review.

8|ODM DRAFT 2018/2019 IDP REVIEW
STRATEGIC DIRECTION 2018/2019
Following a Strategic Session on 25 January 2018, Council resolved that the strategic direction set
by Council in 2016 and captured in the 5-Year IDP, would remain as is.

                                                 VISION
                Overberg – the opportunity gateway to Africa through sustainable services.

                                                MISSION
                 To render sustainable, customer-directed services and to be the preferred
                            Provider of Shared Services within the Overberg.

                                            CORE VALUES
   Caring:               A total belief in collective caring principles – “Ubuntu”.
   Integrity:            Higher levels of courtesy and professionalism in the workplace; behaving in
                         a manner that reflects ODMs commitment to honesty, trust, transparency and
                         ethical business operations.
   Commitment:           To the development of people; regular consultation with customers on the
                         level and quality of services.
   Transformation: Transformational leadership - corporate transformation begins with a shift in
                   the values and behaviours of leadership; corporations do not transform, people
                   do.
   Transparency:         In accounting for our actions; responsible spending and utilisation of
                         municipal assets.
   Excellence:           Setting quality standards for service delivery, measurement thereof to
                         improve productivity and the discipline to take action to address the situation.
   Honesty:              Contributes to a positive mind-set and facilitates morally acceptable
                         behaviour.
   Respect:              For our natural resources and celebrating diversity.

                                         STRATEGIC GOALS
   ODM SG1:
   To ensure the health and safety of all in the Overberg through the provision of efficient basic
   services and infrastructure.

   ODM SG2:
   To promote regional economic development by supporting initiatives in the District for the
   development of a sustainable district economy.

   ODM SG3:
   To ensure municipal transformation and institutional development by creating a staff structure
   that would adhere to the principles of employment equity and promote skills development.

   ODM SG4:
   To attain and maintain financial viability and sustainability by executing accounting services in
   accordance with National policy and guidelines.

   ODM SG5:
   To ensure good governance practices by providing a democratic and pro-active accountable
   government and ensuring community participation through IGR structures.
9|ODM DRAFT 2018/2019 IDP REVIEW
1.1 INTRODUCTION
                                                                                                     C
                                                                                           st
Since the adoption of the Municipal Systems Act (MSA) in 2000, this represents the 1 Draft
Review of the 4th Generation Integrated Development Plan (IDP) adopted by Council on                 H
15 May 2017. As per section 34 of the Municipal Systems Act, 2000 (Act 32 of 2000):
                                                                                                     A
   “A municipal council must review its integrated development plan annually in accordance
   with an assessment of its performance measurements and to the extent that changing
   circumstances so demand…”
                                                                                                     P
The Draft 2018/19 IDP Review will contribute to the adjustment of the Municipality’s 5-Year
                                                                                                     T
Plan as well as inform the Budget, Service Delivery and Budget Implementation Plan (SDBIP)
and Risk Register for 2018/19. It is therefore imperative for this Review to be read in              E
conjunction with the Plan adopted on 15 May 2017, as the Review does not constitute a new
IDP.                                                                                                 R
The Draft 2018/19 IDP Review is structured as follows:

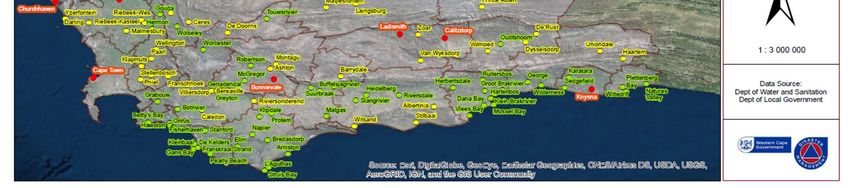
Chapter 1:    States the Political Leadership across the Overberg and reaffirms the Overberg
              District Municipality’s governance structures and strategic direction for 2018/2019.
                                                                                                     1
Chapter 2:    Update on Ward Committees in Overberg Region, Intergovernmental Engagements
              and the Overberg District Municipality response to the Final IDP Assessment.

Chapter 3:    Provides updated information on the strategic analysis of the state of the District.

Chapter 4:    Performance progress of 2017/18 per functional area, and update of KPIs for outer

                                                                                                     EXECUTIVE SUMMARY
              years.

Chapter 5:    Reaffirms the District’s alignment of Strategic Goals with key policy directives of
              National and Provincial Government.

Chapter 6:    Provides an update of Sectoral Plans across the Region and Government’s footprint
              in the Region.

Chapter 7:    Regional economic development and tourism initiatives across the Overberg,
              including the Agri-Parks initiative.

Chapter 8:    Depicts the status of Spatial Development Frameworks (SDFs) across the Region.

Chapter 9:    This Chapter provides an updated Disaster Risk Register.

Chapter 10: Provides the latest financial planning initiatives of the Overberg District
            Municipality, as well as multi-year budgeting.

Chapter 11: Revised targets for 2018/19 Top Layer SDBIP and outer years, in order to ensure
            Council remain committed in achieving its Strategic Goals.

Chapter 12: Provides a summary of projects planned across the Overberg.

Chapter 13: Summarises the top 10 strategic risks across the Overberg Region.

1.1.2.1 Political Leadership of Overberg District Municipality

10 | O D M D R A F T 2 0 1 8 / 2 0 1 9 I D P R E V I E W
Cllr A Klaas (Deputy Executive Mayor); Ald A Franken (Executive Mayor) and Ald L de Bruyn (Speaker)
Full Overberg District Municipality Council:
Name Political Party Portfolio
Ald Botha-Guthrie,
Democratic Alliance (DA) Resigned 9 March 2018
Nicolette
Cllr Brinkhuys, Ronald Democratic Alliance (DA) Member: Community Services
Cllr Coetzee, Helena Democratic Alliance (DA) Portfolio Chair: Strategic Services
Ald de Bruyn, Lincoln Democratic Alliance (DA) Speaker
Cllr Fourie, Steven Democratic Alliance (DA) Member: Community Services Portfolio
Ald Franken, Andries Democratic Alliance (DA) Executive Mayor
Ald Gelderblom, Jan African National Congress (ANC) Member: Community Services
Cllr Klaas, Archibald Democratic Alliance (DA) Deputy Executive Mayor & Member: Strategic Services
Ald Koch, Matthys Democratic Alliance (DA) Portfolio Chair: Community Services
Cllr Lamprecht, Cornelius Democratic Alliance (DA) Portfolio Chair: Finance
Ald Marthinus, Eve African National Congress (ANC) Member: Finance Portfolio
Member: Strategic Services Portfolio & Community
Ald Mentile, Vuyiswa African National Congress (ANC)
Serv
Cllr Ntsabo, Lindile Democratic Alliance (DA) Member: Finance Portfolio
Cllr Opperman, Moira Democratic Alliance (DA) Portfolio Chair: Corporate & IGR
Ald Sapepa, Ntombizine African National Congress (ANC) Member: Corporate & IGR
Cllr Sauls, Evelyn Democratic Alliance (DA) Member: Strategic Services Portfolio
Cllr Sileku, Isaac Democratic Alliance (DA) Member: Corporate & IGR
Ald Sipunzi, Unathi African National Congress (ANC) Member: Corporte & IGR
Cllr Tiemie, Kiro Democratic Alliance (DA) Member: Finance Portfolio
Cllr Witbooi, Mario African National Congress (ANC) Member: Strategic Services Portfolio
Cllr Wood, Caroline African National Congress (ANC) Member: Finance Portfolio
11 | O D M D R A F T 2 0 1 8 / 2 0 1 9 I D P R E V I E WAld L de Bruyn Ald A Franken Cllr A Klaas
Speaker Executive Mayor Deputy Mayor
DA DA DA
Ald M Koch Cllr H Coetzee Cllr C Lamprecht Cllr M Opperman
Portfolio Chair: Portfolio Chair: Portfolio Chair: Portfolio Chair:
Community Serv Strategic Services Finance Corporate & IGR
DA DA DA DA
Resigned
9 March 2018
Cllr L Ntsabo Cllr R Brinkhuys Cllr S Fourie Ald N Botha-Guthrie Cllr E Sauls
DA DA DA DA DA
Cllr I Sileku Cllr K Tiemie Ald V Mentile Ald J Gelderblom Ald E Marthinus
DA DA ANC Whip ANC ANC
Ald N Sapepa Ald U Sipunzi Cllr M Witbooi Cllr C Wood
ANC ANC ANC ANCCOUNCIL
OFFICE OF THE MAYOR MUNICIPAL MANAGER OFFICE OF THE SPEAKER
• IDP and Communication
• Performance and Risk Management
• Internal Audit
Mr D Beretti • Shared Services
Directorate Finance Directorate Corporate Services Directorate Community Services
• Financial Services • Legal Services • Municipal Health Services
• Revenue Management • Human Resources • Environmental Management
• Expenditure Management • Information Services • Social Development
• Supply Chain Management • Committee Services, Records • Emergency Services
Management and Councillor • Roads Services
Support • LED, Tourism, Resorts and EPWP
Chief Financial officer Director: Director:
Dr J Tesselaar Corporate Services Community Services
(vacant) (vacant)
The Municipality’s affordable structure makes provision for 445 posts. The current employee
component comprises 297 permanent employees, with 148 vacancies.
Interviews for the Director: Community Services were conducted on 5 March 2018. The
Municipal Manager is currently finalising the selection process for tabling to Council on
26 March 2018. Further confirmation in this regard will be captured in the Final IDP Review,
to be tabled to Council for adoption on 28 May 2018.
1.1.2.3 The Overberg Region
13 | O D M D R A F T 2 0 1 8 / 2 0 1 9 I D P R E V I E WOverberg District Municipality
Executive Mayor: Ald Andries Franken
Speaker: Ald Lincoln de Bruyn
Municipal Manager: Mr David Beretti
Area size: 12,241km2
Population: 258,176 (StatsSA Census 2011)
286,786 (Community Survey 2016)
291,605 (MERO 2017)
Cape Agulhas Municipality
Executive Mayor: Cllr Paul Swart
Speaker: Ald Johan Nieuwoudt
Municipal Manager: Mr Dean O’Neill
Area size: 2,411km2
Population: 33,038 (StatsSA Census 2011)
36,000 (Community Survey 2016)
Overstrand Municipality
Executive Mayor: Ald Dudley Coetzee
Speaker: Ald Anton Coetsee
Municipal Manager: Mr Coenie Groenewald
Area size: 1,708km2
Population: 80,432 (StatsSA Census 2011)
93,466 (Community Survey 2016)
Theewaterskloof Municipality
Executive Mayor: Cllr Christelle Vosloo
Speaker: Ald Daniel du Toit
Municipal Manager: Mr Gerhard Matthysen
Area size: 3,232km2
Population: 108,790 (StatsSA Census 2011)
117,109 (Community Survey 2016)
Swellendam Municipality
Executive Mayor: Cllr Nicholas Myburgh
Speaker: Cllr Bongani Sonqwenqwe
Municipal Manager: Mr Anton Groenewald
Area size: 3,835km2
Population: 35,916 (StatsSA Census 2011)
40,211 (Community Survey 2016)
14 | O D M D R A F T 2 0 1 8 / 2 0 1 9 I D P R E V I E W15 | O D M D R A F T 2 0 1 8 / 2 0 1 9 I D P R E V I E W
16 | O D M D R A F T 2 0 1 8 / 2 0 1 9 I D P R E V I E W
17 | O D M D R A F T 2 0 1 8 / 2 0 1 9 I D P R E V I E W
18 | O D M D R A F T 2 0 1 8 / 2 0 1 9 I D P R E V I E W
19 | O D M D R A F T 2 0 1 8 / 2 0 1 9 I D P R E V I E W
20 | O D M D R A F T 2 0 1 8 / 2 0 1 9 I D P R E V I E W
1.2 DEVELOPMENT OF THE INTEGRATED DEVELOPMENT PLAN (IDP)

1.2.2   THE IDP PLANNING PROCESS
                                              5-Year IDP Development Process
                                                (period of Municipal Council)
               ------------------------------ 5 Year IDP (2017/18 – 2021/22) ----------------------------
  5 Year IDP
  Adoption                  Implementation
                            1st Review                  Implementation
  2017-2021                                             2nd Review
                            2018/19                                            Implementation
                            - Annual Perf.              2019/20                3rd Review             Implementation
     Adopted                                            - Annual Perf.
                              Review                                           2020/21                Final Review
   15 May 2017              - Annual Budget               Review               - Annual Perf.         2021/22
                                                        - Annual Budget          Review               - Annual Perf.
                             Draft Tabled                                      - Annual Budget          Review
                            26 March 2018                                                             - Annual Budget

                             Final Adopted
                             28 May 2018

1.2.3   KEY STAGES AND CONSULTATIONS DURING IDP REVIEW PROCESS
 27 July 2017                  Western Cape Districts Integrated Forum
 8 August 2017                 District IDP Managers Forum
 18 August 2017                Swellendam/ODM IDP – planning per strategic objective
 5 October 2017                Swellendam/ODM IDP alignment - follow-up

                                                                                                                   CONTINUOUS HOD CONSULTATIONS 2017/2018
 12 & 13 October 2017          Provincial Communication Technical Forum
 17 October 2017               Theewaterskloof/ODM IDP alignment matters
 24 October 2017               Swellendam Municipal Advisory Forum
 27 October 2017               Western Cape Districts Integrated Forum
 30 October 2017               Integrated Transport Plan Workshop
 7 November 2017               Overberg District Strategic Integrated Municipal Engagement
 8 November 2017               StatsSA/Overberg District Engagement
 17 November 2017              Provincial Public Participation & Communication Forum
 30 November 2017              District IDP Managers Forum
 30 November 2017              District IDP Rep/PPComm Forum
 7 & 8 December 2017           Provincial IDP Managers Forum
 18 January 2018               StatsSA/Overberg District data tool training
 23 January 2018               Swellendam/ODM IDP alignment matters
 25 January 2018               Council/Management Strategic Session – IDP Steering Committee
 1 February 2018               SALGA PEC Engagement Overberg
 12 February 2018              Strategic Session Follow-up Meeting
 13 February 2018              Special District EPWP Meeting
 20 February 2018              Technical Integrated Municipal Engagement (TIME)
 27 February 2018              District IDP Managers Forum
 6 March 2018                  District EPWP Forum
 7 March 2018                  Western Cape Districts Integrated Forum
 8 & 9 March 2018              Provincial IDP Managers Forum
 26 March 2018                 Presentation and tabling of 2018/19 Draft IDP Review for adoption

1.2.5 TIME SCHEDULES/PROCESS PLANS
Adoption dates of respective plans across the region:
     Municipality                  Plan tabled to Council                     Approved           Council Resolution
 Overberg DM                IDP/Budget Time Schedule                           31.07.17           A132. 31.07.2017
 Cape Agulhas LM            IDP/Budget Time Schedule                           28.08.17               147/2017
 Overstrand LM              IDP/Budget Time Schedule                           30.08.17          5.2/30 August 2017
 Theewaterskloof LM         IDP/Budget Process Plan                            23.08.17              C173/2017
 Swellendam LM              IDP/Budget Process Plan/Time Schedule              31.08.17           A141/31/08/2017

21 | O D M D R A F T 2 0 1 8 / 2 0 1 9 I D P R E V I E W
2.1 PUBLIC PARTICIPATION
C
The Western Cape Department Local Government: Public Participation and Communication
Directorate continues to introduce training initiatives for all municipalities across the Western H
Cape. The last training programme, viz. the Integrated Community Development Programme
(ICDP), offered by the University of Stellenbosch, was coordinated by the Department and rolled A
out during the week of 26 February to 2 March 2018.
P
2.2 INTERGOVERNMENTAL RELATIONS (IGR)
T
2.2.1 RESPONSE TO IDP ASSESSMENT JULY 2017
E
a) In the absence of a copy of a Council Resolution indicating that the SDF was indeed adopted as
a core component of the 2017-2022 IDP, Overberg District Municipality is requested in terms
of section 32(2)(a) of the MSA to immediately make the necessary adjustment in order to adopt
R
the SDF as a core component of the IDP.
ODMs response: Refer Minister Bredell’s correspondence dated 31 August 2017:
“With the Council having resolved during the Council meeting of 30 June 2017 to re-adopt the 2013
SDF (which the Municipality approved in 2014) with the 2017-2022 IDP, there is no need for an
2
adjustment to be made to the IDP in terms of section 32(2)(a) of the Local Government: Municipal
Systems Act, 2000 (Act 32 of 2000) and the matter is considered resolved.”
b) The Municipality is non-compliant with regard to the mandate pertaining to the coordination
PUBLIC PARTICIPATION and IGR
and administration of incidents as defined in section 30(1) of the National Environmental
Management Act, 1998 (NEMA).
ODMs response: ODM developed a response protocol to formalise coordination between internal
departments and reporting to Provincial Government in terms of NEMA section 30 incidents. The
following departments will form part of the ODMs response:
Fire and Disaster Management – first response and containment of the situation (HAZMAT);
Municipal Health Services – monitoring the impact on communities and receiving environment
(air quality); and
Environmental Management Services – monitoring impacts on the environment and reporting to
the Provincial Authorities.
This response will be reviewed from time to time to ensure an effective and efficient response from
all participating departments.
c) The Overberg District Municipality needs to decide on the way forward with regards to the
financing of the next waste cell, to be constructed by 2019/2020, for the Karwyderskraal waste
disposal facility.
ODMs response: The Overberg District Municipality is currently in the process of reclaiming the
management of Karwyderskraal as a regional landfill facility. The new cell development will be
completed by January 2019. A loan was obtained to continue with the planning and development of
the next waste cell.
(Further reference is made in Chapter 3. Section 3.3.7, page 34)
22 | O D M D R A F T 2 0 1 8 / 2 0 1 9 I D P R E V I E W2.2.2 INTEGRATED STRATEGIC ENGAGEMENTS
Outcomes of the 2016 and 2017 Overberg Strategic and Technical engagements:
Mutual Interests Enablers Inhibitors Joint Action
Drought, water security Breede-Gouritz Catchment Management Agency Downward trend in the Province rain since 1993. Preparing for negative social consequences in town where job losses on
and climate change MOU with DEADP. Longer term climate outlook forecasts severe farms will be experienced.
NEMA Sec 30A allows for faster implementation weather, flooding and droughts. WC Water Supply System comprising Voelvlei, Wemmershoek, Berg Water
The District is affected by of drought-related measures. Impact of drought on agricultural production. project, TWK, Steenbras, Palmiet to be discussed.
the drought although it has Streamlined and synchronized process of water Huge potential job losses mainly in fruit industry. Joint communications campaign to all water users, e.g. 87litres per day,
sufficient water for licence applications Can increase from 35,600 to 50,000 people if even if drought is less sever in Overberg.
municipal supply and for Activation of PDMC. cash crops are included. Public awareness of Palmiet transfer system with Steenbras upper and
farmers. Fruit-Look project implemented to cover all Impact on towns as people migrate into towns lower dam system.
irrigation areas. causing greater demand for health, human Food prices, food security.
Climate Change Response Framework (Smart- settlements, municipal services, schools and The need to ensure river and beach management of Onrus River and
Agri) developed security. Estuary in Overstrand.
Focus on the conservation of agriculture exists.
Socio-economic Halaal Value Chain Study to reveal potential Increase in unemployment, poverty and Lessons learned from WCG Whole of Society Approach (Bette Spaces) pilot
development economic opportunities. inequality in many towns and communities project could be used to address declining socio-economic conditions.
Violence prevention through Urban Upgrading High dropout rates in schools A-P to be seen as a value-add and not only as part of a national program.
Factors influencing socio- projects in TWK on track Impact of drought will add pressure to existing Connections, links and logistics of value chains must be catalyst, rather than
economic development: Regional socio-economic programme to be rolled conditions. budgets for infrastructure, e.g. Halaal certification process starts on farms.
Growth in tertiary and out in CAM There are no outcomes experienced from Cooperation on agri-processing value chains such as barley, wheat, canola,
manufacturing sectors Agri-processing value-chains and partners National Govt Agri-Parks process stone fruits, wine, dairy, aquaculture, etc. must be explored.
Importance of agriculture identified Insufficient National budget for land for emerging Identification of new international markets and agricultural technologies.
and agri-processing value There is still sufficient water for agricultural farmers Joint strategy with DoA to be formulated around wheat location differential
chain production Partnerships with National Govt Depts (R500/ton) on JSE totalling R1billion p.a.
Possible negative impact problematic. Overberg influenced land reform discussion to be finalised.
of Avian flu Potential shortage of eggs and chicken. Linkages to be found with metropolitan regional economy.
Joint action on poaching and resource extraction from the sea to continue
as an item at DCF.
Waste management Joint approach between district and local Funding of Regional Landfill Site. Alternative technologies (waste to energy options, diversion from landfill),
municipalities. cost determinations and support for international funding to be explored.
Good working relationship with WCG. Improved planning for risk-based approach and possible synergies for heat,
Potential of a shared facility between power and fertiliser to be investigated.
Swellendam and Cape Agulhas. Knowledge exchange with Eden DM and then an engagement with Swedish
waste businesses to be conducted.
Infrastructure for Inter-municipal approach to resort strategy is Non-adherence to project deliverables by DTPW Response required for the Cape Agulhas link road.
improved economic available. Roads. Management and rezoning of resorts for economic development to be
development WCG Coastal Access Statement available. Economic viability is a key challenge rather than discussed.
legal and planning processes.
23 | O D M D R A F T 2 0 1 8 / 2 0 1 9 I D P R E V I E W3.2 FINANCIAL ANALYSIS
C
3.2.1 CLEAN AUDIT
H
The Overberg District Municipality received clean unqualified audit opinions for three years in
succession, i.e. 2014/15, 2015/16 and 2016/17 periods under review. A
P
T
E
R
3
STATE OF THE DISTRICT
3.2.3 BUDGET-RELATED POLICIES IN IDP
Policy Status Council Res No.
1. Anti-Fraud, Corruption and Financial Misconduct Policy Unchanged A196. 29.01.2018
2. Asset Management Policy Unchanged A196. 29.01.2018
3. Bad Debt Written Off Policy Review A210. 26.02.2018
4. Borrowing Policy Review
5. Budget Policy Unchanged A196. 29.01.2018
6. Calculation for the Impairment of Debtors Policy Unchanged A196. 29.01.2018
7. Cash Management and Investment Policy Review A192. 29.01.2018
8. Credit Control and Debt Management Policy Unchanged A196. 29.01.2018
9. Customer Care Policy Review
10. Demand Management Policy Unchanged A196. 29.01.2018
11. Funding and Reserves Policy Unchanged A196. 29.01.2018
12. Infrastructure Investments and Capital Projects Policy Unchanged A196. 29.01.2018
13. Infrastructure Procurement and Delivery Management Policy Unchanged
14. Liquidity Policy Unchanged A196. 29.01.2018
15. Long-Term Financial Planning Policy Unchanged
16. Management and Administration of Immovable Assets Policy Unchanged A196. 29.01.2018
17. Payroll Management and Administration Policy Unchanged A196. 29.01.2018
18. Preferential Procurement Framework Policy Review
19. Supply Chain Management Policy Unchanged A196. 29.01.2018
20. Tariff Policy Unchanged A196. 29.01.2018
21. Virement Policy Unchanged A196. 29.01.2018
22. Remuneration Policy New
24 | O D M D R A F T 2 0 1 8 / 2 0 1 9 I D P R E V I E W3.2.4 NATIONAL GOVERNMENT ALLOCATIONS
Equitable Share and Total Allocations to Municipalities in Overberg Region
Equitable Share
Municipality 2018/19 2019/20 2020/21
(R’000) (R’000) (R’000)
Cape Agulhas 27 606 29 861 32 338
Overstrand 96 068 106 383 117 674
Theewaterskloof 87 385 95 274 103 492
Swellendam 29 001 31 536 34 311
Overberg District Municipality 67 902 71 298 74 293
Total: Overberg Munics 307 962 334 352 362 108
Source: Division of Revenue Bill 2018
Equitable Share and Total Allocations to District Municipalities in Western Cape
Equitable Share
District Municipality 2017/18 2018/19 2019/20
(R’000) (R’000) (R’000)
Central Karoo 28 502 30 316 31 867
Overberg 67 902 71 298 74 293
West Coast 88 405 92 295 95 824
Eden 151 237 156 941 162 177
Cape Winelands 225 214 232 002 238 403
Source: Division of Revenue Bill 2018
National Grant Allocations to Municipalities in Overberg Region for 2018/2019
ODM CAM OSM TWK SDM REGION
Allocation
(R’000) (R’000) (R’000) (R’000) (R’000) (R’000)
Equitable Share Formula 67 902 27 606 96 068 87 385 29 001 307 962
LG Financial Management Grant 1 000 1 550 1 550 1 700 1 770 7 570
Municipal Infrastructure Grant 10 874 21 639 25 962 11 786 70 261
Municipal Systems Improvement Grant 1 700 1 700
Integrated Nat Elec Prog (Mun) 2 000 4 262 5 000 2 000 13 262
Integrated Nat Elec Prog (Eskom) 13 660 13 660
Expanded Public Works Programme Grant 1 125 1 141 1 926 1 451 1 266 6 909
Rural Roads Asset Management Systems Grant 2 649 2 649
Energy Efficiency and Demand Side Mgt Grant 5 000 5 000
Source: Division of Revenue Bill 2018
It is noted that the Western Cape Provincial Government Allocations to Overberg Municipalities
will be included in the Final IDP Review.
3.2.5 BUDGET SCHEDULES
Attached are the following 2018/19 Draft Budget Schedules, as approved by Council on 26 March 2018:
SA4: Reconciliation of IDP Strategic Goals and Budget (Revenue)
SA5: Reconciliation of IDP Strategic Goals and Budget (Operating Expenditure)
SA6: Reconciliation of IDP Strategic Goals and Budget (Capital Expenditure)
SA9: Social, Economic and Demographic Statistics and Assumptions
SA18: Transfers and Grant Receipts
25 | O D M D R A F T 2 0 1 8 / 2 0 1 9 I D P R E V I E W26 | O D M D R A F T 2 0 1 8 / 2 0 1 9 I D P R E V I E W
27 | O D M D R A F T 2 0 1 8 / 2 0 1 9 I D P R E V I E W
28 | O D M D R A F T 2 0 1 8 / 2 0 1 9 I D P R E V I E W
29 | O D M D R A F T 2 0 1 8 / 2 0 1 9 I D P R E V I E W
30 | O D M D R A F T 2 0 1 8 / 2 0 1 9 I D P R E V I E W
3.3 ENVIRONMENTAL ANALYSIS

3.3.1    CLIMATE CHANGE

A Climate Change Adaptation Summary Report, developed through the Local Government Climate
Change Support Program in March 2018, contains the following summary of key vulnerability
indicators:

                                                                                  Exposure      Sensitivity      Adaptive
No                Sector                            Indicator Title
                                                                                   Answer        Answer       Capacity Answer
11 Agriculture                          Reduced food security                       Yes            High                Low
13 Biodiversity and Environment         Increased impacts on threatened             Yes            High                Low
                                        ecosystems
14 Biodiversity and Environment         Increased impacts on environment            Yes            High                Low
                                        due to land-use change
19 Coastal and Marine                   Loss of land due to sea level rise          Yes            High                Low
20 Coastal and Marine                   Increased damage to property from           Yes            High                Low
                                        sea level rise
22 Human Health                         Increased heat stress                       Yes            High                Low
29 Human Settlements, Infrastructure    Increased impacts on strategic              Yes            High                Low
   and Disaster Management              infrastructure
33 Human Settlements, Infrastructure    Increased risk of wildfires                 Yes            High                Low
   and Disaster Management
36 Water                                Decreased water quality in                  Yes            High                Low
                                        ecosystem due to floods and
                                        droughts
37 Water                                Less water available for irrigation and     Yes            High                Low
                                        drinking

Based on the key indicators identified in the table above, the following objectives and projects are prioritised
as a response to each of the indicators:

              Objective                                                    Project                                      Priority
 1. Biodiversity and Environment
 Manage Increased impacts on        Town Planning Department in the LMs to be guided by existing information            Priority
 threatened ecosystems              provided by WC Biodiversity Spatial Plan on Critical Biodiversity Area (CBA)
                                    and ensure appropriate development takes place on an ongoing basis.
 Manage Increased impacts on        Town Planning Department in LMs to consider appropriate development                 Priority
 environment due to land-use        parameters specifically in relation to land reclamation from water bodies on an
 change                             ongoing basis.
 2. Coastal and Marine
 Manage loss of land due to sea     Develop and implement coastal management programme and get feedback on              Priority
 level rise                         roles and responsibilities linked to CMP. Lines then to be incorporated into
                                    SDFs.
 Manage increased damage to         Disaster Management to Identify key infrastructure and communities under            Priority
 property from sea level rise       threat from extreme coastal events and include coastal precautionary zones in
                                    the Disaster Management Plan and District and Local SDFs.
 Manage Increased damage to         Town planning in the LMs to incorporate coastal management lines and flood          Priority
 property and loss of land from sea lines in the SDF on ongoing basis.
 level rise
 3. Human Health
 Manage health impacts from         Disaster Management in collaboration with LMs and others to map areas that          Priority
 increased storm events.            are at high risk from fires, flooding, extreme winds, sea level rise / sea storm
                                    surge on an annual basis.

31 | O D M D R A F T 2 0 1 8 / 2 0 1 9 I D P R E V I E W
4. Disaster Management, Infrastructure and Human Settlements
Technical Services in LMs to compile and implement a stormwater system Priority
maintenance plan (if not in existence) that take into account new risks from
climate change on an annual basis.
Manage increased impacts on Disaster Management Unit to draft a report on increased risk from intense Priority
traditional and informal dwellings weather events (heat waves, rainfall, fires) in informal shack dwellings within
urban area on an annual basis.
Manage potential increased risk of LMs to develop Alien Control Plans for Municipal Owned Lands, that include Priority
wildfires general alien clearing and clearing of fire-prone alien plant species.
Improve awareness raising and mainstreaming of fire and flood awareness Priority
through municipal communications platforms.
5. Water
Manage the quantity of water Technical Services in each LM to Develop/Update water loss management Priority
available for irrigation and drinking. plan to address water reticulation losses on annual basis
Technical Department in each LM to investigate alternative water sources and Priority
water re-use options by 2019/2020 financial year
District to Develop drought management plans for areas that don't already Priority
have such plans.
6. Cross Cutting
Coordinate climate change Apply to EEDSM for municipal retrofits of EE technologies (for municipalities Priority
response in the Municipality that distribute electricity)
Generate knowledge and Develop a communication protocol for early warning systems with public alerts Priority
disseminate information on climate (risk communication). Must reach all community members.
change
Increase public awareness on what to do during emergencies / disasters Priority
(including if cut off from help / supplies).
Environmental Management in DM and LMs to coordinate information to Priority
communications teams to increase public awareness on the impacts of climate
change and benefits of best practice environmental management.
3.3.6 DROUGHT AND DAM LEVELS
In spite of rain over certain areas, the drought is felt in many areas in the Overberg. Theewaterskloof
Municipality is a declared disaster area due to the drought and water availability. Reduction in demand and
strict water restrictions in the area, as well as the efficient use of disaster assistance and MIG funding have
ensured a constraint but sustained water supply for the towns in this municipality.
Ruensveld East Water Scheme is under pressure with an average storage time of 14 days. This is below what
we feel comfortable with based on the fact that no more water will be released from the Theewaterskloof Dam,
therefore, mitigation measures had to be implemented.
One of the measures is the reduction of demand or supply to the end user.
The second measure is the increasing of the height of the catchment berms in the river to increase storage
capacity. This is currently underway.
The third is to source funding for a further berm in the river to augment and further increase the storage
capacity.
In the event that these measures are not adequate or successful and a “Day Zero” is reached in the system,
Overberg Disaster Management have provided for emergency plans to ensure that drinking water can be
supplied to the affected farms and further measures put in place for supply of water to livestock.
Water restrictions are in place in Cape Agulhas and Overstrand Municipality and all the authorities are working
together to foster a culture of saving water and to prevent a Day Zero in the Overberg.
Winter rain started very late; first significant rain in July 2016. Winter rain normally starts around the Easter
weekend. Below normal rain fell in the winter which had significant impact on water levels in our major
storage dams across the Western Cape. Dam levels are generally much lower than corresponding time last
year.
32 | O D M D R A F T 2 0 1 8 / 2 0 1 9 I D P R E V I E WPresented by Provincial Disaster Management in March 2018: 33 | O D M D R A F T 2 0 1 8 / 2 0 1 9 I D P R E V I E W
3.3.7     SOLID WASTE MANAGEMENT

The Overberg District Municipality is currently in the process of reclaiming the management of
Karwyderskraal as a regional landfill facility. The new cell development will be completed by
January 2019. A loan was obtained to continue with the planning and development of the next waste cell. A
technical task team, consisting of DEADP, ODM, Theewaterskloof and Overstrand was established to confirm
ODMs ability to:

1) obtain a loan;
2) have the necessary capacity to take back the function; and
3) put forward a Service Level Agreement setting the way forward.

A draft Service Level Agreement and proposed tariffs has been discussed and communicated between
stakeholders and is in the process of being finalised.

ODM appointed a Specialist Service Provider to assist with the design, construction and supervision for
Cell 4, contract management, review of Integrated Waste Management Plan (IWMP) and monitoring. The
permit review for the facility was finalised by DEADP, setting out new conditions for the facility.

 3.4 ECONOMIC ANALYSIS

3.4.4.3   VALUE CHAINS

The main economic sectors that contribute to the Overberg District economy have interlinkages with each
other, e.g., the agricultural sector, which consists mainly of the barley, apples and canola industries, is well
established and products are exported to other provinces and countries. It has linkages with the manufacturing
sector regarding the processing of inputs or raw materials (i.e. apples, barley and canola) and the manufacturing
of products (i.e. juice, canned foods, machinery, transport equipment, etc.).

The following diagram outlines these sectoral linkages:

Main economic sectors in the Overberg:

    Apple production
South African apple production increased from 627 091 tons in 2006 to 912 751 tons in 2015, representing a
31% growth in production volume during the last ten years. There has been a general increase in the gross
value of apples between 2005 and 2015. The 2014/15 production season also experienced an 18.6% increase
in total gross value when compared to the previous production season (2013/14).

34 | O D M D R A F T 2 0 1 8 / 2 0 1 9 I D P R E V I E W
The Overberg District cultivates 11 443.04 hectares of apples and the majority of this is in Theewaterskloof
and Swellendam areas (i.e. Elgin Valley). Some apple growers (units larger than 60 ha) operate their own
packing and cold storage units. Economies of scale, consistency in yield and quality are the key characteristics
of these operations. Seasonality largely influences prices on the local markets in production, perishability of
produce and the number of apples exported. The impact of seasonality is to some extent cushioned by cold
storage facilities that ensure regular apple supplies in the local markets.
Total SA exports of apples increased from 268 065 tons in 2006 to 465 695 tons in 2015; this represents an
increase of 74% during the past decade. Most of South Africa’s exports of apples were destined for the
European (28% or 128 415 tons), African (45% or 208 508 tons) and Asian (27% or 125 686 tons) markets.
South Africa imports fewer apples than it exports, resulting in a trade surplus in favour of SA.
According to Hortgro, the drought has resulted in apple exports contracting by 9% in 2016. The persistently
high temperatures and low rainfall are also predicted to affect the coming year's crop negatively. The drought
also has adverse effects on the agricultural insurance industry in that it increases the risk of doing business,
consequently increasing insurance and financing rates.
Barley production
After wheat, barley is the most important small grain in SA. Its main use includes the production of malt (which
is used for the brewing of beer), animal feed (mainly barley which is not suitable for beer brewing) as well as
pearl barley. A very small part of barley crop produced in South Africa is used for animal feed.
In the Overberg District, the total hectares under barley production was 55 630.30 hectares, with the majority
in the Cape Agulhas (22 333.72 ha), Swellendam (20 272.47 ha) and Theewaterskloof (12 223.56 ha) areas.
Barley varies from most other agricultural commodities in that producers are mainly limited to only one major
barley buyer in South Africa, namely South African Breweries Malting (Pty) Ltd. This company supplies its
primary stakeholder, South African Breweries, with malted barley. Barley producers in the country have a
guaranteed market for their produce as well as fixed price contracts with the buyer. There is a malting plant in
Caledon where processing of barley for brewing takes place while the brewing of the malts takes place outside
the district at SAB Newlands.
South Africa has been a net importer of barley over the period under analysis. This means that the country
consumes more barley than it produces and this may be explained by the fact that in South Africa barley is
planted only for malting purposes. There is only one major buyer (SAB Maltings), and farmers find it too risky
to participate in such a market since they are aware that failure to meet SAB quality requirements would mean
no or narrow market for their products. South African barley processors depend mainly on barley imports to
successfully carry out their daily operations and as such, South Africa imported 128 057 tons of barley in 2015,
mostly from Canada, the EU and Australia.
The National Crop Estimates Committee indicated that given the drought conditions, farmers intend on
planting 2.4% less than the previous season.
Canola production
Canola is primarily used for the manufacturing of canola oil and oil cake, canola oil biodiesel, mayonnaise,
and canola meal which is a by-product used as a high protein feed ingredient for animal feed. The Overberg
District has 36 408.22 hectares under canola production, with the majority located in Swellendam (13 593.29
ha), Theewaterskloof (11 492.07 ha) and Cape Agulhas (10 870.52 ha).
During the year 2014, canola production reached a peak of 123 000 tons which was produced locally, and this
is about 178% higher compared to what was harvested during the year 2005. The canola production volumes
dropped by 20% in 2015 when compared to 2014 season which can be attributed to a decline in the area planted
to canola as well as the severe drought in the Western Cape.
The Southern Oil refinery in Swellendam is the largest buyer and processor of canola in the country and
supplies companies such as Woolworths, Ina Paarman, Unilever, Nestlé, Spur, Continental and Epic (Southern
Oil, 2017). The national reach of this enterprise highlights the importance of road network within the Overberg
District. South Africa has, over the past ten years, exported an average of 15.37 tons of canola per annum
(mainly to Congo and Lesotho) and imported 130.65 tons annually (mostly from the Netherlands, France and
Denmark).
35 | O D M D R A F T 2 0 1 8 / 2 0 1 9 I D P R E V I E W3.4.4.4 AGRICULTURE INFRASTRUCTURE
The following table depicts municipal agriculture infrastructure in the Overberg District:
Infrastructure TWK OSM CAM SDM Overberg
Abattoir – read meat 3 1 2 3 9
Abattoir – white meat 1 0 3 0 4
Agro-processing plant 17 6 0 4 27
Airfield 7 4 4 6 21
Chicken batteries 0 0 0 0 0
Chicken batteries – broilers 11 11 0 1 23
Chicken batteries – layers 4 1 1 1 7
Chicken hatchery 0 0 0 0 0
Cool chain facilities 0 0 0 0 0
Crush pen 147 24 175 64 410
Crush pen and dip ink 4 1 21 5 31
Dairy 55 12 50 91 208
Dam 3 434 520 903 653 5 510
Feedlot – beef 0 0 0 1 1
Feedlot – pigs 0 0 1 0 1
Feedlot - sheep 0 0 1 9 10
Fruit cool chain facilities 17 0 0 0 17
Fruit packers 12 0 0 2 14
Grain dam – commercial 0 0 0 0 0
Homestead 912 385 265 344 1 906
Homestead – labour 445 97 191 137 870
Nursery 4 7 1 4 16
Other 0 0 0 0 0
Packhouse 70 10 2 15 97
Piggery 4 0 0 0 4
Shade netting 57 88 31 16 192
Silo bags – commercial 1 0 3 1 5
Silo bags – non-commercial 4 0 0 0 4
Silos – commercial 7 0 5 1 13
Silos – non-commercial 2 0 2 12 16
Tunnels 33 19 6 49 107
3.4.6 UNEMPLOYMENT
Municipality 2011 2012 2013 2014 2015 2016
Cape Agulhas 8.6 9.1 8.9 9.3 9.5 10.0
Overstrand 16.3 16.9 16.3 17.0 17.8 19.0
Theewaterskloof 10.0 10.8 10.9 11.3 11.5 11.9
Swellendam 8.0 8.5 8.3 8.5 8.6 8.9
Overberg District 11.4 12.1 12.0 12.4 12.8 13.5
Western Cape Province 16.4 17.0 16.7 17.2 17.8 18.7
Source: Quantec Research 2017
The unemployment rate for the Overberg District was estimated to be 13.5% in 2016. This is lower than the
unemployment rate estimated for the Western Cape (18.7%) during the same period. Although the Overberg
has shown an increase in employment opportunities, the unemployment rate has increased year-on-year since
2010, indicating that the number of employment seekers are increasing at a faster rate than the creation of
employment opportunities in the District. The Overstrand municipal area has the highest unemployment rate
in the Overberg District (19.0%) which is marginally higher than the Provincial unemployment rate. The rising
unemployment rate is contributing to the increasing number of indigent households who need to be supported
with free basic services.
36 | O D M D R A F T 2 0 1 8 / 2 0 1 9 I D P R E V I E W3.5 SOCIO-ECONOMIC ANALYSIS
3.5.4 ACCESS TO BASIC SERVICES
Human Settlements: The type of housing that households live in is an important indicator of the extent of
human development within a municipal area. The form of housing that indicates low human development is
an informal dwelling such as a shack. The most informal settlements in the Overberg are found at Overstrand
(5 241), which will present a challenge on the service delivery capacity of the Municipality. Swellendam has
the least number of households living in informal dwellings (1 213).
Dwelling type per municipality within the Overberg District, 2017
Overberg District Theewaterskloof Overstrand Cape Agulhas Swellendam
Number % of Number % of Number % of Number % of Number % of
2017 total 2017 total 2017 total 2017 total 2017 total
House or brick structure on a 63 984 74.3 23 568 71.7 22 239 73.6 9 013 78.3 9 170 79.3
separate stand or yard
Traditional dwelling/hut/ 986 1.1 515 1.6 379 1.3 64 0.6 52 0.4
structure made of traditional
materials
Flat in a block of flats 2 065 2.4 1 129 3.4 686 2.3 179 1.8 80 0.7
Town/cluster/ semi-detached 3 259 3.8 1 336 4.1 831 2.8 255 2.2 844 7.3
house (simplex, duplex or triplex)
House/flat/ 1 055 1.2 418 1.3 392 1.3 177 1.5 70 0.6
room, in backyard
Informal dwelling/shack, in 4 397 5.1 1 587 4.8 2 199 7.3 174 1.5 437 3.8
backyard
Informal dwelling/shack, NOT in 8 862 10.3 3 628 11.0 3 042 10.1 1 478 12.8 776 6.7
backyard, e.g. in an informal/
squatter settlement
Room/flatlet not in backyard but 378 0.4 131 0.4 78 0.3 77 0.7 98 0.8
on a shared property
Other/ 1 371 1.6 692 2.1 418 1.4 153 1.3 110 0.9
unspecified/NA
Total 86 161 100 32 888 100 30 214 100 11 510 100 11 561 100
Source: Quantec/Urban-Econ calculations, 2016
Provision of Basic Services to Indigent Households
Theewaterskloof and Overstrand municipal areas experienced increases in the number of indigent households
between 2015 and 2016. Theewaterskloof specifically shows a significant increase in the number of indigent
households and consequently, increases in the free basic services provided by the municipalities. While the
provision of free basic services is necessary and in line with constitutional requirements, these services come
at a cost to the municipalities.
Different types of access to water, Overberg District, 2016
Municipality Inside the yard Less than 200m from yard More than 200m from yard
2015 2016 2015 2016 2015 2016
Cape Agulhas 8 521 8 615 599 742 0 0
Overstrand 26 019 26 417 0 0 0 0
Theewaterskloof 18 581 18 581 0 0 0 0
Swellendam 6 130 6 183 206 206 0 0
Source: Non-Financial Census of Municipalities, Stats SA 2017
37 | O D M D R A F T 2 0 1 8 / 2 0 1 9 I D P R E V I E WDifferent types of access to sanitation, Overberg District, 2016
Municipality Flush toilet connected Flush toilet Bucket system Ventilated improved Other
to public sewerage connected to septic pit latrine system
system tank
2015 2016 2015 2016 2015 2016 2015 2016 2015 2016
Cape Agulhas 5 894 5 963 2 934 2 965 0 0 0 0 708 742
Overstrand 19 118 22 568 8 715 6 138 0 0 0 0 0 0
Theewaterskloof 15 926 15 926 4 833 4 833 0 0 0 0 0 0
Swellendam 5 747 5 747 265 312 0 0 277 294 0 0
Source: Non-Financial Census of Municipalities, Stats SA 2017
3.5.5 EDUCATION
Theewaterskloof has by far the largest proportion (19.5%) of the total adult population with an educational
achievement higher than Grade 12 and the lowest proportion of people without schooling (2.4%). The largest
proportion of people without schooling are found at Swellendam (8.7%) and Overstrand (5.9%).
Cape Agulhas had the highest Matric pass rate in 2016(97.3%) followed by Swellendam (92.7%). Learner
enrolment in 2016 was highest in Theewaterskloof (18 815) followed by Overstrand (11 696). Grade 12
dropout rates were highest in Overstrand (40.6%), followed by Swellendam at (37.2%).
3.5.6 HEALTH
The main causes of death in the Overberg District in 2015 were diseases in the circulatory system (21.9%)
followed by neoplasms (19.8%) and external causes of morbidity and mortality (13.5%).
The 10 leading underlying natural causes of death, Overberg District, 2015:
Number %
Ischaemic heart diseases 160 7.1
Cerebrovascular diseases 147 6.6
Malignant neoplasms of respiratory and intrathoracic organs 146 6.5
Diabetes Mellitus 136 6.1
Chronic lower respiratory diseases 125 5.6
Tuberculosis 112 5.0
Malignant neoplasms 110 4.9
Hypertensive diseases 89 4.0
Other forms of heart disease 75 3.3
Influenza and pneumonia 62 2.8
Other natural causes 778 34.7
Non-natural causes 303 13.5
Total 2 243 100
Source: Mortality and causes of death in SA in 2015; Stats SA 2017
The majority of deaths in the OBD in 2015 were elderly people aged 65 and over (46.1%), and adults aged
45 - 64 (30.3%). Deaths of people in the 15 - 44 age group (18.5%) is a cause for concern as this includes the
economically active population and therefore has a negative implication for economic performance.
38 | O D M D R A F T 2 0 1 8 / 2 0 1 9 I D P R E V I E W3.5.7 SAFETY AND SECURITY
Overberg District Western Cape
(per 100 000) % (per 100 000) %
2015 Change 2015 Change
2016 2017 2016 2017
Murder 35 38 9.0 50 50 0.5
Sexual offences 114 120 5.2 111 108 -2.3
Drug-related crimes 1 534 1 689 10.1 1 461 1 633 11.8
Driving under the influence 196 207 5.5 182 196 7.6
Residential burglaries 1 133 1 212 7.0 739 700 5.3
Fatal crashes 58 65 12.1 1 202 1 228 2.2
Road user fatalities 73 83 13.7 1 357 1 397 2.95
Source: Western Cape Dept of Transport 2017; SAPS 2016; Stats SA 2017
3.5.8 SOCIAL DEVELOPMENT
It is confirmed that interviews for a Director Community Services was held on 5 March 2018. Council is
currently finalising the process, the outcome of which will be confirmed in the Final IDP Review.
It is noted that the following Key Performance Indicators (KPIs) have been included in Chapter 4, section
4.4.6 on page X, indicating the Overberg District Municipality’s commitment toward social development and
assisting Local Municipalities in the Region with the roll-out of programmes addressing the social ills in the
Overberg District.
Conclude Memorandum of Understanding with Department Social Development;
Establish a District Social Development stakeholder structure;
Develop a District Social Development Initiatives Action Plan (in collaboration with Local
Municipalities); and
Report to Council on progress of social development initiatives across the region.
3.5.10.2 SPORTS TOURISM
It is confirmed that the Provincial Department of Cultural Affairs & Sports (DCAS), in collaboration with the
District, will be hosting a Sports Tourism Workshop on 5 April 2018 in Bredasdorp. This engagement would
inform the development of a District Sports Tourism Strategy.
39 | O D M D R A F T 2 0 1 8 / 2 0 1 9 I D P R E V I E WChapter 4 is designed to provide progress on performance per functional area during the 2017/18 period,
as well as an update of Key Performance Indicators (KPIs) for the outer years.
C
4.1 OFFICE OF THE MUNICIPAL MANAGER
H
4.1.1 INTERNAL AUDIT
Yr 1 Yr 2
Outer Years
A
Predetermined Key Performance 2017/18 2018/19
Directorate
Strategic
Goal
Objective
(PDO)
Indicator
(KPI)
Target/Progress
Target Prog Q1
Targets
Q2 Q3 Q4
Yr 3
Targets
Yr 4 Yr 5
P
2019/20 2020/21 2021/22
Office of the SG#5:
Municipal To ensure
Develop a Risk-
based Audit Plan
Annual RBAP
developed
1 1 1 1 1 T
Manager good for 2018/19 by
governance
practices by
June 2019 E
providing a Execute audit Number of audits 10 10 3 4 4 3 14 14 14
democratic
and pro-active
projects ito the
RBAP
executed per annum R
accountable
government
and
encouraging
4
community
participation
DEVELOPMENT PRIORITIES : REVISED KPIs
through
existing IGR
structures.
4.1.2 IDP & COMMUNICATION
Yr 1 Yr 2
Outer Years
Strategic Predetermined Key Performance 2017/18 2018/19
Targets
Directorate Goal Objective Indicator Target/Progress Targets
(PDO) (KPI) Yr 3 Yr 4 Yr 5
Target Prog Q1 Q2 Q3 Q4
2019/20 2020/21 2021/22
Office of the SG#5: Facilitate IDP Number of IDP 2 1 2 2 2 2
Municipal To ensure Awareness Awareness
Manager good campaigns by campaigns
June 2019 facilitated per
governance
annum
practices by
providing a Publishing of bi- Number of External 2 1 1 1 2 2 2
democratic annual External Newsletters
and pro- Newsletter to published per
active stakeholders annum
accountable
government Table to Council Final IDP Review 1 1 1 1 1
by May 2019 the tabled to Council
and
2nd Review of the
encouraging 4th Generation
community IDP
participation
through
existing IGR
structures.
40 | O D M D R A F T 2 0 1 8 / 2 0 1 9 I D P R E V I E W4.1.3 PERFORMANCE AND RISK MANAGEMENT
Yr 1 Yr 2
Outer Years
Predetermined Key Performance 2017/18 2018/19
Strategic Targets
Directorate Objective Indicator Target/Progress Targets
Goal
(PDO) (KPI) Yr 3 Yr 4 Yr 5
Target Prog Q1 Q2 Q3 Q4
2019/20 2020/21 2021/22
Office of the SG#5: Prepare TL SDBIP TL SDBIP submitted to 1 1 1 1 1
Municipal To ensure for approval by Mayor for approval
Manager good Mayor within 28
days after adoption
governance
of 2019/20 Budget
practices by
providing a Review annually the SDBIP reviewed by 1 1 1 1 1 1
democratic SDBIP to inform January 2019
and pro- Council should a
active revised SDBIP be
accountable necessary
government
Compilation and Draft by 1 1 1 1 1 1
and
submission of Draft 31 August 2019
encouraging Annual Report to
community A-G by
participation 31 August 2019
through
existing IGR
structures.
4.1.4 RISK MANAGEMENT (SHARED SERVICES MODEL)
Yr 1 Yr 2
Outer Years
Predetermined Key Performance 2017/18 2018/19
Strategic Targets
Directorate Objective Indicator Target/Progress Targets
Goal
(PDO) (KPI) Yr 3 Yr 4 Yr 5
Target Prog Q1 Q2 Q3 Q4
2019/20 2020/21 2021/22
Office of the SG#5: Review Risk Number of Risk 5 5 5 5 5
Municipal To ensure Management Management policies
Manager good policies of all the reviewed per annum
municipalities in the
governance
District by
practices by 31 May 2019
providing a
democratic Report quarterly to Number of reports 4 2 1 1 1 1 4 4 4
and pro- the DCFTech on the submitted per annum
active Shared Services
accountable Risk Management
function
government
and
encouraging
community
participation
through
existing IGR
structures.
41 | O D M D R A F T 2 0 1 8 / 2 0 1 9 I D P R E V I E WYou can also read


