Drinking Water Quality Management Plan - Document No. WMP.001 Version 1.5 Date 30 March 2021 - Livingstone Shire ...
←
→
Page content transcription
If your browser does not render page correctly, please read the page content below
Drinking Water Quality
Management Plan
Document No. WMP.001
Version 1.5
Date 30 March 2021
Livingstone Shire Council                                   Drinking Water Quality Management Plan

Approval and Revision Control

Approved by             Title                        Signature                  Date
Michael Dalton          Water Quality Officer
Jon Edge                Coordinator Water &
                        Sewerage Operations
Nigel Deacon            Manager Water and Waste
Adopted by                                           Date
Council

Controlled Hardcopy Distribution List

Copy No.       Position Title                                     Officer’s Name
1              Manager Water and Waste                            Nigel Deacon
2              Coordinator Water & Sewerage Operations            Jon Edge
3              Water Quality Officer                              Michael Dalton

Revision

Revision      Title                                              Revised By        Date
No.
1.1           Drinking Water Quality Management Plan             Sean Fallis       25/6/2015
1.2           Drinking Water Quality Management Plan             Sean Fallis       28/9/2018

1.3           Drinking Water Quality Management Plan             Sean Hinton       24/8/2020
1.4           Drinking Water Quality Management Plan             Sean Hinton       10/12/2020
1.5           Drinking Water Quality Management Plan             Nigel Deacon      30/03/2021

Document No. WMP.001 Version No. 1.5 Date 30/03/21                                        Page 2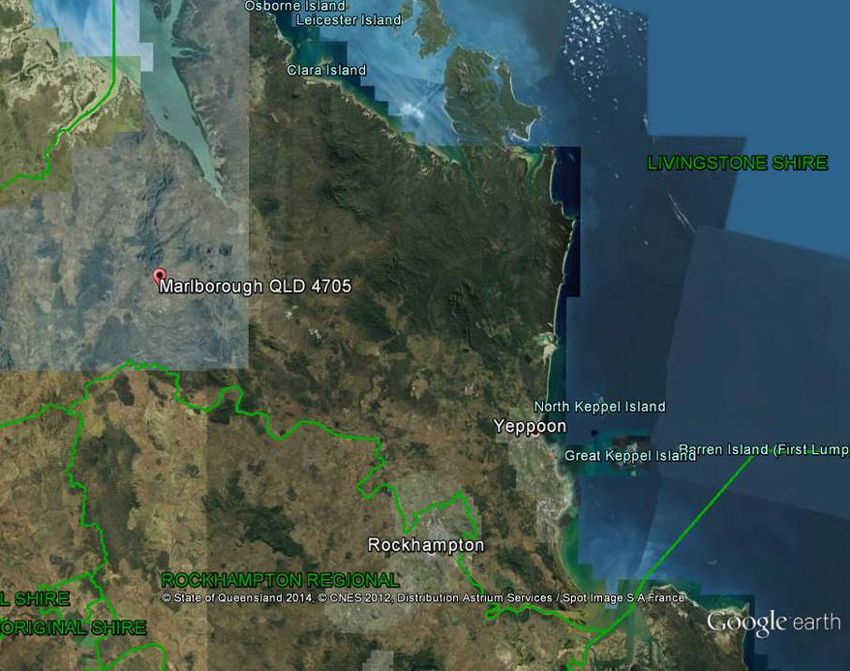
Livingstone Shire Council                                                                        Drinking Water Quality Management Plan

TABLE OF CONTENTS
            EXECUTIVE SUMMARY…………………………………………………………………...5
1           Purpose ..................................................................................................................................... 7
     1.1        Plan structure ........................................................................................................ 7
     1.2        Commitment to Drinking Water Quality .................................................................. 7
2           Regulatory Requirements ....................................................................................................... 7
3           Service Details .......................................................................................................................... 8
     3.1        Overview of Drinking Water Schemes ................................................................... 8
     3.2        High Level Scheme Description ............................................................................. 9
     3.3        Current Details and Future Demand .................................................................... 12
4           Stakeholders Relevant to Managing Drinking Water Quality ............................................ 14
5           Hazard Identification and Risk Assessment ....................................................................... 15
     5.1        Risk Methodology ................................................................................................ 15
     5.2        Risk Assessment Team ....................................................................................... 16
     5.3        Hazard identification and Unmitigated Risk Assessment ..................................... 17
6           Operational and Verification Monitoring ............................................................................. 21
     6.1    Operational monitoring ........................................................................................ 21
       6.1.1   Operational Procedures ................................................................................. 21
     6.2    Verification monitoring: ........................................................................................ 21
       6.2.1   Escherichia coli monitoring schedule ............................................................. 22
       6.2.2   Other Monitoring Parameters ......................................................................... 23
7           Emergency Response Plan ................................................................................................... 25
     7.1    Detail of Incidents and Response Levels: ............................................................ 25
       7.1.1   Level 1 Operational Action ............................................................................. 25
       7.1.2   Level 2 Incident or Emergency....................................................................... 26
       7.1.3   Level 3 Declared Disaster .............................................................................. 26
     7.2    Multiple entity arrangements ................................................................................ 27
     7.3    Example incident response .................................................................................. 27
       7.3.1   Exceedance of Water Quality Criteria ............................................................ 27
8           Employee Awareness and Training ..................................................................................... 28
     8.1    Training ............................................................................................................... 28
       8.1.1    Formal training: .............................................................................................. 28
       8.1.2    Informal training: ............................................................................................ 28
       8.1.3    Employee awareness of DWQMP .................................................................. 28
9           Community Engagement ....................................................................................................... 29
     9.1        Consultation and Communication ........................................................................ 29
10          Research and Development .................................................................................................. 29
     10.1       Investigative studies ............................................................................................ 29
     10.2       Validation............................................................................................................. 29
     10.3       Design of equipment ............................................................................................ 30
11          Documentation and Reporting ............................................................................................. 30
     11.1       Operational monitoring data................................................................................. 30
     11.2       Verification monitoring data ................................................................................. 31
     11.3       Cyber security...................................................................................................... 31
12          Evaluation and Audit ............................................................................................................. 31
     12.1       Long term evaluation of results ............................................................................ 31
     12.2       Audits .................................................................................................................. 31
13          Review and Continual Improvement .................................................................................... 31
     13.1       Risk Management Improvement Plan .................................................................. 32

Document No. WMP.001 Version No. 1.5 Date 30/03/21                                                                                                  Page 3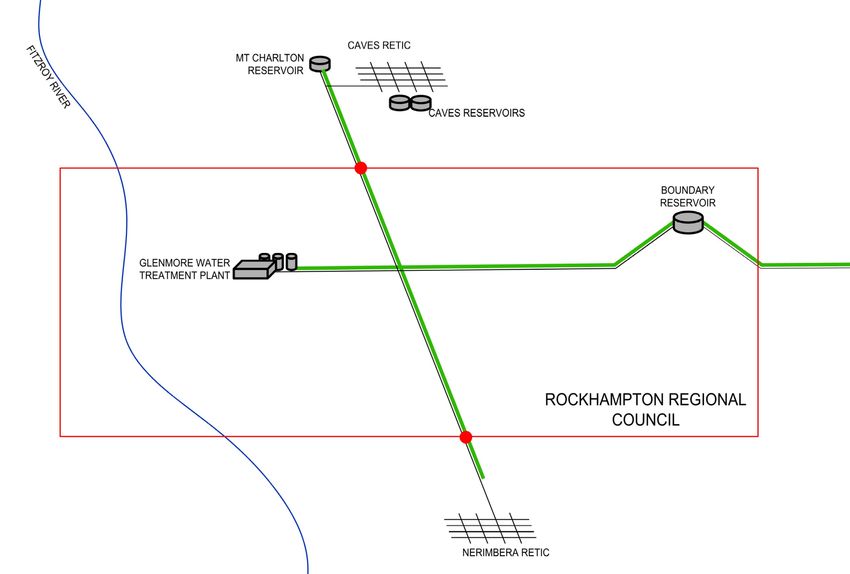
Livingstone Shire Council                                                                    Drinking Water Quality Management Plan

PART 2 CAPRICORN COAST DRINKING WATER SCHEME ........................................................... 35
1     Overview of Scheme .............................................................................................................. 35
    1.1    Catchment Description ........................................................................................ 35
      1.1.1   Water Park Creek .......................................................................................... 35
      1.1.2   Fitzroy River Catchment ................................................................................ 36
2          Scheme Infrastructure and Operation ................................................................................. 36
    2.1    Woodbury Water Treatment Plant........................................................................ 36
      2.1.1   Process description:....................................................................................... 38
    2.2    Rockhampton- Yeppoon Pipeline......................................................................... 40
      2.2.1   Glenmore Water Treatment Plant .................................................................. 40
    2.3    Reticulation network ............................................................................................ 41
3     Water Quality Information ..................................................................................................... 42
4     Hazards ................................................................................................................................... 46
5     Risk Assessment ................................................................................................................... 46
6     Operational Monitoring.......................................................................................................... 46
PART 3 NERIMBERA AND THE CAVES DRINKING WATER SCHEME .......................................... 52
1     Overview of Scheme .............................................................................................................. 52
    1.1        Catchment description ......................................................................................... 52
2          Scheme Infrastructure and Operation ................................................................................. 53
       2.1.1         Glenmore Water Treatment Plant .................................................................. 53
       2.1.2         Reticulation: ................................................................................................... 54
3     Water Quality Information ..................................................................................................... 55
4     Hazards ................................................................................................................................... 57
5     Risk Assessment ................................................................................................................... 57
6     Operational Monitoring.......................................................................................................... 57
PART 4 MARLBOROUGH DRINKING WATER SCHEME ................................................................. 59
1     Overview of Scheme .............................................................................................................. 59
    1.1        Marlborough Bores .............................................................................................. 59
2    Scheme Infrastructure and Operation ................................................................................. 59
3    Water Quality Information ..................................................................................................... 63
4    Hazards ................................................................................................................................... 65
5    Risk Assessment ................................................................................................................... 65
6    Operational Monitoring.......................................................................................................... 68
APPENDIX A – High Risk Customers ............................................................................................... 69
APPENDIX B – List of Operational Documents ............................................................................... 70
APPENDIX C – Bulk Water Supply Agreement (extracts) ............................................................... 72

Document No. WMP.001 Version No. 1.5 Date 30/03/21                                                                                           Page 4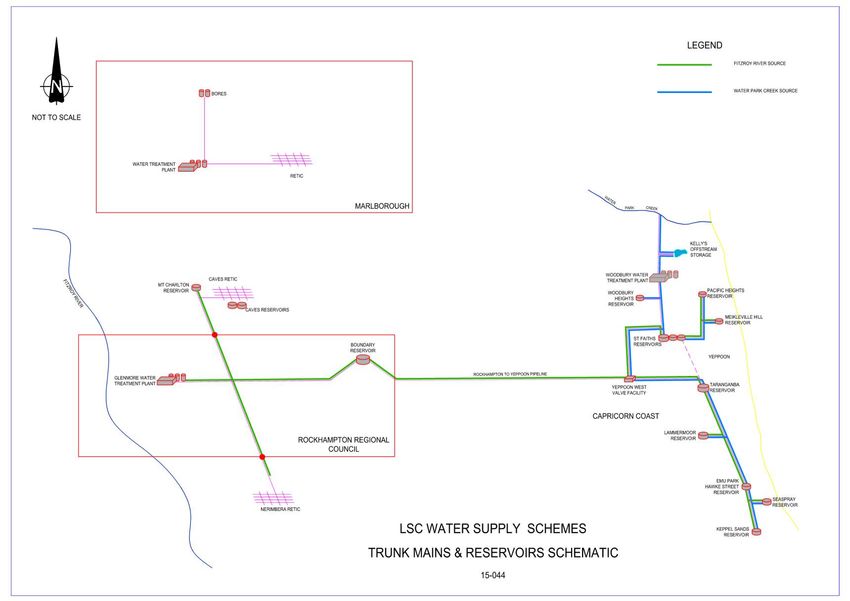
Livingstone Shire Council                                                           Drinking Water Quality Management Plan

FIGURES
Figure 1        Marlborough location map ................................................................................... 9
Figure 2        Nerimbera and the Caves location map ............................................................... 9
Figure 3        Livingstone Shire Council’s Water Supply Schemes – High Level Schematic .... 11
Figure 4        Points of transfer between Fitzroy River Water and LSC ................................... 12
Figure 5        Woodbury WTP Schematic ............................................................................... 37
Figure 6        Capricorn Coast Water Mains by Age and Material ........................................... 41
Figure 6        Nerimbera and The Caves schematic................................................................ 53
Figure 8        Nerimbera and the Caves Water Mains by Age and Material............................. 55
Figure 10         Marlborough – Water Mains by Age and Material .......................................... 61
Figure 8        Marlborough WTP Schematic ............................................................................ 62

TABLES
Table 1    Current and future connections, population and water demands ....................... 12
Table 2    Stakeholders involved in the management of drinking water quality .................. 14
Table 3    Risk Assessment Definitions and Descriptors.................................................... 15
Table 4    Risk matrix ........................................................................................................ 16
Table 5    Risk assessment team ...................................................................................... 16
Table 6    Hazard Identification – all schemes ................................................................... 18
Table 7    Verification monitoring sample sites .................................................................. 22
Table 8    Emergency Response Levels ............................................................................ 25
Table 9    Software systems used for management of information .................................... 30
Table 10 Risk management improvement program .......................................................... 33
Table 12 Capricorn Coast reservoir details ...................................................................... 41
Table 13 Operational monitoring data summary – Woodbury WTP (2014 to 2020) .......... 43
Table 14 Verification monitoring data – Woodbury WTP raw and treated water, standard
water analyses and heavy metals (2014-2020) ................................................................... 44
Table 15 Verification monitoring data – Glenmore WTP raw and treated water, standard
water analyses and heavy metals (2014-2020) ................................................................... 45
Table 16 Verification monitoring data summary – Capricorn Coast (2014 to 2020) .......... 46
Table 17 Mitigated risk assessment – Capricorn Coast .................................................... 48
Table 19 The Caves and Nerimbera reservoir details....................................................... 55
Table 20 Verification monitoring data summary – Nerimbera and the Caves reticulation
(2014 to 2020)..................................................................................................................... 55
Table 21 Verification monitoring – Glenmore WTP raw and treated water, standard water
analyses and heavy metals (2014-2020) ............................................................................. 56
Table 22 Mitigated Risk Assessment – The Caves and Nerimbera .................................. 58
Table 24 Verification monitoring data summary – Marlborough reticulation (2014 to 2020)
           63
Table 25 Verification monitoring – Marlborough WTP raw and treated water, standard
water analyses and heavy metals (2014-20) ....................................................................... 64
Table 26 Mitigated Risk Assessment – Marlborough ........................................................ 66

Document No. WMP.001 Version No. 1.5 Date 30/03/21                                                                             Page 5
Livingstone Shire Council                                  Drinking Water Quality Management Plan

EXECUTIVE SUMMARY
The Livingstone Shire Council Drinking Water Quality Management Plan (DWQMP) has
been prepared in accordance with section 94 of the Water Supply (Safety and Reliability)
Act. The purpose of the DWQMP is to protect public health through the comprehensive
management of drinking water quality.

The drinking water quality management plan follows a risk-based management approach
and demonstrates how Livingstone Shire Council effectively manages the drinking water
services on the Capricorn Coast and Marlborough from catchment to tap, and from point of
supply from Rockhampton Regional Council to tap for The Caves and Nerimbera water
supply scheme to ensure that a safe and reliable supply of drinking water is provided to all
our customers.

The DWQMP is structured in four parts to provide an overview of the drinking water service,
and the key management measures that apply to all schemes. Each drinking water scheme
is detailed separately to provide a site based management plan suitable for use by the
operators of the schemes. It is intended that these documents are used in conjunction with
the operational procedures to ensure effective management of the drinking water supply.

This plan identifies the key hazards and hazardous events which may affect the services,
and after identifying the preventative measures that are in place, assesses the mitigated risk
that these hazards pose to the service. Where mitigated risks are considered unacceptable,
further preventative measures are identified as improvement items. These improvement
items are prioritised and recommended to Council for funding as considered appropriate.

Document No. WMP.001 Version No. 1.5 Date 30/03/21                                       Page 6

Livingstone Shire Council Drinking Water Quality Management Plan
1 Purpose
The Livingstone Shire Council (Council) Drinking Water Quality Management Plan
(DWQMP) documents the water services supplied by Council. The DWQMP identifies, and
demonstrates how Council manages the risks to the water supply services provided. The
DWQMP is based on the best practice guidelines of the Australian Drinking Water
Guidelines.
1.1 Plan structure
The DWQMP is structured to address the 12 Elements of the Australian Drinking Water
Guidelines. The Part 1 of the DWQMP provides:
Commitment to drinking water quality (Element 1)
A high level overview of the drinking water services,
Description of the Risk Methodology used (partially meeting Element 2)
Emergency Response Plan, (Element 6)
Supporting Requirements (Elements 7-10)
Review and Audit requirements (Elements 11-12)
Parts 2 to 4 of the DWQMP are scheme based; each scheme individually addresses the:
Assessment of the drinking water supply system (Element 2)
Preventative measures for drinking water quality (Element 3)
Operational procedures and process control (Element 4)
Verification of drinking water quality (Element 5)
In so doing, the regulatory requirements (detailed in Section 2) are also addressed.
1.2 Commitment to Drinking Water Quality
Livingstone Shire Council (LSC) will:
Take all reasonable action to provide its customers with reliable and continuous
services.
Endeavour to ensure that the water supplied meets the health and aesthetic
guidelines stated in the Australian Drinking Water Quality Guidelines.
These commitments are stated in the Livingstone Shire Council Customer Service
Standards, which are available on Council’s website.
2 Regulatory Requirements
Drinking Water Quality Management is regulated in part by the following Acts and
Regulations.
Water Supply (Safety and Reliability) Act 2008
o Water Supply (Safety and Reliability) Regulation 2011
Public Health Act 2005
o Public Health Regulation 2018
Document No. WMP.001 Version No. 1.5 Date 30/03/21 Page 7Livingstone Shire Council Drinking Water Quality Management Plan
Water management is also impacted by other Acts (such as the Water Act 2000, and the
Environment Protection Act 1994), but these are outside the scope of the Drinking Water
Quality Management Plan.
3 Service Details
Livingstone Shire Council
Registered Service Provider ID 556
Ph: 4913 5000 or 1300 790 919 | Fax: 4936 4776
Registered Business Address: 25 Normanby Street, Yeppoon Qld 4703
Mailing Address: PO Box 2292, Yeppoon Qld 4703
Web: www.livingstone.qld.gov.au
3.1 Overview of Drinking Water Schemes
Livingstone Shire Council de-amalgamated from Rockhampton Regional Council on
1st January 2014. Livingstone Shire Council defines 3 drinking water schemes:
1. Capricorn Coast Water Supply Scheme (Multiple provider arrangement).
2. Nerimbera and The Caves Water Supply Scheme (Multiple provider arrangement).
3. Marlborough Water Supply Scheme (Livingstone Shire Council only).
Livingstone Shire Council also operates the non-potable Ogmore water supply.
The Capricorn Coast Scheme centres on Yeppoon, the Caves and Nerimbera scheme is
located close to Rockhampton, and the Marlborough Water Supply Scheme is located at
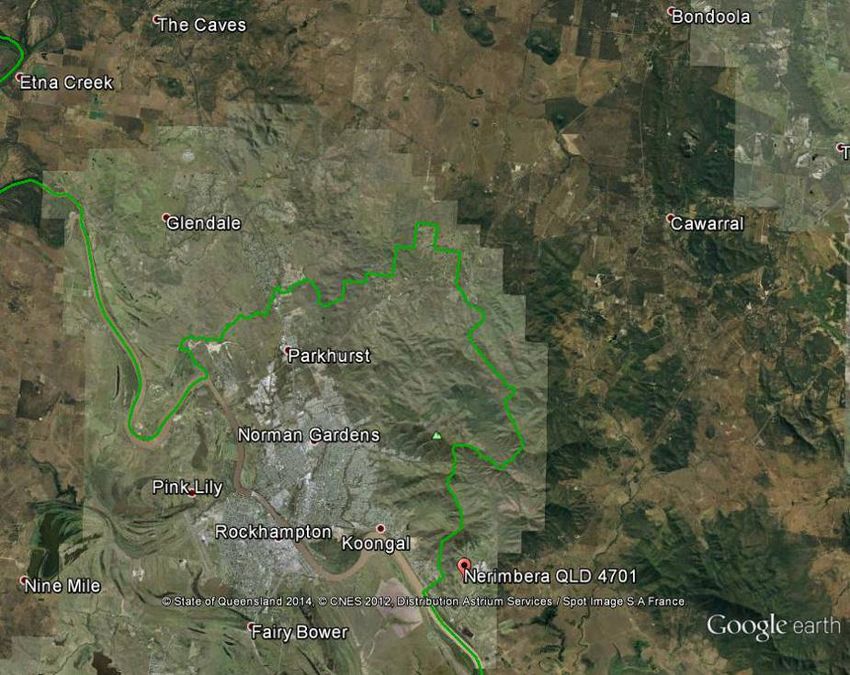
Marlborough. These locations are identified in Figure 1 and Figure 2. The current Council
boundary is identified in green.
A high level schematic showing all of LSC’s water supply schemes, reservoirs, and key trunk
mains is provided in Figure 3.
Document No. WMP.001 Version No. 1.5 Date 30/03/21 Page 8Livingstone Shire Council Drinking Water Quality Management Plan Figure 1 Marlborough location map Figure 2 Nerimbera and the Caves location map 3.2 High Level Scheme Description Operationally, these schemes are unique and each scheme has different considerations. The Capricorn Coast Scheme serves the communities of Yeppoon, The Causeway, Kinka Beach, Zilzie, Emu Park and Keppel Sands. The Mercure Capricorn Resort is a major customer at Yeppoon. Capricorn Coast has two distinct water supplies. The first supply is Water Park Creek which is harvested into the Kelly’s Offstream Storage. Water from this storage is conventionally treated and disinfected at the Woodbury Water Treatment Plant Document No. WMP.001 Version No. 1.5 Date 30/03/21 Page 9
Livingstone Shire Council                                  Drinking Water Quality Management Plan

(WTP), which is operated by Livingstone Shire Council. Water from the Woodbury WTP is
supplemented by a second water supply via the Rockhampton to Yeppoon Water Supply
Pipeline. This 40 km pipeline supplies water treated conventionally by Fitzroy River Water
(FRW), a business unit of Rockhampton Regional Council, at their Glenmore WTP.
The entire water supply for “The Caves area” and “Nerimbera” areas are sourced from, and
are zones within the Glenmore Water Treatment Plant reticulation network. Livingstone Shire
Council has no role in treating the water for these zones with the exception of re-chlorination
at Mt Charlton reservoir. The local government boundary separates these areas from the
Glenmore WTP reticulation network. The Caves and Nerimbera distribution areas are
separate and distinct. The Caves area, located to the North of Rockhampton, includes the Mt
Charlton, Ramsay Creek, Etna Creek, Glenlee, Glendale and Rockyview, and The Caves
communities. The Capricorn Correctional Centre is a major customer in this zone. Water is
supplied to Livingstone Shire Council at the Ramsay St flow monitoring point. There is a
small reticulation area off Argyle St where drinking water returns to FRW control. Areas of
Parkhurst can also be backfed through the Ramsay Creek valve when FRW is not pumping
into Mount Charlton. Both LSC and FRW agree that there is no further increase in public
health risks to FRW due to this arrangement. Nerimbera is a small community located 8 km
East of Rockhampton town centre, and pressure is maintained by the Lakes Creek Road
Water Pump Station. Livingstone Shire Council has no pumps or reservoirs in the Nerimbera
zone. There is an abattoir located at the far end of this reticulation zone, and this is
considered to be a high-risk customer. There is no further treatment or re-chlorination in this
zone.
The points of transfer between Fitzroy River Water and LSC are shown in Figure 4.
The Marlborough Water Supply Scheme is a bore water catchment to tap scheme that
serves the community of Marlborough. Bore water is treated by bag filtration and/or reverse
osmosis prior to disinfection. It is fully owned and operated by Livingstone Shire Council.

Document No. WMP.001 Version No. 1.5 Date 30/03/21                                       Page 10
Livingstone Shire Council                                                                Drinking Water Quality Management Plan

Figure 3       Livingstone Shire Council’s Water Supply Schemes – High Level Schematic

Document No. WMP.001 Version No. 1.5 Date 30/03/21                            Page 11
Livingstone Shire Council                                   Drinking Water Quality Management Plan

Figure 4          Points of transfer between Fitzroy River Water and LSC

3.3 Current Details and Future Demand
Table 1 Current and future connections, population and water demands
                              Current (2019)                         Future (2029)
 Scheme                                         Demand                                                  Demand
                       Population     Connections                     Population      Connections
                                                         (ML/day)                                       (ML/day)
 Capricorn Coast         31043           12,417                          36383           14,553
 The Caves                3475            1390            15.4*          4073             1,629           18.0*
 Nerimbera                238               95                            279              111
 Marlborough              140               56            0.033           164               66            0.039
Population estimates based on QLD Govt. Statistician’s Office data; 2.5 persons per dwelling.
Future scenario based on QLD Govt. Statistician’s Office projected 10 year growth rate of 1.6%.
*Note: the Caves and Nerimbera water demands are included within the Capricorn Coast data; consistent with
the KPI reporting methodology. The schemes are serviced by the Glenmore WTP, and the water demands of
each area are insignificant relative to the total output from this WTP. Connections and populations have been
listed separately to allow comparison with Public Health Regulation 2018 water quality monitoring requirements.

Document No. WMP.001 Version No. 1.5 Date 30/03/21                                                        Page 12
Livingstone Shire Council Drinking Water Quality Management Plan Current and future demand can be met with existing infrastructure as the proportion of flow to Capricorn Coast from the pipeline is able to be significantly increased; population growth does not need to be considered as a hazard to the service at this time. Document No. WMP.001 Version No. 1.5 Date 30/03/21 Page 13
Livingstone Shire Council                          Drinking Water Quality Management Plan

4        Stakeholders Relevant to Managing Drinking Water
         Quality

The following list includes the stakeholders that are involved in various aspects of drinking
water quality management.

Table 2        Stakeholders involved in the management of drinking water quality
   Name of Stakeholder         How Involved                 Stakeholder Contribution
                                  All Water Supply Schemes
                           Water Supply (Safety Regulator of drinking and recycled water
 Department of Natural     and & Reliability) Act schemes, incident management (referred to
 Resources, Mines and      Water Act 2008         in this document as the Regulator)
 Energy                                           Water quality and quantity monitoring and
                           Water Act 2000
                                                  management
                           Public Health Act
                           2005                   Primary responsibility for public health,
 Queensland Health
                           Water Fluoridation     incident management
                           Act
 Department of
                           Environment
 Environment and                                  Regulator for protection of the environment.
                           Protection Act 1994
 Science
                      Nerimbera and The Caves Water Supply Scheme
 Rockhampton Regional
                                                  Treats and supplies drinking water to
 Council (trades as        Bulk water supply
                                                  Nerimbera and The Caves zones.
 Fitzroy River Water)
 Capricorn Correctional    Reticulation supply
                                                  Major customer, large population.
 Centre                    to Prison
                           Reticulation supply
 Swift Meatworks                                  Major commercial customer
                           to abattoir
                          Capricorn Coast Water Supply Scheme
 Rockhampton Regional                             Treats and supplies drinking water through
                           Bulk water supply
 Council                                          the Rockhampton-Yeppoon water pipeline
 Byfield Community         Water Park Creek       Water Park Creek waterways health
 Reference Panel           raw water source       management
 Hospital/ Aged Care/      Vulnerable
                                                  At risk customers
 Child Care                customers
                           Reticulation supply
 Surf Lakes                                       Major commercial customer
                           to wave park
                               External Contractors/Suppliers
                           WTPs and Reservoir
 Ixom                                             Chlorine gas supplier
                           Disinfection
 Omega Chemicals           WTPs                   Coagulant chemical supplier
 Redox                     WTPs                   Treatment chemical supplier
                           WTPs and Reservoir
 Coogee Chemicals                                 Sodium hypochlorite supplier
                           Disinfection
 Chemiplas & SNF           WTPs                   Treatment chemical supplier
 Activated Carbon
                           WTPs                   Activated carbon supplier
 Technologies

Document No. WMP.001 Version No. 1.5 Date 30/03/21                                        Page 14
Livingstone Shire Council Drinking Water Quality Management Plan
5 Hazard Identification and Risk Assessment
5.1 Risk Methodology
Livingstone Shire Council has adopted a risk assessment methodology that is adapted from
the “Preparing a Drinking Water Quality Management Plan Supporting Information,
September 2010” documentation provided by the Regulator. The methodology differs from
the published version in that the consequence and uncertainty definitions have been tailored
to more accurately reflect the circumstances at Livingstone Shire Council. The methodology
and definitions also vary from Council’s Enterprise Risk Management Procedure to be better
suited to this specific risk assessment activity.
Table 3 Risk Assessment Definitions and Descriptors
Likelihood Descriptor
Almost Certain Occurs more often than once per week
Likely Occurs more often than once per month, and up to once per week
Possible Occurs more often than once per year, and up to once per month
Unlikely Occurs more often than once every 5 years, and up to once per year
Rare Occurs less than once every 5 years
Consequence Descriptor
Potential acute health impact, significant community illness (> 4 people)
Catastrophic
expected
Major Potential acute health impact, no community illness expected
Moderate Repeated breach of chemical health guideline value
Isolated breach of chemical health guideline value, or widespread
Minor
occurrence of parameter above aesthetic guideline
Potential isolated occurrence of aesthetic parameter above guideline
Insignificant
value.
Uncertainty Descriptor
The processes involved are thoroughly understood and supported by very
Certain extensive on site knowledge covering multiple drought and flood cycles,
and/or high frequency (weekly or better) water quality monitoring data.
The processes involved are well understood and supported by extensive
Confident on site knowledge of more than one drought and flood cycle, and/or
monthly water quality data
There is a good understanding of the process which is supported by
Reliable quarterly water quality data and/or operational experience that covers
drought and flood years.
The process is reasonably well understood, and/or data covers seasonal
Estimate
variations for drought and flood cycles.
The process is not well understood, and/or water quality data does not
Unreliable
cover seasonal variations for drought and flood years.
Document No. WMP.001 Version No. 1.5 Date 30/03/21 Page 15Livingstone Shire Council Drinking Water Quality Management Plan
Table 4 Risk matrix
Insignificant Minor Moderate Major Catastrophic
Almost Certain Medium 6 High 10 High 15 Extreme 20 Extreme 25
Likely Medium 5 Medium 8 High 12 High 16 Extreme 20
Possible Low 3 Medium 6 Medium 9 High 12 High 15
Unlikely Low 2 Low 4 Medium 6 Medium 8 High 10
Rare Low 1 Low 2 Low 3 Medium 5 Medium 6
Medium and low risks are considered acceptable from a public health perspective. The
rationale is that pathogen risks are acute and must retain major or catastrophic
consequences, and as a result, Medium reflects the achievable risk in well-managed
systems.
5.2 Risk Assessment Team
The hazard identification and risk assessment was reviewed and updated during a risk
workshop in May 2020 by a team consisting of:
Table 5 Risk assessment team
Years of experience Public Health Risk
Attendee Title in Livingstone/ Training /
Water Industry Experience
Coordinator Water & Involved in previous
Jon Edge Sewerage 12 / 21 2014 risk
Operations assessment
Formal training and
involved in previous
Michael Dalton Water Quality Officer 6 / 20
2014 risk
assessment
Involved in previous
Principal Process
John Massingham 6 / 20 2014 risk
Systems Technician
assessment
Risk assessment
Supervisor
training and
Barry Murton Treatment 21 / 35
significant
Operations
experience
Risk assessment
Manager Water and training and
Scott Casey* 1 / 30
Waste Operations significant
experience
Risk assessment
14 years in water training and
Sean Hinton Facilitator
industry significant
experience
Risk assessment
17 years in water training and
Michael Lawrence Co-facilitator
industry significant
experience
* attended and provided input and endorsement at a follow up briefing session on the significant risks and
proposed improvement actions.
Document No. WMP.001 Version No. 1.5 Date 30/03/21 Page 16Livingstone Shire Council Drinking Water Quality Management Plan 5.3 Hazard identification and Unmitigated Risk Assessment Biological, Chemical, Physical and Whole of System hazards have been identified, and the sources of hazards have been considered for all water supply schemes. Consideration is then given as to whether the hazard is equally relevant to all schemes. Separate line items are included where the sources of hazards have a different relevance to a particular scheme. Note: for the Caves and Nerimbera and Pipeline, the unmitigated risk is the risk for the source water for Livingstone Shire Council – in these cases, this is the treated water from Glenmore WTP. For each hazard, the unmitigated public health consequence, and the likelihood of the hazard causing that consequence in the absence of any preventative measures implemented by Livingstone Shire Council were evaluated. Using the risk matrix above, the unmitigated risk to the scheme was calculated. Where a hazard is considered as potentially relevant to the scheme (i.e. the unmitigated risk was medium or above), the preventative measures in place to manage the hazard have been identified, and the mitigated risk calculated by the methodology identified below. Mitigated risk assessments are included on a scheme by scheme basis in the following sections. Unmitigated risks that are considered low are not progressed through to the mitigated risk assessment. Where mitigated risks are unacceptable, risk management improvement items to manage the risk have been identified and prioritised. Document No. WMP.001 Version No. 1.5 Date 30/03/21 Page 17
Livingstone Shire Council Drinking Water Quality Management Plan
Table 6 Hazard Identification – all schemes
Unmitigated (Maximum) Risk
Hazard Sources of Hazard Uncertainty Comments Treatment Barrier/s
Consequence Likelihood Risk
Aluminium Overdose/underdose Minor Unlikely Low 4 Reliable Operational procedures
Bacteria/Virus New connections have backflow
Backflow, network contamination Catastrophic Unlikely High 10 Reliable
(Network) prevention
Managed by FRW (conventional
Bacteria/Virus Failure to disinfect, reservoir/
Catastrophic Rare Medium 6 Confident treatment, SCADA) - more WQ
(Glenmore) mains contamination
monitoring now
Bacteria/Virus Farming, weather event, mains
Catastrophic Possible High 15 Estimate Disinfection
(Marlborough) contamination
Risk is based on the broader
Sewage discharge, farming,
catchment, 1.2GL offstream
Bacteria/Virus recreational activities, weather
Catastrophic Likely Extreme 20 Reliable storage always used - likely to Off-stream storage, Disinfection
(Woodbury) event, reservoir/ mains
result in die-off. This is taken
contamination
into account with residual risk
New connections have backflow
Chemical Backflow Moderate Unlikely Medium 6 Reliable
prevention
0.8mg/L has been identified as a
Chlorate Chemical breakdown Moderate Possible Medium 9 Estimate required reporting limit by Chemical management
Queensland Health.
Chlorine Overdose Moderate Possible Medium 9 Reliable Operational procedures
Almost Tannins in Water Park Creek are Coagulation, Powdered
Colour Naturally occurring Minor High 10 Certain
Certain constant Activated Carbon
Cyanobacteria Managed by FRW (conventional
Breakthrough WTP Minor Unlikely Low 4 Confident
(Glenmore) treatment, SCADA)
Cyanobacteria Minimal runoff and elevated Kellys storage has had algal
Minor Likely Medium 8 Confident Filtration
(Woodbury) nutrients result in algal blooms blooms
Cyanobacterial Powdered Activated Carbon,
Algal blooms Major Possible High 12 Reliable
toxins (Woodbury) chlorine oxidation
Cyanobacterial Multiple years of treated water Powdered Activated Carbon,
Algal blooms Major Rare Medium 5 Reliable
toxins (Glenmore) data chlorine oxidation
Operational procedures,
Disinfection Elevated organics and long
Moderate Unlikely Medium 6 Confident flushing. RRC have installed a
byproducts detention times
chlorine dioxide system
Malfunction, power outage,
Failure of supply Major Unlikely Medium 8 Estimate Availability of spare parts
flood, fire
Fluoride Overdose Moderate Rare Low 3 Certain Removed from supply No longer used
Hardness/ TDS Almost TDS is aesthetic, not a public
Natural geology Minor High 10 Certain Reverse Osmosis
(Marlborough) Certain health risk
Document No. WMP.001 Version No. 1.5 Date 30/03/21 Page 18Livingstone Shire Council Drinking Water Quality Management Plan
Unmitigated (Maximum) Risk
Hazard Sources of Hazard Uncertainty Comments Treatment Barrier/s
Consequence Likelihood Risk
Hardness/ TDS TDS is aesthetic, not a public
Natural geology, mine releases Minor Rare Low 2 Certain Source control
(Woodbury) health risk
Hardness/ TDS TDS is aesthetic, not a public
Natural geology, mine releases Minor Unlikely Low 4 Certain Source control
(Glenmore) health risk
Mining activities, natural
Heavy metals Moderate Unlikely Medium 6 Reliable Source control, Coagulation
geology, cattle dips
Heavy metals Elevated TDS, but heavy metals
Natural geology Moderate Rare Low 3 Reliable Source control, Coagulation
(Marlborough) concentrations acceptable
Road runoff, spill, road
Hydrocarbons accidents, infiltration through Moderate Rare Low 3 Confident Selective abstraction
pipes
Depth sampling indicated
Source control, oxidation,
Iron Natural geology, sediment Minor Unlikely Low 4 Reliable stratification, offtake above that
flushing
level.
Manganese Natural geology, storage Not seen in over 20 years at Source control, oxidation,
Moderate Rare Low 3 Confident
(Woodbury) overturning Kellys. flushing
0.41mg/L measured in treated
Conventional treatment,
Manganese Natural geology, storage water at the time of TC Marcia -
Moderate Rare Low 3 Confident potentially changes made by
(Glenmore) overturning big issues in the system at the
Rockhampton (chlorine dioxide)
time (5 years ago)
In last 5 years have had one
critical incident arising from
Operator error Untrained/fatigued/accident Catastrophic Possible High 15 Reliable Trained staff, staff development
operator error combined with
hardware failure
Above ground pipe from
Opportunistic Temperature, mains
Rockhampton into Mt Charlton
Pathogen (Naeglaria contamination, inadequate Major Rare Medium 5 Estimate Disinfection
Res and stop/start flow -
fowlerii) disinfection residual
rechlorination afterward
Other chemical Treatment chemical Chemicals certified for use in
Moderate Rare Low 3 Reliable
contamination contamination drinking water
Stagnant water, long transport
Oxygen Minor Rare Low 2 Confident Nil
times
Pesticides No values above health
Agriculture, horticulture Minor Rare Low 2 Reliable PAC
(Glenmore) guideline
Pesticides Minimal agriculture in this
Agriculture, horticulture Minor Unlikely Low 4 Reliable PAC
(Woodbury) catchment
pH (high or low) Dosing failure, raw water quality Minor Possible Medium 6 Confident Operational procedures
Filter breakthrough > 1 NTU, Managed by FRW (conventional
Protozoa (Glenmore) Catastrophic Rare Medium 6 Certain
reservoir cont treatment, SCADA)
Document No. WMP.001 Version No. 1.5 Date 30/03/21 Page 19Livingstone Shire Council Drinking Water Quality Management Plan
Unmitigated (Maximum) Risk
Hazard Sources of Hazard Uncertainty Comments Treatment Barrier/s
Consequence Likelihood Risk
Protozoa (network) Network contamination Catastrophic Rare Medium 6 Certain
Infiltration into aquifer (natural
Protozoa Farming, weather event, mains
Catastrophic Unlikely High 10 Confident attenuation), 5 mM filters and
(Marlborough) contamination
RO treatment
Farming, recreational activities,
Testing has not detected Catchment management,
Protozoa Septic systems, weather event,
Catastrophic Likely Extreme 20 Reliable protozoa, but limited samples, Coagulation/Flocculation,
(Woodbury) reservoir/ mains contamination,
and probable sources Filtration
animals in catchment
Radioactive Historical data indicates this is
Natural geology Moderate Rare Low 3 Confident
elements not a significant hazard
Almost
Taste and odour Algae blooms Minor High 10 Certain PAC
Certain
Temperature Seasonal Insignificant Unlikely Low 2 Confident Nil
Has been an increase
(nuisance/vandalism) recently in Physical and cyber security
Terrorism /sabotage Various, including cybersecurity Catastrophic Unlikely High 10 Reliable
Rockhampton, but not targeting measures
water quality
Turbidity Storms, flooding Minor Likely Medium 8 Confident Coagulation, filtration
Reservoir sediment, sloughing in
Turbidity (network) Minor Likely Medium 8 Reliable Coagulation, filtration
pipes
Relevant hazards and unmitigated risks of medium and above that are identified in this table are carried forward to the scheme based
mitigated risk assessments.
Document No. WMP.001 Version No. 1.5 Date 30/03/21 Page 20Livingstone Shire Council Drinking Water Quality Management Plan 6 Operational and Verification Monitoring 6.1 Operational monitoring Livingstone Shire Council undertakes operational monitoring to confirm that the preventative measures are implemented and effective for each of the schemes. Operational monitoring includes daily testing at the Woodbury WTP, as well as all Supervisory Control and Data Acquisition (SCADA) monitored processes, and site inspections of bores and reservoirs. The operational monitoring details are stated individually in the scheme specific sections. Typically, a large proportion of the operational monitoring is managed using SCADA, although some water quality testing at the WTP is also considered to be operational. SCADA limits are set up with a target level and target range. Alarms occur when the parameter is outside the target range, and operators will take necessary actions to bring the process within the target range. Alarms are set to allow an operator to correct any issue rapidly, and before the issue escalates. Within the context of the management plan, the typical target ranges are indicated; however, as these operational limits necessarily change (e.g. coagulant dose rates) these values should not be considered fixed, so as to allow operational flexibility. The critical SCADA limits for ensuring risks are managed are the outer acceptable limits (e.g. the high-high and low-low SCADA alarms). These limits do not change due to operational changes. These limits are stated in the DWQMP. Many of the high-high and low-low critical alarms result in WTP shutdown to prevent poor quality water reaching the consumers. All “shut down” limits are included in the DWQMP. Where plant shut-down occurs, an operator identifies and corrects the cause of the issue before restarting the WTP. The focus of online monitoring and automatic shutdowns is on chlorine and turbidity, in recognition of guiding principle 1 of the Australian Drinking Water Guidelines 2011 (NHMRC) “the greatest risks to consumers of drinking water are pathogenic microorganisms”. By focusing on filtration and disinfection effectiveness, LSC is managing the risk of pathogenic microorganisms. 6.1.1 Operational Procedures Livingstone Shire Council continues to develop further work instructions and operational procedures. These are outlined in the ongoing Risk Management Improvement Program (RMIP). A list of existing operational documentation including work instructions, plans, procedures, guides and attachments has been provided in Appendix B. 6.2 Verification monitoring: Verification monitoring is undertaken to demonstrate that the water quality produced was acceptable. This monitoring is “after the fact” testing and while corrective actions can be taken based on the results, drinking water has been delivered to customers prior to this sampling being undertaken. Livingstone Shire Council has installed specific locked water sampling points that facilitate sample tap flaming and collection of representative samples. Sampling locations are listed in Table 7 below. Sample locations were selected to be representative of the water quality in each zone, and include higher risk locations (either on the basis of historical issues, population at risk, or longer water ages). Document No. WMP.001 Version No. 1.5 Date 30/03/21 Page 21
Livingstone Shire Council                          Drinking Water Quality Management Plan

Most verification monitoring samples are sent to external laboratories for analysis. The
Water Quality Officer reviews the results immediately upon receipt, and the incident and
emergency response plan is activated if any parameters are above the water quality criteria.

Table 7        Verification monitoring sample sites

                                    Site                                             Monitoring
 Scheme         Reservoir Zone                           Location
                                    Code                                             Frequency
                                    SF1                   Anzac Pde
                                    SF2    Pacific Heights Rd(St Benedict’s Sch)
              Yeppoon Meikleville   SF3         Arthur St (St Ursula College)
                                    SF4    Adelaide Park Rd (St Faiths Reservoir)
                                    SF5               Rockhampton Rd
                                                                                    Sites rotated –
                                    TB1    Matthew Flinders Dr (Cooee Bay Pool)
                  Taranganbah                                                       one per week
                                    TB2        Poinciana Ave (Poinciana Park)
                                    LM1      Scenic Hwy (Lammermoor Beach)
                                    LM2     Vin E Jone Memorial Dr (Roslyn Bay)
                  Lammermoor
Capricorn                           LM3           Scenic Hwy (Causeway)
Coast                               LM4              Scenic Hwy (Kinka)
                                    EP1            Pattison St (Police Stn)
                   Emu Park         EP2            Haven Rd (Tanby Point)
                                                                                    Sites rotated –
                                    EP3             Svendsen Rd (Zilzie)
                                                                                    one per week
                                    KS1        Schofield Pde North (Musa Dr)
                 Keppel Sands
                                    KS2             Schofield Pde South
                                    YP0         Yeppoon West Valve Facility
                                    YP1                    Sawmill                  Sites rotated –
                Yeppoon Pipeline                                                        one per
                                    YP2                  Dairy Inn Rd                  fortnight
                                    YP3     Boundary Reservoir (Iron Pot Road)
                                    ML1      Magog Road (Marlborough School)        Sites rotated –
Marlborough       Marlborough
                                    ML2      Railway Street (Marlborough Park)      one per month
                                    MC1        Rossmoya Rd (The Caves Pub)
                                    MC2                  Glendale Rd                Sites rotated –
               The Caves (Mount                                                     one per month
                                    MC3        Bruce Hwy (Etna Creek Prison)
                   Charlton)
Nerimbera &                         MC4             Emerson Dr (Glenlee)
 The Caves                          MC5           Mount Charlton Reservoir             Weekly
                                    NR1                  Lakes Ck Rd
                                                                                    Sites rotated –
                   Nerimbera        NR2               Nerimbera School
                                                                                    one per month
                                    NR3                    Abattoir

6.2.1   Escherichia coli monitoring schedule
E. coli is monitored at a frequency that meets the Public Health Regulation requirement for
the population served. Each scheme has been considered separately, and meets the Public
Health Regulation in its own right.
As previously noted, dedicated sample points have been installed at locations throughout
each water supply scheme. Sample locations are rotated according to an operational
schedule that is updated annually. Sample locations were selected as they are

Document No. WMP.001 Version No. 1.5 Date 30/03/21                                           Page 22
Livingstone Shire Council Drinking Water Quality Management Plan representative of the water supplied to Council’s customers, but also samples areas that may be subject to specific water quality concerns (for example, the Correctional Centre, which can experience low residual chlorine concentrations). When E. coli samples are collected, a field test of the free chlorine is undertaken, and a second water sample collected for analysis of pH, colour, turbidity and conductivity at the Livingstone Shire Council laboratory. Samples are sent away for analysis at an external NATA accredited laboratory (currently ALS). The sampling schedule is as per the Monitoring Frequency column in Table 7. The specific rotation schedule is updated annually to identify the specific sampling weeks for the next calendar year. An appropriate number of samples will be collected to meet the minimum PHR requirements, and samples rotated through the sampling sites. Additional samples will be taken if the Water Quality Officer is concerned about the water quality at any particular location. This may be in response to customer complaints, or identification of low chlorine residuals. 6.2.2 Other Monitoring Parameters Other water quality parameters are tested either monthly, 3 monthly or annually. Samples are sent away for analysis at an external NATA accredited laboratory (currently ALS). The chosen parameters reflect the hazards and risks for the water supply schemes. Parameters include: Standard Water Analysis – Monthly, Woodbury and Marlborough, raw and potable water. This includes the following parameters: Alkalinity, chloride, colour, EC, nitrate, sulphate, fluoride, aluminium, copper, iron, lead, manganese, zinc, calcium, magnesium, potassium, sodium, pH, TDS , total hardness, and turbidity. These parameters provide a background water quality profile predominantly to verify that water quality meets aesthetic guidelines, and on this basis, a monthly frequency is believed to be sufficient. Blue Green Algae – Risk based, typically monthly in summer, Woodbury raw water. Algae monitoring can assist in making operational decisions, however in practice, powdered activated carbon is dosed year round to manage taste and odour concerns, and the conventional treatment process (coagulation, sedimentation, filtration and chlorination) is sufficient to remove or inactivate both algal cells and toxins. Total Organic Carbon – 3 monthly, Woodbury and Marlborough, raw and potable water. TOC data provides background data on the potential for disinfection by-product formation, but also raw water quality more generally. Pesticides – Annually, Woodbury and Marlborough raw water. With no detections in any scheme to date, annual monitoring for pesticides is believed to be appropriate. Cryptosporidium and Giardia – Annually, Woodbury WTP, raw and potable water. Monitoring for these pathogens is undertaken annually to gradually build a dataset, noting the high cost and relatively poor enumeration performance of the test method (particularly for Cryptosporidium). Trihalomethanes & chlorate – 3 monthly, Woodbury and Marlborough reticulated water supply. Sample locations SF2, KS2, MC1, NR3 & ML1 (e.g. locations considered to be the highest risk). Quarterly is considered to be appropriate for the verification of THM and chlorate levels in drinking water, and no exceedances of the water quality criteria have been identified in the data summarised in this DWQMP. Document No. WMP.001 Version No. 1.5 Date 30/03/21 Page 23
Livingstone Shire Council                         Drinking Water Quality Management Plan

Heavy metals – Annually, Woodbury and Marlborough, raw and potable water. Annual
monitoring is deemed to be appropriate for heavy metals given the very low likelihood of
their occurrence in drinking water.
This includes the following parameters:
Arsenic, cadmium, chromium, nickel, selenium, mercury
Raw and potable water samples are taken at the water treatment plants. This level of
monitoring, and the selection of parameters is considered to be sufficient for these schemes
given the limited number of water quality incidents detected by Livingstone Shire Council,
the mostly protected nature of the Water Park Creek catchment, and the limited likely risks to
the quality of the Marlborough aquifer. If additional hazards to the schemes are identified,
other parameters may be added to the monitoring schedule.
Livingstone Shire Council undertook radiological testing of the water supplies in 2014, but as
all results are below detection limit, further testing is considered unnecessary.
Under the bulk water agreement, Fitzroy River Water (FRW) provides monthly physical and
chemical water quality monitoring data for the Glenmore WTP raw and treated.

Document No. WMP.001 Version No. 1.5 Date 30/03/21                                      Page 24
Livingstone Shire Council Drinking Water Quality Management Plan
7 Emergency Response Plan
Livingstone Shire Council operates on a 3 level Emergency Response Plan. The levels are
outlined below:
Table 8 Emergency Response Levels
Response Communication and
Description of Level Typically Identified by
Level Response Management
Manager Water and
Level 3 CEO
Declared Disaster Waste Operations or
Disaster External Agencies
CEO
Potential public
health risk, WTP Operators or
exceedance of water Coordinator Water Manager Water and
Level 2
quality criteria, and Sewerage Waste Operations
Incident or
major loss of supply Process Operations potential CEO
Emergency
(e.g. widespread loss or Regulatory reporting.
for > 6 hours) Water Quality Officer
cybersecurity threat
Operational
Coordinator Water
exceedances,
Level 1 and Sewerage
minor loss of supply, WTP Operators or
Operational Process Operations
other issue not Water Quality Officer
Action and/or
considered to be a
Water Quality Officer
potential health risk
7.1 Detail of Incidents and Response Levels:
7.1.1 Level 1 Operational Action
At Level 1, operational actions are required to manage the issue and prevent escalation.
Issues at this level are normally identified through operational monitoring. In many cases,
SCADA alerts will provide the first indication of a problem.
Corrective actions will be taken to ensure processes are brought back to target levels, a note
made in WTP diary (WTP exceedances) and the Coordinator Water and Sewerage Process
Operations informed. Where the issue is identified by the Water Quality Officer, the issue
and corrective actions are recorded in their diary (e.g. flushing of dirty water from
reticulation).
Note: Exceedances of upper and lower alarms that result in WTP shutdown are considered
to be within the scope of normal operation of the management plan, and do not automatically
escalate beyond Level 1 unless the situation warrants. For example, a high-high chlorine
alarm that shuts down the treatment plant before the chlorine level exceeds the water
quality criteria is dealt with as a Level 1 action. If the water quality criteria are exceeded, or a
widespread outage is for an extended period, the issue is a Level 2 incident.
Document No. WMP.001 Version No. 1.5 Date 30/03/21 Page 25Livingstone Shire Council Drinking Water Quality Management Plan 7.1.2 Level 2 Incident or Emergency At Level 2, there is a potential for an adverse public health impact. These issues are typically identified through either operational or verification monitoring of the processes and water quality, or where there has been a significant widespread treatment or reticulation network failure resulting in the loss (or likely loss) of water supply for a period >6 hours. Alternatively, ICT Services or the Process Systems Technician may identify a cyber security breach or threat. When identified, these issues are escalated to the Coordinator Water and Sewerage Process Operations, or alternatively the Water Quality Officer and/or Manager of Water and Waste Operations if the Coordinator Water and Sewerage Process Operations is not available. Appropriate corrective actions will be identified, and implemented as soon as practicable to minimise the effect of the incident. Examples for typical actions that we will normally take for the detection of a parameter above the water quality criteria (including E. coli, and chlorate >0.8mg/L) follow. For cyber threats, ICT Services will take a key role in the incident management process. Level 2 incidents and emergencies are reportable to the Regulator. The Water Quality Officer or Manager Water and Waste Operations will inform the Regulator within 3 hours of becoming aware of the incident (3 hours allows sufficient time to investigate the cause of the incident and commence corrective actions as soon as possible). Advice may be directly sought from Queensland Health if required. Resampling: Where a water quality criterion has been exceeded, Livingstone Shire Council always assumes that the failure is real and will respond as such. Due to the assumption that the failure is real, the resample is collected after any immediate corrective actions have been completed (e.g. after re-establishing disinfection or after flushing). By resampling after the corrective actions have commenced, sampling costs are lowered and the resample results help quantify the effectiveness of the corrective actions that have been taken to date. Council will contact high risk customers, as identified in Appendix A by appropriate means (letter drop, phone call, personal visit) if required. 7.1.3 Level 3 Declared Disaster This level is reached when the Chief Executive Officer (CEO) of Council activates the Disaster Management Plan or a Disaster is declared by the State Government. When a Disaster Management Group is stood up, drinking water quality management actions will be taken as necessary to respond to the requirements of the Disaster Coordinator. While every effort will be made to continue to implement the Drinking Water Quality Management Plan, Disaster Management actions may take precedence. Where this occurs, Livingstone Shire Council will inform the Regulator as soon as practicable. This may be some time after the normal 3 hour response time. Scenarios where this may occur include major events such as imminent cyclones, bushfires and floods. At such times, communications can be difficult, and actions may be required to immediately reduce threats to human life. Actions that contradict the DWQMP would not normally be taken, except under advice from appropriate and relevant authorities. Document No. WMP.001 Version No. 1.5 Date 30/03/21 Page 26
You can also read