Drive Shack Investor Presentation - Second Quarter 2019 - Drive Shack Inc.
←
→
Page content transcription
If your browser does not render page correctly, please read the page content below
Drive Shack Investor Presentation
Second Quarter 2019
Disclaimers
IN GENERAL. This disclaimer applies to this document and the verbal or written comments of any person presenting it. This document, taken together with any such
verbal or written comments, is referred to herein as the “Presentation.”

FORWARD-LOOKING STATEMENTS. Certain items in this Presentation may constitute forward looking statements within the meaning of the Private Securities
Litigation Reform Act of 1995, including, but not limited to, statements regarding Drive Shack Inc.’s (NYSE: DS; “DS Inc.” or the “Company” and “we,” “us” and “our,” as
applicable) (a) statements relating to returns on our investments, (b) anticipated future sales of our owned golf courses, including statements relating to the timing and
amount of anticipated proceeds, (c) our growth, cyclicality, margins and other projections relating to our results and our industry, plans and expectations to optimize the
operation of, and grow, our existing leased and managed golf courses, (d) redeployment of cash from our generated liquidity, (e) targeted multiples, yields and returns,
(f) our ability to terminate or restructure leases and (g) the Company’s current business plan and expectations relating to our Drive Shack sites, including (i) the number
of venues that we may be able to develop, (ii) timing and frequency for opening venues, (iii) financial performance of these venues and capital expenditure costs, (iv)
the growth of the golf, golf entertainment, and eatertainment industry and business, and (v) our ability to enhance and integreate technology. These statements are
based on management's current expectations and beliefs and are subject to a number of risks, trends and uncertainties that could cause actual results to differ
materially from those described in the forward-looking statements, many of which are beyond our control. We cannot give any assurances that management’s current
expectations will be attained. For a discussion of some of the risks and important factors that could cause actual results to differ materially from such forward-looking
statements, see the sections entitled “Risk Factors” and “Management’s Discussion and Analysis of Financial Condition and Results of Operations” in the Company’s
periodic reports filed with the Securities and Exchange Commission (“SEC”), which are available on the Company’s website (www.http://ir.driveshack.com). In addition,
new risks and uncertainties emerge from time to time, and it is not possible to predict or assess the impact of every factor that may cause actual results to differ from
those contained in any forward-looking statements. Accordingly, you should not place undue reliance on any forward-looking statements contained in this Presentation.
Forward-looking statements speak only as of the date of this Presentation. We expressly disclaim any obligation to release publicly any updates or revisions to any
forward-looking statements contained herein to reflect any change in expectations with regard thereto or change in events, conditions or circumstances on which any
statement is based.

PAST PERFORMANCE; NO OFFER; NO RELIANCE. Past performance is not a reliable indicator of future results and should not be relied upon as the basis for
making an investment decision. This Presentation does not constitute an offer to sell, or a solicitation of an offer to buy, any security. Any such offer would only be made
by means of formal offering documents, the terms of which would govern in all respects. You should not rely on this Presentation as the basis upon which to make any
investment decision.

The Company has not reconciled its EBITDA expectations set forth in this presentation to net income (loss), as items that impact such measures are out of the
Company’s control and/or cannot be reasonably predicted. Accordingly, a reconciliation is not available without unreasonable effort.

NON-GAAP FINANCIAL INFORMATION. This Presentation may include information based on financial measures that are not recognized under generally accepted
accounting principles (“GAAP”), including EBITDA margin. You should use non-GAAP information in addition to, and not as an alternative to, financial information
prepared in accordance with GAAP, which is included in the Company’s filings with the SEC.

CAUTIONARY NOTE REGARDING ESTIMATED / TARGETED RETURNS AND GROWTH. Targeted returns and growth represent management’s view and are
estimated based on current and projected future operating performance of our location in Orlando and other targeted locations, comparable companies in our industry
and a variety of other assumptions, many of which are beyond our control, that could prove incorrect. As a result, actual results may vary materially with changes in our
liquidity or ability to obtain financing, changes in market conditions and additional factors described in our reports filed with the SEC, which we encourage you to review.
We undertake no obligation to update these estimates. See above for more information on forward-looking statements.

                                                                                                                                                                               1
Drive Shack – Second Quarter Highlights

                                                 ▪ In the next 3 months, opening 3 new venues in Raleigh, Richmond, and West Palm Beach
   Generation 2.0
                                                              ▪ Will feature new tech, enhanced gaming and updated F&B offerings
 Venues Open Soon
                                                 ▪ Retrofit Orlando with improvements made in new venues; continue use as beta site

                                                 ▪ Refined our focus on product adjacencies – along with DS 2.0 enhancements, focused on:
  Innovation Across                                          ▪ Mid-Size (72 bays) – for smaller markets
 Product Adjacencies                                         ▪ Urban Box (indoor, small format) – for dense urban markets
                                                 ▪ Expertise applied to smaller stores that will expand the store potential by 150+ markets

  Golf Course Sales                              ▪ Closed 4 courses for $20M of gross proceeds in Q2; to date, total proceeds of ~$140M
      Progress                                   ▪ Expect additional ~$35M across 4 courses by year end 2019

                                                ▪ Hana Khouri appointed to serve as Drive Shack’s President
 Newest Member of
                                                ▪ Previously served as National and International Director of Operations at Topgolf
 Leadership Team
                                                ▪ Hana has opened over 20+ entertainment golf venues globally

          Based on management’s current views and estimates. See “Disclaimers” at the beginning of this Presentation for more information on forward-looking statements.
                                                                                                                                                                           2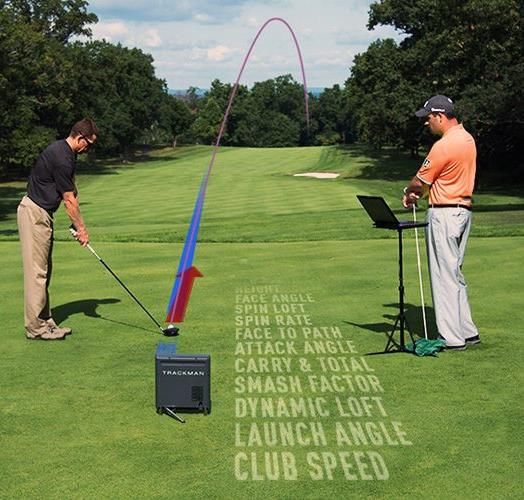
Drive Shack Today
▪ Transformation from traditional golf course owner and operator to an “eatertainment” golf
  operating company is nearly complete

                                                                   Drive Shack Inc. Portfolio Mix

                                                                                                         YE 2018                 YE 2019                 YE 2020

                                    American Golf

                                        Owned Courses                                                          13                      2                        1

                                        Leased Courses(1)                                                      36                     36                      37

                                        Managed Courses                                                        17                     22                     22+

                                    Drive Shack

                                        Operating Venues(2)                                                     1                      4                   7 to 9

                                        Development Pipeline                                                    6                     10                      15

           Based on management’s current views and estimates. See “Disclaimers” at the beginning of this Presentation for more information on forward-looking statements.
           1)    Addition represents Randall’s Island license to be operated under AGC prior to Drive Shack venue construction.
           2)    2019 Operating Venues include Raleigh, Richmond, and West Palm, opening in August, September, and October, respectively.
                                                                                                                                                                            3
Development – High Quality Locations in Growing Pipeline
▪ New Openings – Raleigh, Richmond, and West Palm Beach to open in 2019

▪ Development – Expect to open an additional 3 – 5 new sites in 2020
     ▪ 7 announced sites currently in development – expected to open or break ground across 2020 and 2021

▪ Active Pipeline – 30 sites identified, analyzing economics and negotiating initial terms

                                                                             MINNEAPOLIS, MN
          PORTLAND, OR                                                                                                             CHICAGO, IL

                                                                                                                                                                              MANHATTAN, NY

                                                                                                                                                                        RICHMOND, VA
                                                                                                                                                                         Opening Soon

                                                                                                                                                                RALEIGH, NC
                                                                                                                                                                Opening Soon

             NEWPORT BEACH, CA
                                                                                                                                                             ORLANDO, FL
                                                                                                                                                              Open Now

                                 Open by YE 2019

                                  In Development                                                          NEW ORLEANS, LA                                            WEST PALM BEACH, FL
                                                                                                                                                                         Opening Soon
                                                                                HOUSTON, TX

            Based on management’s current views and estimates. See “Disclaimers” at the beginning of this Presentation for more informati on on forward-looking statements.
                                                                                                                                                                                              4
Drive Shack 2.0
▪ Next generation features new tech, enhanced gaming and updated F&B offerings
▪ Exclusive TrackmanTM ball tracking technology integrated in new sites
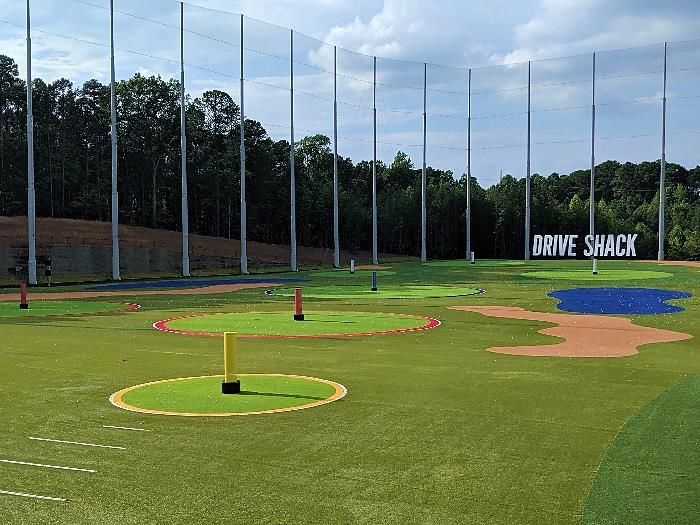
▪ Redesigned outfield to further interactive gaming capabilities
▪ Complements gaming platform that has capabilities to consistently refresh, update, and roll out new games
▪ New food and beverage menu featuring seasonal and local offerings
▪ Used Orlando as beta site to identify series of key changes for new sites
TrackmanTM Integration & Range Redesign Updated F&B Menu
Based on management’s current views and estimates. See “Disclaimers” at the beginning of this Presentation for more informati on on forward-looking statements.
5
Innovation is the Key to Long Term Success
▪ Started with Full-Size Drive Shack stores in major metropolitan markets
     ▪ Over the next 3 months we will open 3 Full-Size venues

▪ 2 major initiatives that we are pursuing
     1.   Mid-Size Venue– 72-bay store designed for smaller markets with population of ~500K people
     2.   Urban Box – Indoor, small-format store designed for dense urban locations

▪ New initiatives retain key elements of large format venues – Golf + F&B + Dynamic Technology

                                                                           Store Potential in U.S.
                               Operating Stores
                                                                                                                       100+                              175 – 200+
                               Announced Stores

                                                                                                                                                                              New formats
                                                                                                                                                                              expand store
                                                                            50 - 75                                                                                           potential by
                                                                                                                                                                              150+ markets

                                       ~25

                                   Big Box
                                  Full-Size                                   Lite
                                                                            Mid-Size                               Urban Box
                                                                                                                  Urban   Box                                 Total
                                                                                                                                                               TotalUS

                                    +90-Bay                                    72-Bay                               Small Store                           US Stores

            Based on management’s current views and estimates. See “Disclaimers” at the beginning of this Presentation for more informati on on forward-looking statements.
                                                                                                                                                                                             6
Target Unit Economics & Site Additions
Drive Shack Unit Economics
  ▪ Target site-level EBITDA margins of ~25-30% with 20+ stores open by 2022

  ▪ Aim to open first Mid-Size venue and Urban Box in 2020

                                  Target Unit Economics

                                              Full-Size                  Mid-Size                 Urban Box
  $ in millions                                                                                                                                                     Target Site Additions
                                               90-Bay                     72-Bay                  Small Store
                                                                                                                                                                          2019      2020   2021     2022

  Size (sq. ft.)                               ~60K+                        ~50K                       ~20K                                      New Sites                   3      3–5    5 – 10   5 – 10
                                                                                                                                                 Full-Size                   3       -       1        2

  Cost to Build(1)                               ~$35                       ~$25                     $5 - $8                                     Mid-Size                    -      2-3    1–4      0–3
                                                                                                                                                 Urban Box                   -      1–2    3–5      3–5

  Total Revenue                             $20 - $25                   $15 - $20                    $7 - $9

  EBITDA Margin(2)                              ~25%                       ~25%                    ~27-30%

                  Based on management’s current views and estimates. See “Disclaimers” at the beginning of this Presentation for more informati on on forward-looking statements.
                  1) Average build cost target is inclusive of all construction costs, soft costs, start-up and expenses, if applicable.
                  2) There can be no assurance that we will achieve Target Site EBITDA margin and actual results may differ materially.
                                                                                                                                                                                                             7
Orlando – Second Quarter Results
▪ Orlando TTM results –
▪ Revenue of ~$6.3M, Total Visitors of ~160K, Spend per Visitor of ~$40
▪ To date largest portion of revenue accounted for by food & beverage
▪ Will retrofit Orlando with 2.0 enhancements, including TrackmanTM technology and range redesign
▪ Expect new technology to extend length of visit resulting in an uplift in Spend per Visitor
▪ New brand strategy emphasizing entertainment – aim to be top social “eatertainment” experience
Brand Shift from Golf to Entertainment Revenue to Date(1)
F&B BayPlay
38% 29%
Other
Events 2%
31%
Based on management’s current views and estimates. See “Disclaimers” at the beginning of this Presentation for more informati on on forward-looking statements.
1) To date as of August 6, 2019.
8Traditional Golf Portfolio Update(1)
▪ To date 20 courses sold for ~$140M; expect additional ~$35M from 4 courses by year end
▪ Additional long term course sales from 2 courses with estimated value of ~$45M to $65M
▪ Leveraging scalable platform to add higher-margin management contracts
▪ Successfully added 11 new management contracts since for ~$2M of annual cash flow(2)
▪ Expect annual revenue of ~$175M and course-level EBITDA margin of ~15-20% by 2020
American Golf Portfolio Mix by 2019
YE 2018 YE 2019
# of Properties # of Properties
Owned 13 Monetize 2
Leased 36 Maintain 36
Optimized portfolio to generate:
Managed 17 Multiply 22
✓ Annual revenue of $175M
Total 66 61+ ✓ Course EBITDA margins of ~15-20%
Based on management’s current views and estimates. See “Disclaimers” at the beginning of this Presentation for more informati on on forward-looking statements.
1) To date as of August 6th, 2019.
2) Added 11 new management contracts since December 2018.
9Financial Appendix
10Second Quarter 2019 Financial Results
▪ GAAP Loss of $14 million, or $0.21/share vs. GAAP Loss of $0.09/share in 2Q 2018
Financial Results
2Q 2019 2Q 2018
($ in millions) (basic share) ($ in millions) (basic share)
GAAP Loss ($14) ($0.21) ($6) ($0.09)
Note: Per share represents per weighted average basic share unless otherwise noted. All per share amounts are represented on a weighted average basis.
11Consolidated Statement of Operations
($ in thousands, expect per share data)
3 months ended 3 months ended 6 months ended 6 months ended
Statement of Operations
30-Jun-19 30-Jun-18 30-Jun-19 30-Jun-18
Revenues:
Golf operations $57,386 $69,150 $102,092 $122,704
Sales of food and beverages 14,229 21,854 23,475 34,960
Total revenues $71,615 $91,004 $125,567 $157,664
Operating costs:
Operating expenses 58,720 67,042 106,443 124,421
Cost of sales – food and beverages 3,904 6,193 6,601 10,233
General and administrative expense 13,607 10,268 25,226 19,462
Depreciation and amortization 5,122 4,315 10,046 9,863
Pre-opening costs 1,700 247 2,879 1,803
Impairment 118 - 4,206 1,473
Realized and unrealized (gain) loss on
- (89) - (331)
investments
Total operating costs $83,171 $87,976 $155,401 $166,924
Operating (Loss) Income ($11,556) $3,028 ($29,834) ($9,260)
Other income (expenses):
Interest and investment income 265 469 608 915
Interest expense, net (1,795) (4,601) (3,947) (8,650)
Other income (loss), net 127 (3,699) 5,614 (4,105)
Total other income (expenses) ($1,403) ($7,831) $2,275 ($11,840)
Loss before income tax ($12,959) ($4,803) ($27,559) ($21,100)
Income tax expense - - -
-
Net loss ($12,959) ($4,803) ($27,559) ($21,100)
Preferred dividends (1,395) (1,395) (2,790) (2,790)
Loss Applicable to Common Stockholders ($14,354) ($6,198) ($30,349) ($23,890)
Per WA Basic Share ($0.21) ($0.09) ($0.45) ($0.36)
12Consolidated Balance Sheet
($ in thousands)
Assets As of 6/30/2019 As of 12/31/2018
Current Assets:
Cash and cash equivalents $39,683 $79,235
Restricted cash 4,299 3,326
Accounts receivable, net 6,341 7,518
Real estate assets, held-for-sale, net 33,355 75,862
Real estate securities, available-for-sale 3,071 2,953
Other current assets 20,471 20,505
Total Current Assets 107,220 189,399
Restricted cash, noncurrent 258 258
Property and equipment, net of accumulated depreciation 177,619 132,605
Operating lease right-of-use assets 225,666 --
Intangibles, net of accumulated amortization 20,115 48,388
Other investments 23,300 22,613
Other assets 4,897 8,684
Total Assets $559,075 $401,947
Liabilities
Current Liabilities:
Obligations under finance leases 7,675 5,489
Membership deposit liabilities 8,793 8,861
Accounts payable and accrued expenses 41,375 45,284
Deferred revenue 10,905 18,793
Real estate liabilities, held-for-sale 33 2,947
Other current liabilities 28,075 22,285
Total Current Liabilities 96,856 103,659
Credit facilities and obligations under finance leases - noncurrent 15,433 10,489
Operating lease liabilities - noncurrent 195,347 --
Junior subordinated notes payable 51,196 51,200
Membership deposit liabilities, noncurrent 94,156 90,684
Deferred revenue, noncurrent 5,930 6,016
Other liabilities 3,035 5,232
Total Liabilities $461,953 $267,280
Stockholders' Equity
Preferred Stock 61,583 61,583
Common Equity 35,539 73,084
Total Stockholders' Equity $97,122 $134,667
Total Liabilities & Stockholders' Equity $559,075 $401,947
13You can also read