Drivers of Deforestation and Forest Degradation in Kilwa District - MMppiinnggoo CCoonnsseerrvvaattiioonn && DDeevveellooppmmeenntt ...
←
→
Page content transcription
If your browser does not render page correctly, please read the page content below
Mpingo Conservation & Development Initiative

   Drivers of Deforestation and Forest
      Degradation in Kilwa District

                     April 2012

            Miya M, Ball SMJ & Nelson FD
Drivers of Deforestation in Kilwa
CONTENTS
List of tables........................................................................................................................................ 3
List of Figures ..................................................................................................................................... 3
Acronyms Used ................................................................................................................................... 4
1 Background ..................................................................................................................................... 5
1.1 Lindi Region ........................................................................................................................... 5
1.2 Kilwa District .......................................................................................................................... 5
2 Deforestation and Forest Degradation in Kilwa District ................................................................. 7
2.1 Agriculture .............................................................................................................................. 7
2.2 Charcoal production and fuelwood requirement ................................................................... 10
2.3 Logging activities and timber trade ...................................................................................... 12
2.4 Fires....................................................................................................................................... 14
2.5 Wildlife ................................................................................................................................. 16
3 Survey to Determine the Drivers Of in Kilwa District ................................................................. 17
3.1 Methodology ......................................................................................................................... 17
3.2 Study area.............................................................................................................................. 17
3.3 Data collection and analysis .................................................................................................. 18
3.4 Results and Discussions ........................................................................................................ 18
4 Quantifying Drivers of Deforestation in Kilwa District ............................................................... 25
4.1 Agriculture ............................................................................................................................ 25
4.2 Charcoal ................................................................................................................................ 26
4.3 Timber Harvesting ................................................................................................................ 27
4.4 Fire ........................................................................................................................................ 27
4.5 Summary ............................................................................................................................... 28
4.6 Anticipated Losses in Community Forests ........................................................................... 29
5 Conclusions & Recommendations ................................................................................................ 30
5.1 Conclusions ........................................................................................................................... 30
5.2 Commoditising Carbon Losses ............................................................................................. 30
6 References ..................................................................................................................................... 32
-2-Drivers of Deforestation in Kilwa
List of tables
Table 1: Area under cultivation in Kilwa District................................................................................... 8
Table 2: Data on legal charcoal production in Kilwa District. ............................................................. 12
Table 3: Total volumes of timber (m3) issued on harvest licences from the study area, 2003.............. 12
Table 4: Volumes (m3) of timber products specified on transit passes, January-October 2004. .......... 12
Table 5: Timber export from Tanzania, July 2005 to January 2006. .................................................... 13
Table 6: Timber harvesting data from Kilwa District during various licensing periods, 2006-2010. .. 14
Table 7: Changes in above-ground biomass resulting from different fire return intervals. .................. 16
Table 8: Number of respondents in each focus group from the villages surveyed. .............................. 18
Table 9: Village population and number of households. ...................................................................... 19
Table 10: Average area under cultivation and average yield of crops per acre. ................................... 19
Table 11: Projected area under shifting cultivation in the villages surveyed........................................ 20
Table 12: Tree species most preferred for charcoal. ............................................................................. 22
Table 13: Some of most preferred and most harvested timber species in the villages surveyed. ......... 23
Table 14: Estimates of total carbon loss through expansion of cultivated land and shifting cultivation
in Kilwa District.................................................................................................................................... 25
Table 15: Estimates of total and per hectare carbon loss from charcoal production in Kilwa District. 26
Table 16: Estimates of total carbon loss from timber harvesting in Kilwa District. ............................. 27
Table 17: Estimates of total annual carbon loss to fire in Kilwa District. ............................................ 28
Table 18: Estimated annual total carbon losses, and losses per hectare, from the four main drivers of
forest carbon loss through deforestation and degradation in Kilwa District. ........................................ 28
List of Figures
Figure 1: Fire frequency in Kilwa District, from MODIS fire monitoring data. .................................. 15
Figure 2: Population increase from 2002 to 2010 in the surveyed villages. ......................................... 21
-3-Drivers of Deforestation in Kilwa
Acronyms Used
asl = above sea level
DADPs = District Agriculture Development Plans
DALDO =District Agriculture and Livestock Development Officer
FBD = Forest and Beekeeping Division
MACEMP = Marine and Coastal Environmental Management Programme, a World Bank sponsored
project operating in Kilwa District
MCDI = Mpingo Conservation and Development Initiative
PFM = Participatory Forest Management
REDD = Reduction of Emission through Deforestation and Forest degradation
TRAFFIC = Trade in Flora and Fauna in International Commerce, the wildlife trade monitoring
network
UNFCCC = United Nations Framework Convention for Climate Change
VEO = Village Executive Officer
VLFR = Village Land Forest Reserve
WWF = World Wide Fund for Nature
-4-Drivers of Deforestation in Kilwa
1 BACKGROUND
1.1 Lindi Region
Lindi Region is located in the southeast part of Tanzania. The region is bordered by the Indian Ocean
(east), Coast Region (north), Morogoro and Ruvuma Regions to the west and Mtwara Region in the
south. The region is the fourth largest in the country with an area of 67,000km2, of which 18,000km2
lie within the confines of the Selous Game Reserve. The region is endowed with abundant forest and
timber resources, estimated at roughly 3.75 million ha of forest and woodland.
According to the population census of 2002 the population of Lindi Region is 791,306. Some 90% of
the population makes a living from subsistence agriculture and are dependent on the region’s forests
to some degree. The region is sparsely populated and one of the poorest parts of the country.
In recent years the Tanzanian government and its donors have made efforts to improve development
prospects in the region with investments in infrastructure, and to attract investors in various sectors
such as agriculture and forestry. However, these efforts have led to serious environmental and socio-
economic tradeoffs such as a surge in uncontrolled logging and timber trade activities after the
completion of the Mkapa Bridge (Milledge et al. 2007).
Lindi Region has become increasingly important as a primary revenue source for central government,
with Rufiji, Kilwa and Liwale Districts among the top four forest product revenue earners in the
country during 2003/2004. However, forest inventories conducted in 2005 concluded that most forests
in southern Tanzania “are degraded” or “heavily degraded”, whilst rates of revenue loss from
irregular timber trade were amongst the highest in the country (Milledge et al. 2007, Malimbwi et al.
2005a,c,d,e).
1.2 Kilwa District
1.2.1 Population and Socio-economic status
Kilwa District is the most northerly district in Lindi Region. To the east of the district is the Indian
Ocean, to the west are Liwale District and the Selous Game Reserve, to the north is Rufiji District and
south is Lindi Rural District. Kilwa District covers an area of 13,347.5 km² (1,221.5 km2 is ocean),
which is divided into 93 villages containing an estimated 36,549 households (DADPS 2009).
The population in Kilwa District is estimated at 181,975 according to the 2010 district population
projections. The population density is 12.6 people per km2, annual growth and death rates are 2.4%
and 0.2% respectively. 85% of the population lives in rural areas and 15% in urban and peri-urban
areas.
Fishing and subsistence agriculture are the main economic activities, accounting for ~80% of the
labour force. The average per capita income is estimated at TSh 150,000/- per year (DADPS 2009,
MACEMP 2009).
Fish is the main source of protein in the district, nearly all of which comes from coastal marine
fisheries. These coastal fisheries, which support around 1,900 fishermen and 1,000 fishing boats, are
-5-Drivers of Deforestation in Kilwa
almost entirely dependent on traditional methods and gear (artisanal fishing) including mashua, dau,
ngalawa and dugout canoes (MACEMP 2001).
The major cash crops grown in the district are coconuts, cashew nuts and sesame, while maize,
sorghum, cassava, rice, sweet potatoes and cowpeas are the main food crops. Other crops grown
include pulses, mangoes, citrus and vegetables. Intercropping is widespread and often results in
complicated cropping patterns (DADPS 2009, MACEMP 2009).
In recent years logging activities and livestock keeping have increased. Two factors have contributed
to this rise; one is the improvement of the road that links Kilwa with Dar es Salaam (especially the
completion of the Mkapa Bridge over the Rufiji River in 2003), and the second is the relocation in
2006 of livestock keepers from Ihefu Wetland in Mbeya to Lindi and Mtwara Regions.
1.2.2 Land cover and Vegetation
Kilwa District is sparsely populated and most of it is covered with natural vegetation, a large part
comprising miombo woodland with patches of coastal forest. At a macro scale, miombo vegetation is
considered to be fairly uniform. When viewed at a smaller scale, however, as a result of topography
and soil, it is a dynamic mosaic of grassland, thicket, forest and other woodland (Chidumayo 1997)
The major vegetation zones in Kilwa are the low-lying coastal strip, the central dissected plateaux on
higher lying lands (100m asl) and the far west bordering the Selous Game Reserve.
Along the low lying coastal strip the vegetation is characterized by the East African Coastal Forest
and thickets, and the vegetation is predominantly deciduous scrub with scattered trees. There are
substantial areas of seasonally flooded sandy soil, and much scattered cropland (Burgess et al. 1998).
Running down the centre of Kilwa District are dissected plateaux of slightly higher lying land with
fragments of the globally important biodiversity hotspot East African Coastal Forest (Ngusaru et al.
2001, Burgess et al. 1998). In the centre and far west of the District, bordering the Selous Game
Reserve, wildlife numbers are greater, with large mammals such as elephant, hippopotamus, and lion,
among many other species. Their grazing and browsing have a substantial impact on the vegetation,
which is generally short and open. Although the dominant trees here are mostly typical miombo
species, such as Brachystegia longifolia and Diplorhynchus condylocarpon, they are unable to grow
to their full stature due to high browsing pressure by wild herbivores, as well as the influence of
frequent fires set by villagers and hunting block owners (MCP 2006).
1
Marine and Coastal Environment Management Programme (MACEMP) recently conducted a study to assess land
capability for Kilwa district to provide information and knowledge of potential and limitations of the land resources and
provide information on the carrying capabilities of land in the District.
-6-Drivers of Deforestation in Kilwa
2 DEFORESTATION AND FOREST DEGRADATION IN KILWA DISTRICT
Deforestation in UNFCCC terms involves a permanent change to another land use (Penman et al.
2003).The UNFCCC definition of forest degradation is direct human-induced long-term loss
(persisting for X years or more) of at least Y per cent of forest carbon stocks (and forest values) since
time (T), in a manner that does not qualify as deforestation (Penman et al. 2003). Therefore, even an
area that is temporarily devoid of trees may still qualify as degraded forest if those trees are likely to
grow back.
The Ministry of Natural Resources and Tourism estimates Tanzania’s reduction of national forest
cover at decreasing from 44 million ha in 1961 to 33.5 million ha in 1998 (FBD 2001). That
represents an annual loss of 0.73% which, if sustained, would further reduce the forest to 28.4 million
ha by 2020. In fact, the rate of deforestation is more likely to increase than simply to be sustained
because, unless extraordinary change occurs, demand for forest products is increasing which will
result in people taking more wood from less forest. The FAO (2005) estimates Tanzania’s annual rate
of deforestation at 413,000 hectares per annum.
Deforestation and forest degradation is ultimately driven by the demand for timber and other forest
products such as charcoal from urban areas, agricultural expansion, livestock keeping and other
development activities. Dallu (2006) and Mbonde (2005) list the threats currently facing forest
management in Tanzania as illegal harvesting and trade in timber and other forest products, forest
encroachment due to small-scale shifting agriculture, and the impacts of refugees, livestock, mining
and fire.
2.1 Agriculture
Agriculture is the predominant driver of deforestation worldwide. According to the UNFCCC,
subsistence agriculture in poor countries is responsible for 48% of deforestation, with commercial
agriculture responsible for 32% of deforestation, and commercial logging responsible for only 14% of
deforestation. Charcoal and other fuel wood removals account for less than 6% of deforestation, but
those uses can generally be assigned to subsistence practises (UNFCCC 2007).
Traditionally agriculture in Kilwa District has been for subsistence and followed shifting cultivation
patterns and customary practices. Agricultural expansion in the district is mainly influenced by the
size of households – i.e. population growth – and the amount of surplus crop obtained from the
previous harvest. Immigrants from other parts of the country practice permanent farming with better
farming techniques and use more sophisticated tools, although their goal is also primarily subsistence.
Major crops grown in the district are sorghum, maize, cassava, rice, millet and legumes as food crops,
whereas cashew, sesame and coconuts are the main cash crops. Banana and other fruit trees such as
mangoes, orange and lime are also widely grown in the region.
The area under cultivation in Kilwa District as of 2010 is estimated at 104,744 ha, which shows an
increase of approximately 40% as compared to less than about 63,000 ha under cultivation in 2005/6
(Table 1). There is no intensive or commercial farming of food or cash crops in the district apart from
Bioshape’s attempted and now abandoned Jatropha plantation in Mavuji, Nainokwe and Liwiti
villages (DADPS 2009; Sulle and Nelson forthcoming). Shifting cultivation is prevalent although
estimates by the district agricultural office puts it at 5-10% of the total area under cultivation (Pers.
comm., DALDO Kilwa 2010).
-7-Drivers of Deforestation in Kilwa
Year Area Cultivated (ha) % Increase
2009/10 104,744 11.9%
2008/09 93,615 2.0%
2007/08 91,758 1.5%
2006/07 90,402 43.6%
2005/06 62,968
Average 5.0%
Table 1: Area under cultivation in Kilwa District.
Source: Kilwa District Agricultural Office
2.1.1 Subsistence agriculture
Local farming systems are subsistence and the cropping pattern is a complex mix of cropping
practices. Farming systems differ slightly between coastal households and those inland. Households
located along the coast alternate their time between farming and fishing and fishing is the most
important activity that provides most of the households’ needs and during the periods of scarcity. The
minimum acreage required by a typical coastal household to produce its annual food requirement is
about 1ha (MACEMP 2009), whereas households located inland require larger areas. Inland villagers
engage in multiple activities apart from farming such as hunting, logging and other forest-related
activities.
Most households have at least two farming plots; one is for staple foods in which crops like maize,
sorghum or cassava are mixed with legumes in a more-or-less random intercropping manner. Another
farm plot is either cultivated with rice, cashew or sesame. Rice, sorghum and sesame farming is very
dynamic and can be shifted from one area to another depending on a number of factors such as
declining soil fertility, invasion of weeds and consumption of crops by wild animals. Only cashew and
coconut groves are permanently situated.
The general farming system in Kilwa District is manual peasant agriculture with low cash inputs,
producing for subsistence and a cash surplus where possible. The majority of farms are individual and
fragmented holdings. Households mainly depend on food grown from their plots which in most years
is insufficient to meet household food needs. The majority of farmers do not have access to improved
farming technologies and farm inputs. The use of simple hand tools such as hand hoes and pangas
(machetes) is widespread and dominant. In the traditional cropping sequence, crops which require the
highest level of fertility such as maize and sesame are planted in the first year to be replaced in
subsequent years by crops with lower nutrient requirements such as sorghum and cassava. Family
labour is the main source of labour for most farm operations.
Farm productivity is low and in case of famine or crop failure the effects are catastrophic, where
people are forced to even consume their seeds. For instance in 2006/7 Kilwa District had a food
shortage of about 30% of the population and the government had to provide food aid as well as seeds
to be used for next season of about 25 metric tonnes (DADPS 2007).
2.1.2 Commercial agriculture
Cultivation of cash crops in Kilwa District has a long history; major cash crops grown are cashew,
sesame and coconuts. Historically, during the 1950s and 1960s, and up until the mid-1970s,
Mozambique and Tanzania were the main cashew-producing countries in Africa, with smaller
amounts produced in a number of other countries (FAO 2004, Mponda 1996). During the past decade,
Nigeria has emerged as the leading producer and exporter of cashews in Africa. The production of
-8-Drivers of Deforestation in Kilwa
cashew nuts in Nigeria has increased almost six-fold in the last decade. As in the case of other
developing countries, Nigeria has recognised the potential economic value of cashew and has made a
concerted effort to improve production of the crop (FAO 2004).
The majority of cashew production in Tanzania is carried out by small-scale farmers in mono- or
mixed production systems. The government is actively supporting farmers in upgrading their current
farming systems and practices in order to improve the condition of the trees and maximize agronomic
potential. Current yields are about 3 kg per tree, but under proper management – weeding,
fertilization, disease and pest control – yields of 8 kg per tree can be expected (FAO 2004).
Sesame is the second most important cash crop in south-eastern Tanzania after cashew. Like cashew,
sesame is grown by small-scale farmers in mono-crop farms. Sesame grows well in many types of soil
but thrives particularly on well-drained and medium textured soils; sesame is drought resistant and
tolerant to pests and diseases. The nutrient requirements of sesame are a bit higher compared to other
crops grown in the district (Mponda 1996).
Sesame in the Kilwa is grown in shifted plots. Farmers prefer virgin forest land for several reasons:
virgin forest soil is easy to work with; after clearing the area is burned and is ready for planting; new
cleared forest has less weeds for about two seasons therefore weeding is very much reduced; sesame
flea beetle is the major threatening pest and using new forest land offers a feasible strategy to avoid
this pest (Mponda 1996); new cleared forest soil is well drained and requires zero or minimum tillage
before planting thus providing the best place to grow sesame. Sesame is generally a labour intensive
crop but when grown on virgin soils the labour requirement is reduced to one third (Mponda 1996).
MACEMP (2009) analyses the cash requirement of a typical farmer, the main assumption being that
all basic cash income requirements are obtained from the sale of cashew, coconut or sesame. For
coastal people to be attracted to live on the land in their villages it is assumed that they should be
capable of earning as much as a minimum wage urban worker. The minimum wage in urban areas is
TSh 1,000,000/- per annum on the basis of 250 days ‘work’ per year. In rural villages the average
annual income is much lower, around TSh 357,000/- per annum per household in villages in which
MCDI works (Fletcher 2008).
The gross margin for coconut is TSh 633,500/- per hectare (MACEMP 2009). Thus 1.6 ha will
generate the target income of TSh 1,008,000/-. The gross margin per hectare for cashew is 694,750/-
and that of sesame is 1,219,500/- . Thus, depending on the crop grown, between about 1ha and 1.6 ha
of cash crops are required to generate a competitive income of at least TSh 1,008,000/- per year to
meet the cash demand of a typical coastal household. The situation is different in the inland villages
where an average of 0.5ha of Cashew nut is required or less than 0.5ha of sesame is required to
provide a competitive income of TSh 357,000/-.
With the increasing demand for cash crops, increasing access to markets and increasing urbanization,
farm expansion also is expected to increase beyond the current model result of 1.6ha per household to
meet these demands. The MACEMP study projected that if the present farming system and level of
technology prevails, the coastal strip of Kilwa will reach the maximum carrying capacity in the next
five years (MACEMP 2009). This may then drive agricultural expansion inland.
2.1.3 Livestock keeping
Livestock keeping in the District until recently was almost non-existent; only a few villagers had
cattle, goats or sheep. In 1996 there were only 1,436 cattle, 5,000 sheep and 4,879 goats (DADPS
2009). In 2006/7 Kilwa received a substantial amount of livestock from other regions mainly from
-9-Drivers of Deforestation in Kilwa
Ihefu Wetlands in Mbeya, about 11,902 cattle plus a few hundred sheep and goats arrived during that
period, briefly bringing the livestock population to over 13,000 animals. The recent influx of
pastoralist and agro-pastoralists livestock keepers into the district has made livestock keeping an
important component in the farming system in Kilwa District.
Kilwa district has more scrubland and woodland than arable land and most of the arable land is
planted with perennial crops or is under cultivation of both food and cash crops (MACEMP 2009).
The major threat that is posed by the increasing number of livestock is the creation of more grassland
areas from forest and bush lands to meet the grazing demand. It is estimated that a single head of
cattle requires about 10 acres of grassland per year for grazing. Extended dry periods and high
incidence of bushfires may force the grazing area per head to go beyond the standard 10 acre
requirement. This will lead to more forest being cleared to create grasslands for grazing.
Miombo woodlands play a critical role in the management of livestock throughout the region,
especially now with the sudden increase of livestock. After arriving, most of the livestock were
located in the bush or forest land and livestock owners had to create grazing areas for their animals.
During wetter times of the year, open grassy patches within the miombo are sometimes heavily used
for grazing, but late in the dry season these grass patches are burnt over or are fully grazed hence
grazing must encroach into the woodland. Miombo is a seasonal habitat, and loses much of its leaf
cover during the dry season. In the early spring, the so-called ‘late dry season flush’ sees the miombo
coming back to life, with vast swathes of the woodland covered in bright red, orange and yellow
foliage. It is during this time of year, when seasonal grazing resources are otherwise highly
constrained, that miombo comes into its own as a critical source of fodder for livestock.
The number of livestock in the district is set to increase due to the deliberate effort by the government
to stimulate development and encourage more people to invest in livestock and ranching activities,
although in practice this is likely to lead to greater immigration by pastoralists than significant
behaviour change by existing Kilwa residents. The government is providing the necessary
infrastructure such as the construction of cattle dips, opening livestock markets at Nangurukuru and
Mbwemkuru and setting aside areas for ranch development. Kilwa district plans to have a total of
75,000 head of cattle in the near future (pers. comm. DALDO Kilwa 2010).
2.2 Charcoal production and fuelwood requirement
Charcoal and fuelwood are by far the most widely used sources of domestic energy in Tanzania; in
urban areas charcoal is used extensively and fuelwood less, the opposite is true in peri-urban zones
and in rural villages. About 85% of the total urban population depends on charcoal for household
cooking and energy for small and medium enterprises (Sawe 2004). Driven by low incomes amongst
the majority of charcoal users and the lack of affordable alternative energy sources, the majority of
medium to low-income families in urban areas rely heavily upon charcoal as their principle source of
domestic energy due to a lack of competitively priced alternatives (Monera et al. 2003, Luoga et al.
2000).
Rural people in Kilwa depend entirely on fuel wood for all their energy need for cooking and other
uses. In 1992, the total amount of charcoal consumed nationwide was estimated to be about 1.2
million tons (TaTEDO, 2002). In 2002 the charcoal business generated estimated revenues of more
than 200 billion Tanzanian shillings ($200 million, Van Beukering et al. 2007) and that more than
70,000 people from rural and urban areas were employed in the charcoal industry (TaTEDO 2002).
Dar es Salaam, Tanzania’s largest city, accounts for more than 50% of all charcoal consumed in the
country (Ahrends et al. 2010). Nowadays from 15,000 to 20,000 bags of charcoal enter Dar es Salaam
- 10 -Drivers of Deforestation in Kilwa
every 24 hours, every day of the year, and an equal amount enters the other major Tanzanian towns
combined. That adds up to nearly one million tonnes of charcoal per year, for which trees had to be
cut from 3,320km2 of forest. Some of that forest will regenerate; but much of it never will because it
is converted to farmland and/or is cut again for charcoal before it has fully recovered (Norconsult
2001). The population in Dar and other major towns in Tanzania are increasing in population, further
fuelling the demand for charcoal.
All charcoal in the country is produced in the rural areas, with the largest shares of raw materials
extracted from open Miombo woodlands (owned by local governments), reserved forests, bush land
forests (publicly owned), mangrove forests, and farm lands (Van Beukering et al. 2007, Milledge et
al. 2005).
Preference and suitability of trees used for charcoal burning varies with the type, size, availability and
accessibility of the tree species. Large tree species (>20cm diameter) with high caloric values are the
most preferred (Monela et al. 1993). If these are not easily available or accessible, other tree species
like Mangifera indica (mango), cashew etc. with low calorific values can be used as well. Reserved
trees such as Milicia excelsa, Pterocarpus angolensis and Dalbergia melanoxylon, although they have
high calorific values, in theory cannot be harvested as they are nationally protected tree species (Van
Beukering et al. 2007, Monela et al. 1993), but closer to Dar even these species are exploited for
charcoal. Moreover, as much of the trade in charcoal is not properly regulated, legal restrictions on
species selection have only marginal impact.
Trees used for charcoal making are mainly harvested in two ways: clear felling of forestland for
agriculture purposes and subsequent carbonization of the felled trees; and selective cutting done by
charcoal makers who specialise in the charcoal business, which may be their main source of income.
Selective harvesting is in principle the least destructive form as it allows young trees to grow.
However, due to inadequate management and regulation young trees are also chopped down and used
to cover the charcoal kilns, resulting in unnecessary forest destruction.
Several studies conducted to examine the supply–demand chain of charcoal trade show that the
production of charcoal follows a southward shift from Dar es salaam. Charcoal consumed in Dar used
to come from adjacent villages in Coast Region, but currently most charcoal to Dar comes from
further north around Morogoro and Tanga Regions and further south from Rufiji and as far as
Marendego, Somanga and Miteja in Kilwa District (Milledge et al. 2007, Van Beukering et al. 2007,
TaTEDO 2002, Monela et al. 1993). Charcoal enters the city though the major routes such as
Morogoro, Pugu, Kilwa and Bagamoyo. Morogoro and Pugu routes contribute 59%, Kilwa (accounts
for the charcoal from the south including Rufiji) route 31% and Bagamoyo 10% of the charcoal
arriving in Dar es Salaam (Van Beukering et al. 2007). This shift is a result of increasing demand in
the city and surrounding suburbs, decreasing forest and timber resources for charcoal in nearby
villages and as a result of improved roads and access to areas far from the city.
Charcoal burning produces high volumes of carbon dioxide, carbon monoxide and methane. On
average, fuelwood carbon is approximately diverted as follows: 52% to charcoal, 24% to CO 2, and
10% to other components. This implies that charcoal fuel cycles constitute some of the largest
greenhouse-gas (GHG) emissions in the world (Van Beukering et al. 2007).
Existing legal charcoal harvesting in Kilwa District is estimated at 9,372 bags per year, based on
existing license data from 2007 and 2010 (Table 2). At 50kg/bag, this equates to a legal harvest of
about 2,343 tonnes of charcoal from Kilwa annually.
- 11 -Drivers of Deforestation in Kilwa
Date Months No. of licenses No. of bags
Dec 06 - May 07 5 49 6153
May 07 - Dec 07 7 49 4704
Mar 10 - Jun 10 3 20 858
Total 15 118 11715
Average per year 94 9372
Table 2: Data on legal charcoal production in Kilwa District.
Source: Licenses issued by the Kilwa District Forest Office in 2007 and 2010.
Charcoal production is expected to increase considerably in Kilwa in the future, given trends of rising
demand from urban centres such as Dar es Salaam. Ahrends et al. (2010) describe how charcoal
production has, between 1991 and 2005, expanded south from Dar es Salaam at a rate of about 30 km
annually. However, even at that rate of expansion, it will not be for another decade or so that intensive
charcoal exploitation hits Kilwa District and results in a major increase in charcoal extraction, as
available supplies further north are gradually depleted.
2.3 Logging activities and timber trade
Logging is an important driver of forest degradation in Kilwa District. Most timber from southeast
Tanzania comes from Rufiji and Kilwa Districts; in 2003 Rufiji District accounted for 70% by volume
of all licensed timber harvests in southeast Tanzania, followed by Kilwa District by 18% (see Table 3)
(Milledge et al. 2007). The proportions of timber products transported from the region to Dar es
Salaam are given in Table 2 below; round wood constituted 80% of all timber products and sawn
timber 14%. The remaining 6% was comprised of strips, pallets, off cuts, sleepers, slabs and other
billets.
Location Jan Feb Mar Apr May Jun Jul Aug Sep Oct Nov Dec Total
Rufiji 677 1063 1518 1384 1746 1609 1537 959 789 1003 1185 1217 14,687
Kilwa 142 155 177 236 347 140 279 298 568 543 765 83 3,733
Lindi 67 94 108 63 26 100 15 27 189 54 137 880
Liwale 38 38 74 51 100 138 85 33 74 198 12 841
Masasi 16 59 126 33 264 498
Tandahimba 22 20 20 22 20 30 134
Mtwara 26 13 52 17 10 10 119
Total 950 1385 1897 1754 2293 2007 1932 1376 1763 1871 2364 1300 20892
Table 3: Total volumes of timber (m3) issued on harvest licences from the study area, 2003.
Source: District harvest licence, 2003 (figures rounded to a nearest cubic metre). Adapted from Milledge et al. (2007).
District Round wood (RW) Sawn wood (SW) Other products Total SW:RW
Rufiji 12 157.57 1 451.84 1 221.89 14 831.23 1:8.4
Kilwa 1 990.50 364.20 0.00 2 354.70 1:5.5
Mtwara 610.55 966.28 0.00 2 576.83 1:1.7
Total 15 758.56 2 782.31 1 221.89 19 762 1:5.7
3
Table 4: Volumes (m ) of timber products specified on transit passes, January-October 2004.
Source: Transit passes January to October 2004. Adapted from Milledge et al. (2007).
Forest inventories conducted in selected forest blocks in eleven priority districts during 2005 revealed
that Kilwa District has one of the highest densities of timber resources in southern Tanzania with
- 12 -Drivers of Deforestation in Kilwa
10.5m3/ha of harvestable timber in the surveyed blocks, second only to Tunduru District (12.2m3/ha)
(Malimbwi et al. 2005a,c,d,e). However, the same inventories concluded that most forests in Liwale
and Tunduru Districts “are degraded” whilst those in Rufiji and Kilwa Districts are “heavily
degraded”. In practice this characterisation should probably be interpreted as applying only to
commercially valuable timber species.
High urban demand for timber within Dar es Salaam and the expanding global demand have driven
the logging boom in Southeast Tanzania. The adjacent coastline and Dar es Salaam port provide
excellent gateway points for timber to then be exported out to reach global markets.
Dar es Salaam is the primary destination of timber and timber products (including all round and sawn
timber) and accounting for 87% of timber felled in southeast Tanzania. It is also a major destination
of other wood products to be sold at domestic and export markets including furniture, poles, off-cuts
and charcoal (Milledge et al. 2005). Other important domestic markets of timber and wood products
from the region are Zanzibar, Mafia and Arusha.
Current export markets for timber from Tanzania have shifted and are markedly different from the
situation in the early 1980s where 82% of sawn hardwood exports were destined for Western Europe,
15% for Africa and 3% to the Middle East (Moyo 1985). In contrast, countries in Asia and Middle
East are currently the main importers of unprocessed and semi-processed timber products (Table 5
below).
Product Species Quantity Primary destinations
3
Swartzia madagascariensis 847 m China (100%)
Logs 3
Tectona grandis 8,930 m UAE (99%)
3
Sawn wood, Various hardwood 4,282 m China (76%)
3
Billets and Softwood sawn timber 19,671 m UAE (76%)
Chips Sandal wood 116.51 tonnes India (100%)
Carvings and 103,110 kg India, USA, UK, China, Germany,
3
other finished Dalbergia melanoxylon 77 m Italy, Kenya, South Africa (31
products 5,513 pieces Countries in total)
Table 5: Timber export from Tanzania, July 2005 to January 2006.
Source: Forestry and Beekeeping Division, 2006.
Timber trade volumes stayed high throughout 2003 and up until mid-2004 when enactment of new
administrative regulations banned the export of round wood from natural forests. During 2003, a year
when trade was only marginally interrupted by logging and trade restrictions, it was estimated that
over 500 000 m3 of timber was harvested for commercial purposes from south-eastern Tanzania (a
figure which combined officially recorded harvests and estimates of unrecorded, illegal felling). This
volume is equivalent to over 830,000 trees, with harvesting intensity reaching 91m3 of round wood
timber per km2 of forest (mostly coastal forests and miombo woodland) in Rufiji and Kilwa (Milledge
et al. 2007).
In Kilwa District itself legal, licensed harvests averaged 770 m3 of round logs and 6,240 m3 of sawn
timber annually, based on various licensing periods recorded from 2006 to 2010 (Table 6).
Date Months No. of licences Round logs Sawn timber Months
Oct 2006 - Mar 2007 6 50 911.35
Mar 2007 - May 2007 2 49 1197.00
May 2008 - Apr 2009 11 49 463.07 2380 11
- 13 -Drivers of Deforestation in Kilwa
Date Months No. of licences Round logs Sawn timber Months
Dec 2009 - Apr 2010 4 50 259.20 5700 4
Apr 2010 - Aug 2010 4 26 123.00 1800 4
Total 46 224 2953.62 9880 19
Average / year 58 770.51 6240
Table 6: Timber harvesting data from Kilwa District during various licensing periods, 2006-2010.
Source: Kilwa District Forestry Office
2.4 Fires
Fires in miombo woodland occur frequently and in many places burn annually or every few years.
Fires are an important dynamic factor shaping miombo vegetation and species composition. In
particular, fire has been shown to be of critical importance in determining woody cover (Furley et al.,
2008). Long-term plot-scale experiments have shown that under annual burning miombo woodland is
converted to grassland (Furley et al. 2008), and that in the absence of fire, miombo starts to form
closed canopy forest (Trapnell 1959).
Most trees, including the dominant miombo species of Brachystegia and Julbernardia, are fire-
sensitive at young age, and regular fire tends to decrease their number. Pseudolachnostylis
maprouneifolia and Bridelia cathartica are semi tolerant (adversely affected by late dry season fires
only), whereas Pterocarpus angolensis, Pericopsis angolensis, Diplorhynchus condylorcarpon and
Strychnos innocua are fire tolerant from an early age (Backeus et al. 2006).
Bush fires tend to be most severe in the late dry season, and when miombo has been exposed to these
types of fires, the species composition can change dramatically. Miombo exposed to repeated, intense
late dry season fires is eventually fully converted to grassland, with a few fire tolerant tree species.
Early burning, though, is far less damaging to miombo, and can yield good grass regeneration on the
one hand, while limiting damage to newly sprouted trees on the other.
The relationship between livestock keeping, grass regeneration, crop production and the tendency for
people to light fires in miombo woodlands is highly synergistic. There is a widely held perception
amongst rural cattle owners in miombo regions, confirmed by range science (Menke 1992), that the
burning of grasslands encourages the regeneration of favoured grass species.
A summary of the results of prolonged annual burning of miombo forests by Furley et al. (2008)
shows that:
1. Vegetation structure is strongly affected, lowering the proportions of trees to shrubs and
herbaceous plants and reducing ground cover; irregular fire patterns leads to patchiness in
vegetation distribution; ground layer plants change from perennials to a dominance of
annuals.
2. Burning has relatively little impact on subsurface rooting structures and, except with
extraordinary intensities, does not penetrate far below the ground surface; however, surface
soil organic matter (0–5 cm) can respond rapidly to changes in fire regime.
3. Burning has significant effects on soil nutrient dynamics (which in turn can influence plant
growth) and greenhouse gas exchange.
- 14 -Drivers of Deforestation in Kilwa
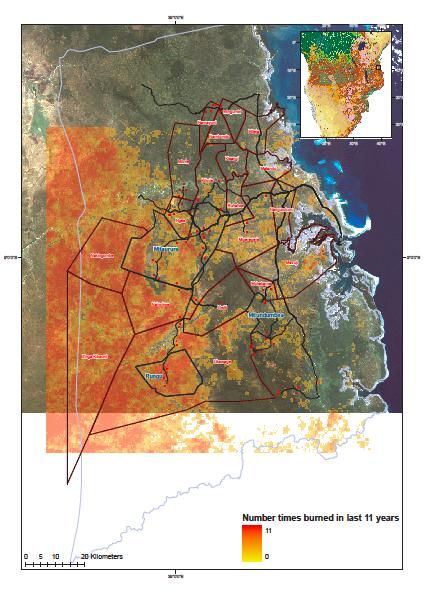
Figure 1: Fire frequency in Kilwa District, from MODIS fire monitoring data.
Prolonged annual burning of miombo forests has severe impact on biomass; plant population and
composition may be reduced, growth regimes may change due to the change in soil nutrient dynamics,
and the periodical removal of soil surface organic matter can lead to erosion and influence nutrient
dynamics. Both fire frequency intervals (every year, every other year, etc.) and fire intensity shape
fire’s impact on above ground vegetation. Fires lit late in the dry season tend to be more intense and
- 15 -Drivers of Deforestation in Kilwa
result in greater tree mortality and loss of biomass, whereas, fires started early in the dry season
before the grass has dried completely burn at relatively low intensities. Significant areas often remain
unburned after early burning because high moisture content and path-wise distribution of grasses that
is linked to underlying variations in soil moisture and drying rates (Stronach 2009).
Ryan and Williams (2010) describe how data collected from a number of miombo study sites in
Mozambique and Zimbabwe demonstrates that under annual fire regimes, miombo woodlands is
converted to grassland. As Table 7 demonstrates, at frequent fire intervals of 1-3 years, with medium
to high intensity fires, there is very little above-ground biomass. However, with low intensity fires,
forest cover can be maintained even with a fire return interval of two years. As Figure 1 depicts,
much of Kilwa District appears to have a fire frequency of 1-3 years, and fires lit late in the dry
season are often relatively intense.
Fire Interval (FRI) High Medium Low
1 0 0 0
2 0 0 22
3 0 6 45
4 2 19 65
5 6 33 64
7 16 45 66
10 32 54 73
25 59 66 75
50 65 69 70
100 69 74 75
Table 7: Changes in above-ground biomass resulting from different fire return intervals.
FRI is given in years, other figures represent tC/ha. Source: Ryan & Williams 2010.
2.5 Wildlife
Wild animals have a direct contribution to forest degradation through their grazing behaviour and
pattern. Elephants, in particular, are a key stone species which have a major effect on the local forest
structure.
The presence of wild animals is also a catalyst for several activities by man that result in deforestation
and forest degradation. The abundance of forests and its connection to Selous Game Reserve makes
Kilwa District rich in a variety of large mammals. The presence of these wild animals on one hand
stimulates and supports several other livelihood strategies such as tourism, hunting, and poaching, but
has negative effect on the main socio-economic activity – farming – with crop destruction and
personal injuries (even deaths) resulting from human-wildlife conflicts involving farmers.
Hunting in the district occurs both for subsistence and by tourists paying commercial rates. In Kilwa
District there are several hunting blocks set aside by the Ministry of Natural Resources and Tourism
where commercial hunting activities may take place legally. The vegetation in these blocks is open
miombo woodland and grassland. However, the boundaries of these hunting blocks are not very clear
and information is not made available to the public. In both subsistence and commercial hunting fire
is used as a tool to clear the land (increase visibility) and to chase animals to a desired location to be
hunted. Both uses of fire are prohibited under law, but are nonetheless common practice. The fire is
usually left to burn its way through the forest and it has become a common scene to see fires in these
forests.
- 16 -Drivers of Deforestation in Kilwa
3 SURVEY TO DETERMINE THE DRIVERS OF IN KILWA DISTRICT
In order to have an estimate of the contribution of the various potential drivers of forest loss to
deforestation and forest degradation in Kilwa District, a social survey was conducted in the form of an
informal discussion with focus groups in pre-selected villages. The discussions were guided by a
questionnaire focused on getting basic information from individuals who engage in activities that lead
in one way or another to deforestation and forest degradation. The focus groups were centred on
farmers, livestock keepers, timber traders and makers, charcoal makers and traders, petty traders, and
village leaders (Village government official, the Village Chairman or Village Executive Officer).
3.1 Methodology
The questionnaires were used and administered as the basis for the discussion in an informal setting
with the focus groups (groups of individuals from the selected villages) Village leaders were
interviewed separately from the groups. The groups were selected to represent a cross-section of
residents in a particular village. The groups consisted of male and female, young and elders, and other
relevant social groupings.
Farmers
Charcoal traders/makers
Timber traders and loggers
Petty traders (local shopkeepers/owners)
Village officials
Livestock keepers
3.2 Study area
The discussions with the focus group were conducted in six villages within the district. These villages
were selected from a list of 16 villages where MCDI operates and where it plans to implement the
REDD supported PFM and FSC projects. From the six villages, one village is among the six villages
where MCDI is already undertaking PFM work and the other five villages are among the 10 villages
where MCDI may choose to start the new PFM and FSC works under the REDD project.
The villages in which MCDI is new are Ngea, Mitole, Nambondo, Miteja and Mavuji. Kikole village
is the one village with established PFM (under MCDI’s tutelage, still active).
The villages were selected mainly due to their location in combination of other factors that directly
have an influence on accelerating deforestation and forest degradation. The main factors considered
were the location and accessibility. Preference was given to villages located along the major roads
passing through the district i.e. easily accessible throughout the year while those located off roads and
are not easily accessible throughout the year.
From Nangurukuru (Nangurukuru is the main crossroads settlement in Kilwa located along the Dar-
Mtwara tarmac road) Mavuji is located about 30 km south along the Kilwa-Lindi highway, Miteja is
about 60 km North along the Kilwa-Dar highway, Ngea is located about 50 km West along the Kilwa-
Liwale road. Nambondo is located inland about 45 km off Kilwa-Dar road and Mitole is also located
10 km inland off Kilwa – Liwale road.
- 17 -Drivers of Deforestation in Kilwa
3.3 Data collection and analysis
Data/information on the identified activities in the selected villages was obtained through informal
discussions with the villagers. These activities were farming, livestock keeping, logging, charcoal
making and trading. The discussions were guided with a set of pre-prepared questions in a
questionnaire. The questions were designed to address the various activities for each focus group. In
addition to the focused questions there were also general questions addressing general issues about
forests and changes in forest condition as well as other initiatives such as migration, land acquisition
and ownership, and issues on Kilimo Kwanza initiatives.
The individuals participating in the discussions were selected by the village government based on the
main activity undertaken by the individual in the village and the availability of the person to attend the
discussions (the visit was done during the month of May and many villagers were busy in their field
either harvesting or guarding their fields against wild animals). The number of participant was limited
to five (5) from each group so as to facilitate effective discussions. The discussions were performed at
once with all the focus groups whereby specific questions were directed to the specific groups and
general questions were discussed together.
Village leaders were also interviewed for the demographic, migration (in and out) information and
background information on their respective communities.
3.4 Results and Discussions
These results from this survey are compiled from the primary information that was gathered through
the discussions with the focus groups and village leaders. Each activity was considered separately,
and the varying combinations which make up each potential driver of deforestation and forest
degradation are then added together to give the total potential of the drivers. For the purposes of this
project, causes and reasons of the villagers to undertake these activities are considered and were
discussed with the focus groups. This report hypothetically looks at the drivers and extrapolates the
future impacts posed by these activities on forests present in Kilwa District.
A total of 133 respondents including 11 village leaders (VEO and Village Chairmen) participated in
the focus group discussions from all villages (Table 4). The focus groups included farmers, livestock
keepers, timber traders, charcoal makers and petty traders. From the discussions 98% of all
participants engage in farming as a core activity and other activities are considered subsidiary.
Agricultural production is low and does not meet all food and cash requirements, and in order to
supplement their income these farmers engage in other activities. Only four respondents who do not
reside on the target village carry out their timber/logging activities in the villages.
Kikole Nambondo Mitole Ngea Miteja Mavuji Total
Farmers 5 5 5 5 5 5 30
Livestock keepers 2 2 3 1 4 5 17
Loggers 5 4 4 4 5 6 28
Charcoal makers 5 2 4 2 5 5 23
Petty traders 3 2 2 0 4 1 12
Village leaders 1 2 2 2 2 2 2
Total 21 17 20 14 25 24 133
Table 8: Number of respondents in each focus group from the villages surveyed.
- 18 -Drivers of Deforestation in Kilwa
2
Village Population Households
Kikole 1600 320
Nambondo 2886 577
Mitole 2560 512
Ngea 258 52
Miteja 3666 733
3
Mavuji 1444 284
Table 9: Village population and number of households.
3.4.1 Agriculture
Agriculture is the main socio-economic activity, with 98% of all respondents engaged in agricultural
production and agricultural related activities for food production and cash generation. Crops grown in
all villages in various combinations are maize, sorghum, cassava, rice and pulses as food crops and
coconuts, sesame and cashew as cash crops. The farming system is very complicated; mixed cropping
is dominant where maize, cassava and pulses are mixed together in a plot of 0.5 – 2 acres. 47% of
respondents grow sorghum and rice as mono-crops where as the rest mix sorghum with other crops.
Sesame and cashew are also grown as mono-crops whereas cashew is a permanent crop and sometime
it is mixed with cassava and pulses. Fruit trees such as mangoes, citrus (orange and lime), banana etc
are grown around households for consumption and selling, it was difficult to quantify the acreage and
amount harvested per year.
53% of all farmers have a farm plot of two acres for all crops, and plan to increase their plots only if
they have the manpower to cultivate the extra area or if the harvest is good and produces surplus
which they can sell and thereby hire the labour required. Farm size was described during the
discussion to depend on the size of the household; a bigger household requires a bigger plot as they
require more food and have the manpower to work on the farm.
Crops Average area Average yield
(acres) (bags/acre)
Maize 1.5 2
Sorghum/Millet 1.5 2.5
Rice 1 5
Sesame 1 3
Cashew 0.5 Not known
Fruit trees Not known Not known
Table 10: Average area under cultivation and average yield of crops per acre.
Generally most farmers do not see if the forest is changing because they still see a lot of forest and
bush all around them and they can move anywhere they wish.
On a general note, all respondents have heard about Kilimo Kwanza, in villages like Mitole, Kikole,
Mavuji and Miteja are preparing by clearing more agricultural land and waiting for the district
2
The average number people in a households in the villages is 5 (MCP 2006).
3
The population data in Mavuji village is based on the district census projections for 2010. Mavuji had an influx of
immigrants during the period of 2007-9 when Bioshape was active establishing large scale Jatropha plantations. When
Bioshape closed its activities early 2009 most of the immigrants moved away and since then the exact population is not
precisely known.
- 19 -Drivers of Deforestation in Kilwa
agricultural office to provide them with power tillers to work their farms. However, the idea and the
pillars of Kilimo Kwanza are not well understood in all villages.
3.4.2 Shifting Agriculture
Shifting agriculture is common and practiced for all annual crops grown in the study area. 83% of all
respondents admitted to have shifted their plots at least once during the last five years. The most cited
reasons for shifting their plots are; invasion of weeds and evading wild animals. Emergence of tall
grasses was associated with loss of fertility and this perception changed during the discussions.
Farmers in the study area undertake minimal tillage and rely heavily on fire for clearing farm lands
before making random holes on the ground to plant seeds. Farmers in the study area described
ploughing and weeding as too difficult tasks and they consume a lot of time and instead they opt to
move to a new location when there is too much grass growing. This is explained by the fact that,
agriculture in the district is done using simple and primitive tools such as machete and hand hoes.
Mechanization to till land is seen as a privileged technology restricted to well-off farmers, while
animal ploughs were non-existent until late 2006 when agro-pastoralists moved into the district. The
use of tractors is also very limited and the few tractors present in the district are used as a means of
transport rather than in mechanised farming. 17% of farmers have not shifted their plots in the last
five years because they have permanent crops in their fields, mainly cashew, or have shifted their
homesteads in their farms.
Trees felled during land clearing and other vegetation are burned in order to remove them from the
field; big trees that cannot be burned at once are burned slowly during the season. A small number of
the trees are converted into timber and depending on the location of the plot some of the trees are used
to make charcoal (trees from easily accessible plots in Mavuji, Miteja and Ngea are used for
charcoal). 2% of all farmers admitted to have used the trees felled during land clearing for charcoal
sometime during the past 5 years.
4
Village Population Households Shifted Area (Ha)
Kikole 1600 320 221.33
Nambondo 2886 577 399.23
Mitole 2560 512 354.13
Ngea 258 52 35.69
Miteja 3666 733 507.13
Mavuji 1444 289 199.75
Total 12414 2483 1717.27
Table 11: Projected area under shifting cultivation in the villages surveyed.
Table 11 gives an estimate of the area that is cleared to make new farming plots in each surveyed
village every time a household shifts its farm. The numbers shown present a clear picture of how the
clearing of forest is associated with population, as the population grows and the number of households
increases more area will be cleared and abandoned every year.
4
The assumption used to calculate the shifted area is that 83% of the household practice this kind of farming and the
average size of household farms are 2 acres.
- 20 -Drivers of Deforestation in Kilwa
Figure 2: Population increase from 2002 to 2010 in the surveyed villages.
Figure 2 above shows the human population increase in the surveyed villages since 2002. Miteja has
about a 57% increase in population followed by Nambondo with over 40% increase; the Mavuji figure
is also expected to be higher but there is no updated data. Ngea village was part of Mitole and non-
existent in 2002, part of the residence moved to form a new village at Ngea and since then the
population in Ngea is increasing. Respondents from villages with PFM in place see the need to remain
farming on a permanent plot or re use earlier abandoned fields because they can no longer clear new
land in the reserved village forests. The situation is different in villages without PFM; villagers still
feel that there is plenty of land and can continue cultivating in the forests because that is where they
get the most yields and generate profits from farming.
3.4.3 Livestock keeping
The most common animals kept in all villages are goats and poultry. 85% of all livestock keepers in
the villages keep goats, 8% keep cattle and sheep, whereas cattle are only kept in Miteja and Mavuji
by agro-pastoralists residing there. There are four pastoralist families in Mavuji and only two in
Miteja; they have an estimate of 700 animals all together. Several other families moved to Mavuji
and Miteja but only stayed briefly and moved on. The pastoralists in Mavuji are satisfied with the
conditions there, have adapted and are looking to remain in the village over the long term.
Cattle keepers in Mavuji selectively clear forest to create grazing areas, the targeted trees are the ones
attracting elephants, and the most targeted trees are Barhimia spp. and Malura trees (Sclerocarya
birrea) which are elephants’ favourites; other trees targeted for clearing are those which harbour
tsetse flies. Cattle keepers think by eliminating these trees they will reduce the amount of tsetse flies
which is identified as the major obstacle to raising the number of cattle. Tsetse flies are usually found
along animal trails and they normally travel long distances with wild animals and especially
elephants.
Villagers who keep goats would like to eliminate the forest because it is associated with leopards that
attack and eat their goats. Mwanahasan a lady from Kikole Village is bitter about a leopard killing and
eating her goats, she says “I really do not see the advantage of having the forest around us; leopards
keep on eating my goats which brings me a decent income, better than farming.” Goats sell at a price
- 21 -You can also read