Drought Influence on Forest Plantations in Zululand, South Africa, Using MODIS Time Series and Climate Data - MDPI
←
→
Page content transcription
If your browser does not render page correctly, please read the page content below
Article
Drought Influence on Forest Plantations in Zululand,
South Africa, Using MODIS Time Series and
Climate Data
Sifiso Xulu 1,2, *, Kabir Peerbhay 1         ID
                                                  , Michael Gebreslasie 1   ID
                                                                                 and Riyad Ismail 1
 1    School of Agricultural, Earth and Environmental Sciences, University of KwaZulu-Natal, Westville Campus,
      Durban 4000, South Africa; Kabir.Peerbhay@sappi.com (K.P.); gebreslasie@ukzn.ac.za (M.G.);
      Riyad.Ismail@sappi.com (R.I.)
 2    Department of Geography and Environmental Studies, University of Zululand, KwaDlangezwa 3886,
      South Africa
 *    Correspondence: xulusi@unizulu.ac.za; Tel.: +27-035-902-6331

 Received: 23 June 2018; Accepted: 29 August 2018; Published: 30 August 2018

 Abstract: South Africa has a long history of recurrent droughts that have adversely affected its
 economic performance. The recent 2015 drought has been declared the most serious in 26 years and
 impaired key agricultural sectors including the forestry sector. Research on the forests’ responses
 to drought is therefore essential for management planning and monitoring. The effects of the latest
 drought on the forests in South Africa have not been studied and are uncertain. The study reported
 here addresses this gap by using Moderate Resolution Imaging Spectroradiometer (MODIS)-derived
 normalized difference vegetation index (NDVI) and precipitation data retrieved and processed using
 the JavaScript code editor in the Google Earth Engine (GEE) and the corresponding normalized
 difference infrared index (NDII), Palmer drought severity index (PDSI), and El Niño time series data
 for KwaMbonambi, northern Zululand, between 2002 and 2016. The NDVI and NDII time series
 were decomposed using the Breaks for Additive Seasonal and Trend (BFAST) method to establish
 the trend and seasonal variation. Multiple linear regression and Mann–Kendall tests were applied
 to determine the association of the NDVI and NDII with the climate variables. Plantation trees
 displayed high NDVI values (0.74–0.78) from 2002 to 2013; then, they decreased sharply to 0.64 in
 2015. The Mann–Kendall trend test confirmed a negative significant (p = 0.000353) trend between
 2014 and 2015. This pattern was associated with a precipitation deficit and low NDII values during a
 strong El Niño phase. The PDSI (−2.6) values indicated severe drought conditions. The greening
 decreased in 2015, with some forest remnants showing resistance, implying that the tree species had
 varying sensitivity to drought. We found that the plantation trees suffered drought stress during
 2015, although it seems that the trees began to recover, as the NDVI signals rose in 2016. Overall,
 these results demonstrated the effective use of the NDVI- and NDII-derived MODIS data coupled
 with climatic variables to provide insights into the influence of drought on plantation trees in the
 study area.

 Keywords: drought; NDVI; NDII; precipitation; El Niño; PDSI; forest disturbance; remote sensing;
 time series analysis

1. Introduction
     Defined as an extended period of rainfall shortage coupled with higher than normal
temperatures, droughts result in water shortages and plant water stress [1]. This prevalent, recurrent,
and multifaceted feature of the climate system is widely recognized as one of the costliest natural
catastrophes of the 20th century, threatening a multitude of terrestrial and aquatic ecosystems

Forests 2018, 9, 528; doi:10.3390/f9090528                                                www.mdpi.com/journal/forests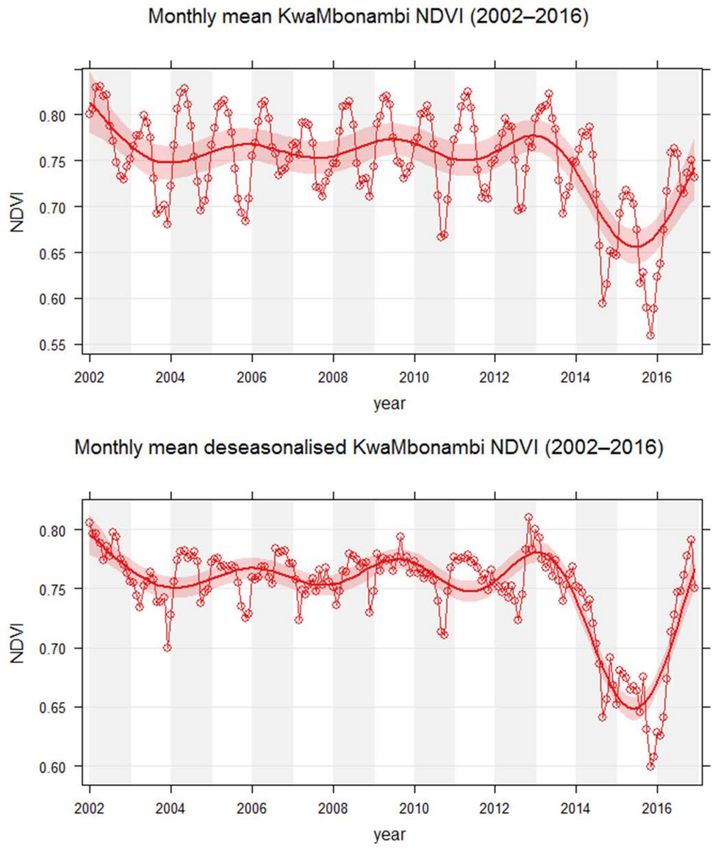
Forests 2018, 9, 528                                                                                    2 of 15

worldwide [2] and holding serious implications for ecological and economic factors [3]. In forests,
moisture and temperature anomalies associated with droughts affect the tree health, which often
results in extensive tree mortality [4].
      Past decades have witnessed a notable growth of drought studies reporting their varied impacts
on forest ecosystems globally. Extended drought events have, in part, induced forest fires [5,6],
provoked the outbreak and spread of tree-attacking insect pests [7], amplified tree moisture deficits [8],
stimulated the establishment of opportunistic plant invaders [9,10], and engendered land degradation
and fragmentation in and around forested landscapes [11]. These effects can result in severe tree
mortality and incur heavy economic costs for the forestry industry [12,13]. This is a serious concern
as [14] projected an increase in drought frequency, extent, and intensity, even in areas where droughts
are irregular [13]. So, the effects of droughts cannot be ignored, because they present a compounding
challenge to forest health and productivity [8,15,16].
      Consistent and frequent monitoring of droughts across various scales is important for the forest
industry in order to respond promptly to forest disturbances and so reduce the risk of damage [17].
This practice may enhance our understanding of the fundamental drivers that trigger droughts so that
relevant forest management strategies can be developed [18], particularly in the face of shifting climate
conditions [19]. Measurements based in situ have traditionally been used to monitor drought damage,
although their spatial variability defies efforts to assess the ecological effects using field methods
alone [20]. Moreover, drought monitoring requires high-density temporal data; satellite remote sensing
provides necessary means to retrieve this information at flexible intervals, as well as to augment data
derived in situ [21,22].
      Progress in remote sensing, and, hence, the ability to detect droughts, has facilitated early
warning systems [21] and the timely detection and monitoring of droughts across large areas [14].
The suite of the current generation of satellite imagers are capable of observing forest landscapes
at much finer spatial scales than in the past and at a near-daily time step, enabling seamless
reconstruction of the spatial and temporal manifestations of drought-mediated disturbances [23].
However, the understanding of droughts depends on the availability and consistency of satellite
data. The opening of ample free satellite data archives by the United States (US) Geological Survey,
coupled with the capacity to retrieve fully processed images [24,25] has transformed remote sensing
into a practical means for monitoring droughts. Particularly, the Google Earth Engine (GEE) platform
has become valuable for developing countries that are typically data-poor and lack high-performance
computing systems for drought monitoring [26].
      Typically, a remote sensing-based drought monitoring approach is achieved by tracking indices
that reflect plant responses as an indicator of climate variability. Several vegetation indices exist,
although the normalized difference vegetation index (NDVI) is the main, efficient, and commonly
used one [27]. It is the measure of plant photosynthetic ability and productivity, which is a function
of the difference between near-infrared (0.858 µm) and the red band (0.648 µm) reflectance over the
combined reflectance in these two parts of the spectrum [20,28]. Vegetative drought conditions are
described by a deviation of the NDVI values from their temporal mean, typically measured over
extended time scales. Studies have established strong correlations between the NDVI values and the
climatic variables [29], demonstrating that the index is an efficient indicator of climatic drought-driven
vegetation changes [30]. Other important variables for the study of droughts are related to moisture
storage in the root zone of the vegetation, which is measured by the normalized difference infrared
index (NDII), and similar to the NDVI, it uses ratios of the near-infrared and short-wave infrared
reflectance (1.65 µm) [31]. This is a robust indicator of water availability in the soil for use by trees [32].
      To determine the influence of droughts on the vegetation, variations in the NDVI are often
associated with drought indices, numerical criteria that characterize the drought intensity, scale,
and duration by assimilating key environmental variables such as precipitation, temperature,
and vegetation status [22]. The Palmer drought severity index (PDSI) is widely adopted [33],
providing standardized moisture conditions over time by incorporating precipitation, temperature,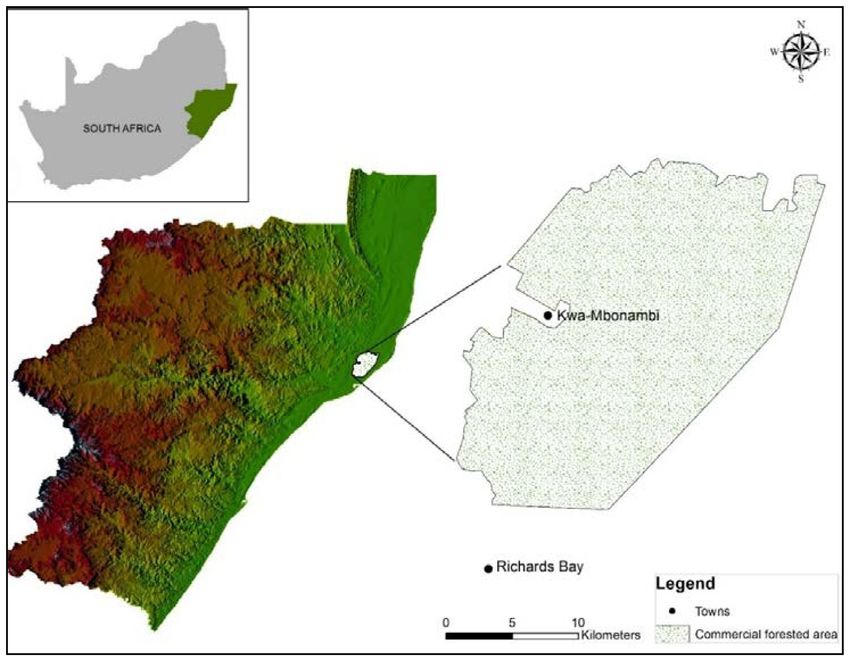
Forests 2018, 9, 528                                                                                 3 of 15

and potential evaporation [34]. The PDSI has been relatively successful at computing long-term
drought conditions in several regions [33]. The index varies between −10 and +10 [35], where strong
positive values represent extremely wet conditions, and strong negative ones indicate extreme drought.
Here, we define a drought as a negative detrended NDVI as a response to a moisture deficit caused by
climate variability.
      In the eastern seaboard of South Africa, the 1991–1992 drought cost the forestry sector nearly
R450 ($33.9) million [36]. During this period, more than 30,000 ha of forests were replanted shortly
after the drought season, and a further expense of R2000 per hectare was incurred to replace the
affected trees [37]. The most recent drought is closely comparable with that of 1991–1992 [38] and has
been declared as the worst in 26 years [39,40]. Furthermore, [41], an agricultural industry association
reported declining yields in other agricultural crops during 2016. However, in spite of their regular
occurrence, the effects of droughts on forest plantations in this region have received little attention
from scientists.
      The effects of the recent drought on forest resources along the northeast coast of KwaZulu-Natal,
South Africa have not been studied and are inconclusive. While previous drought effects on forests
have been explored in South Africa, no past studies have employed remote sensing—this study is
the first attempt to address this gap. Here, we use Moderate Resolution Imaging Spectroradiometer
(MODIS)-derived NDVI and NDII coupled with climate variables over a 15-year period (2002−2016) to
assess the influence of drought conditions on plantation forests in this region. MODIS was employed
because of its informative characterization of drought events [42].

2. Materials and Methods

2.1. Study Area
     The spatial context for this research is the KwaMbonambi plantation forests, which are located
along the eastern seaboard of KwaZulu-Natal, 30 km northeast of Richards Bay (Figure 1). It is
dominated by even-aged Eucalyptus L’Héritier. plantations of almost 40,000 ha. The plantations
are managed by Sappi, a large South African pulp and paper company with a global reach.
The growing stock mainly comprise 6–14-year-old Eucalyptus grandis W. Hill ex Maiden (E. grandis),
E. grandis × Eucalyptus camaldulensis Dehnh. (E. gxc), and E. grandis × Eucalyptus urophylla S.T.Blake
(E. gxu) hybrid clones. The stands are fairly uniform regarding canopy cover with tree density
established at 1667 trees ha−1 . It is typical of the northern KwaZulu-Natal forestry region, which is
subject to notable forest disturbances, such as fire and insect pest outbreaks. The area is characterized
by a subtropical climate, and the mean annual temperature is 22 ◦ C [43]. The area receives an annual
rainfall averaging 1200 mm, which is highly seasonal and peaks between November and February [44],
and the potential evapotranspiration is 1772 mm [45]. The landscape of KwaMbonambi is flat and
consists of Quaternary alluvial sediments of clay sands of aeolian deposits [46] and soil with varying
levels of organic matter [47], at an elevation of 74 m above sea level. The high penetrability of the soils
permits prompt leaching of the nutrients due to the high rainfall in this region [46]. These conditions
are favorable for fast-growing Eucalyptus plantations [48].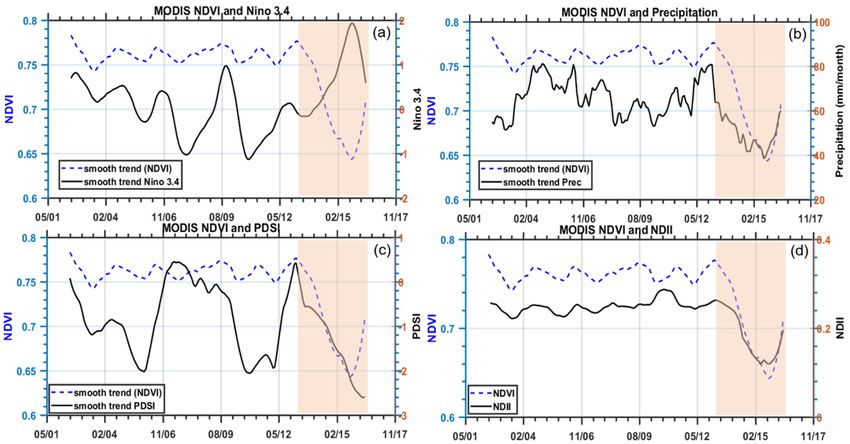
Forests 2018, 9, 528                                                                                   4 of 15

         Figure 1. Location of KwaMbonambi along the northeast coast of KwaZulu-Natal, South Africa.

2.2. Data for NDVI and Climate Variables
      Numerous Moderate Resolution Imaging Spectroradiometer (MODIS) products have been
extensively used to monitor vegetation changes since 2000. In this study, we used the MODIS
(MCD43A4) 16-day composite NDVI image product with 500-m resolution and nadir and bidirectional
reflectance distribution function-adjusted spectral reflectance bands, because it reduces the anisotropic
scattering effects of surfaces under different illumination and observation conditions [49]. The dataset
provides a sample on a rolling 8-day interval based on 16 days of a MODIS surface reflectance
composite period for bands 1–7. This product combines data from both the Terra and Aqua
spacecrafts, taking the best representative pixel from the 16-day epoch [50]. The image collection ID:
(MODIS/MCD43A4_NDVI) in the Google Earth Engine (GEE) environment was used to retrieve the
MODIS data. The high temporal frequency of this product makes it possible to detect changes by
using time series analysis, especially in the eastern seaboard of South Africa, where cloudy conditions
present a challenge. Otherwise, a finer Landsat product is ideal for the unit scale of the study area,
but data gaps were detected, and for that reason, the MODIS data was considered. The cloudy dates
were filtered to obtain images captured under cloudless conditions and processed using the JavaScript
code editor in the GEE environment. The NDVI values were averaged for the entire study area, and the
mean annual NDVI was used for analysis. The NDII was calculated in the GEE environment using
MODIS data.
      To understand the NDVI–drought relationship, climatic factors that include PDSI, Niño 3.4,
and precipitation were considered. Precipitation was also extracted from GEE using the Climate
Engine Application (CEA, http://climateengine.org./). These data are generated from the Modern-Era
Retrospective Analysis for Research Application (MERRA-2) model [51]. The MERRA model data
are available at 0.67◦ × 0.50◦ resolution at 1–6 h intervals. The Niño 3.4 index is an index commonly
used to quantify the strength and phase of the El Niño Southern Oscillation. El Niño events result
from the anomalous warming of the eastern equatorial Pacific Ocean, which affects the circulation,
often inducing drought and heat wave conditions over southern Africa via teleconnections [52,53].
The Niño 3.4 index was retrieved from the National Oceanic and Atmospheric Administration (NOAA)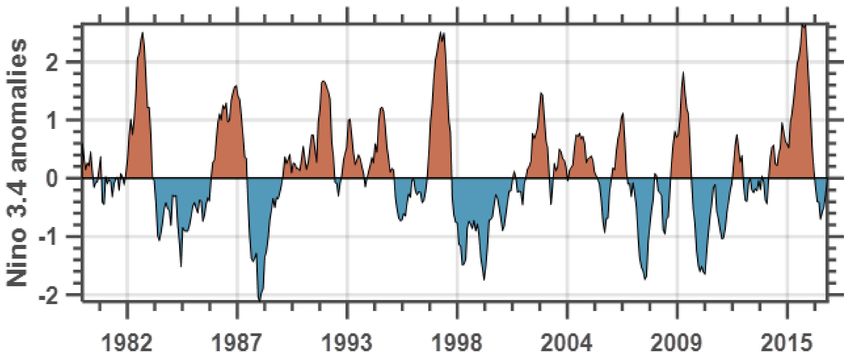
Forests 2018, 9, 528 5 of 15
online portal http://www.esrl.noaa.gov./psd/gcos_wgsp?Timeseries/. Niño 3.4 is computed by
averaging sea–surface temperatures (SST) within the Niño 3.4 region, in this case 5◦ N–5◦ S latitude
and 120◦ W–170◦ W latitude over the Pacific Ocean. The self-calibrating monthly Palmer drought
severity index (PDSI) data were obtained from the University of East Anglia’s Climatic Research
Unit (CRU) (https://crudata.uea.ac.uk/cru/data/drought/). PDSI is computed from time series
of precipitation and temperature, in conjunction with fixed parameters related to the soil/surface
characteristics at each location [54].
2.3. Temporal Trend Analysis
The NDVI time series generally contains a strong seasonal component that is associated with
the growing seasons of the vegetation [55]. The Breaks for Additive Seasonal and Trend (BFAST)
method, an aligner tool, was applied to decompose the time series into the trend, seasonal, and random
components, which explain seasonality and facilitate the detection of trend variations within the time
series. The BFAST equation is given as follows:
yt = m + Tt + St + Rt (1)
where m is the mean, T is the trend component value, S is the seasonal component, and R is the random
component at timestep t. The summation of the mean, trend, seasonal, and random components
is equivalent to the original time series. Thereafter, the time series was “deseasonalized” using the
“smoothTrend” function to remove the variations resulting from seasonal cycles.
Because the NDVI time series generally do not have normally distributed patterns and comprise
non-linear trends and outliers [56], the Mann–Kendall test was applied to determine the significance
of the 2002–2016 NDVI trend. A notable feature of this test is that it is insensitive to missing
values and avoids the loss of seasonal information when inspecting the trend [57]. Following [58],
the Mann–Kendall trend test is computed as follows:
n −1 n
∑ ∑
S= sign Tj − Ti (2)
i =1 j = i +1
where
1 if Tj − Ti > 0
Sign Tj − Ti = 0 if Tj − Ti = 0 (3)
−1 if T − T < 0
j i
where Tj and Ti are the annual values in years j and i, respectively, j > i. The average value of S is
E(S) = 0, and the variance (σ2 ) for the S statistic is given by the following:
n(n − 1 )(2n + 5) − ∑ ti (i )(i − 1)(2i + 5)
σ2 = (4)
18
in which ti denotes the number of ties to extent i. The summation term in the numerator is used only if
the data series contains tied values. The standard test statistic Zs is calculated as follows:
s−1.
σ f or S > 0
Zs = 0 f or S = 0 . (5)
s+1 f or S < 0
σ
The test statistic Zs is used a measure of significance of the trend. In effect, this statistic is used in
this study at a 95% confidence interval. If the z-score is between −1.96 and 1.96, then it implies that
the trend is not significant, but if it falls outside this range, then the trend is significant.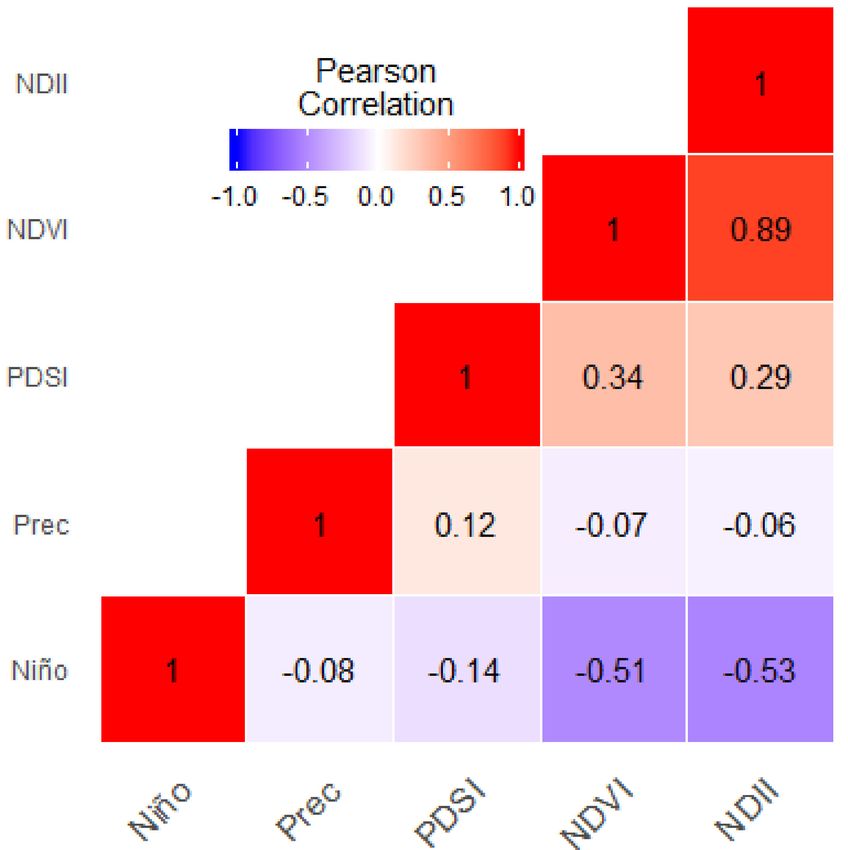
Forests 2018, 9, 528 6 of 15
2.4. Correlation Analysis of NDVI and Climate Factors
In this study, the Pearson correlation coefficient (r) between the NDVI, NDII, and climatic variables
was calculated to assess the influence of climatic drought on the plantation trees. This method has been
widely applied to analyze the relationship between the NDVI and climatic factors [59]. The strength of
influence for climatic factors on the NDVI patterns was determined over the 15-year period, between
2002 and 2016.
3. Results
3.1. Drought Severity in Southern Africa
As an introduction to the general characteristics of the recent drought in terms of its strength
and persistence, the El Niño events, which are associated with droughts in South Africa [60] are
reconstructed in Figure 2. Severe droughts that affected the country were apparently established
during a mature El Niño phase [61]. Over the past 30 years, the 1982–1983, 1991–1992, and 1994–1995
droughts appear to have been the most extreme, with the 1991–1992 drought declared as the worst on
record [38]. However, this study, in agreement with [41] established that the recent drought is more
severe and prolonged than the 1991–1992 event. In this regard, it was our intention to perform the
analyses so that the effects of the recent drought on commercial forestry in South Africa are determined.
Figure 2. Standardized monthly Niño 3.4 anomalies from 1982 to 2016, showing warm (red) and cold
(blue) phases of abnormal sea surface temperatures in the tropical Pacific Ocean.
3.2. Temporal Variability of NDVI
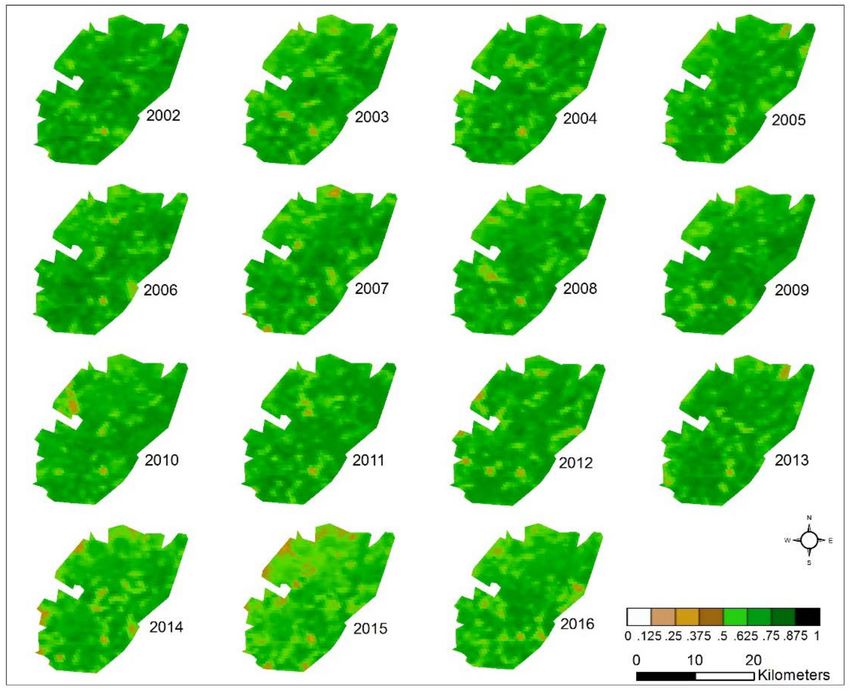
The temporal variability of the NDVI in the KwaMbonambi forest area is presented in Figure 3.
The first panel shows the original NDVI time series, followed by the trend on which the analysis is
based. The annual NDVI is fairly stable from 2002 until the breakpoint in 2014, which continues to
decline until 2015. The plantation trees showed a relatively stable NDVI pattern between 2002 and
2013 (Figure 4), slightly decreased in 2014, and progressed further in 2015, with remnants of stable
green over the eastern section. This difference suggests that the Eucalyptus clones in this region had
varying sensitivity to drier conditions. While this may have been the case, there was no way to rule
out the possible influence of other factors. In 2016, it seemed as if the plantations were recovering as
evidenced by a slight increase in greening. This was confirmed by the smoothed NDVI time series
(Figure 5), averaged for the entire study area with the shaded region showing the estimated 95%
confidence intervals. The smaller brown (harvested) sites showed a patchy distribution, mostly in
the eastern part of the study area, but appeared more prominently during the 2015 drought period.
The permanent patch (timber site) southeast of the study area is an exception.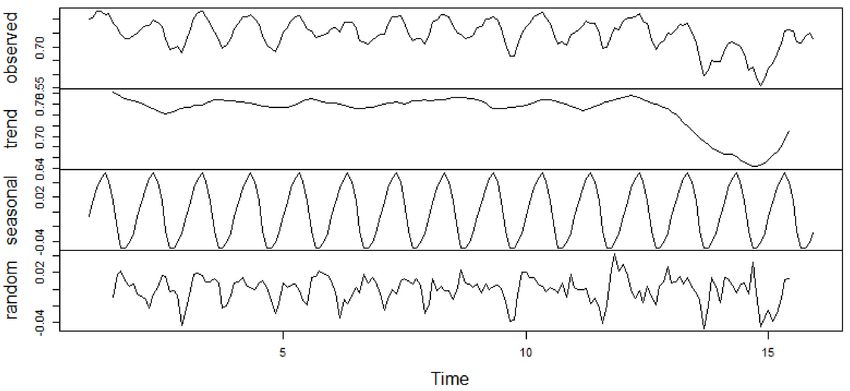
Forests 2018, 9, 528                                                                                    7 of 15

      Figure 3. The Breaks for Additive Seasonal and Trend (BFAST) normalized difference vegetation index
      (NDVI) time series components of the entire area.

                           Figure 4. Temporal variability of NDVI from 2002 to 2016.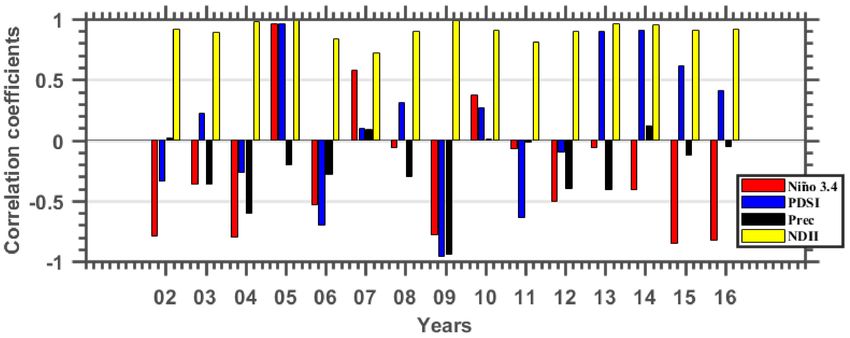
Forests 2018, 9, 528                                                                                 8 of 15

                       Figure 5. Smoothened and deseasonalised NDVI time series (2002–2016).

3.3. Time Series Analysis of NDVI, NDII, Precipitation, El Niño, and PDSI
      The time series analysis of the NDVI and the climatic factors over the 15-year period from 2002 to
2016 is presented in Figure 6. The result shows a fairly constant NDVI pattern over the first 12 years,
ranging between 0.74 and 0.78; it declined to 0.64 in 2015. This is supported by a Mann–Kendall
test that showed a non-significant (p = 0.4661, z = −0.728) NDVI trend from 2002 to 2013. The trend
(negative) was found to be significant from 2014 to 2015 (p = 0.000353, z = −3.5729). The NDVI
was accompanied by a similar precipitation pattern (Figure 6b) with a shortage in 2015. The NDII
(Figure 6d) also exhibited a similar pattern with the NDVI and precipitation. It can be seen from
Figure 6d that the period of 2002–2013 had a high moisture content (NDII = 0.25), followed by a
decrease in 2014 to drier conditions (NDII = 0.13) in 2015. From Figure 6a it is clear that the decrease in
the NDVI is associated with the strongest (1.9) 2015 El Niño event, which led to 2015 being the hottest
year on record globally [62]. The PDSI (−2.6) also pointed toward intense drought conditions during
this period, as shown in Figure 6c. This was also confirmed by the lower NDII (0.13) value in 2015,
which was indicative of a soil moisture deficit (Figure 6d). However, as shown in Figure 6a, the El
Niño events after 2002 had little influence on the Eucalyptus trees compared with the recent event.
Forests 2018, 9, 528 9 of 15
This was also supported by Figure 6c, which revealed that previous droughts over the study period
surprisingly had a negligible effect on this valuable commodity. These results imply that the recent
drought was relatively intense compared with other droughts events over the study period. Although
not fully recovered in 2016, it seems that the NDVI is recovering, along with increasing precipitation
while the El Niño effect is abating. So, the 2015–2016 drought appears to entail a temporal hiatus of
the NDVI trend. However, given the cyclicity of droughts in this region, the apparent recovery trend
remains to be confirmed.
Figure 6. (a–d) Temporal variation of the NDVI, normalized difference infrared index (NDII), El Niño,
Palmer drought severity index (PDSI), and precipitation from 2002 to 2016.
3.4. Correlation of NDVI, NDII, and Climatic Variation
The correlations of the NDVI, NDII, El Niño, PDSI, and precipitation are presented in Figure 7.
The NDVI showed a strong correlation with the NDII (r = 0.89), highlighting the strength of the NDII
to assess drought-related stress in the plantation trees. The results also indicated a negative correlation
between El Niño and the NDVI (r = −0.51), as well as the NDII (r = −0.53), reaffirming the consistent
mechanism of influence of drier conditions. The PDSI−NDVI correlation (r = 0.34) was also notable.
Because the influence of the climate variables on the NDVI may not be stable throughout the study
period, it was considered necessary to assess the extent to which the NDVI correlated with NDVII and
the climate variables for each year (2002−2016).
The correlation coefficients presented in Figure 8 showed a strong NDVI–NDII relationship
(r > 0.7) throughout the study period. The El Niño effect also showed a negative but strong correlation
with the NDVI trends in 2015 (r = −0.85)—El Niños are well known to induce drier conditions in South
Africa [63]. The relative NDVI decrement was strongly associated with the worsening PDSI signal,
particularly in the period of 2013–2014 (r = 0.9) and 2015 (r = 0.6). On the other hand, the correlation of
the NDVI and precipitation is not as high as the other variables (r = 0.1). In a similar study, [64] stressed
that the correlation between the NDVI and precipitation is strongly influenced by the degree of
aggregation over a time dimension. Moreover, studies such as [65] noted that the NDVI lags behind
precipitation by several weeks or months. This is also the case in this study as illustrated in Figure 6b.
Otherwise, the strong association of the NDII, PDSI, and El Niño with the NDVI confirms a decrease
in the tree activity as a result of drier drought conditions in 2015. On the basis of these associations,
therefore, it is apparent that the plantation trees during 2014–2015 suffered moisture stress because
the El Niño was at its peak. This is reflected by a sharp decrease in greenness in 2015, as illustrated
in Section 3.2.Forests 2018, 9, 528 10 of 15
Figure 7. Pearson’s correlation of the NDII, NDVI, PDSI, precipitation, and El Niño (2002–2016).
Figure 8. Pearson correlation coefficient of the NDVI, Niño, PDSI, precipitation and NDII for each year
(2002–2016).
4. Discussion
We have explored the spatial variation and temporal patterns of the NDVI values as a surrogate
for the plantation trees in association with climate variables. The plantations trees displayed high
NDVI values in harmony with precipitation trends over much of the study period, until a sudden dip
in 2014, which intensified further in 2015, reaffirming the consistent mechanism of influence [66,67],
especially in arid and semi-arid regions where precipitation is the limiting factor for plant growth [68].
The NDII also exhibited a similar pattern with the NDVI and precipitation, suggesting that the
reduction of tree activity in 2015 was related to a water deficit as a result of the strongest El Niño
period, which is believed to have induced drier conditions [66] and altered vegetation reflectance
spectra [69]. This reaffirms Sriwongsitanon’s [31] finding that the NDII is a robust indicator of the
interaction between precipitation, soil moisture, and plant water content. This further highlights
the stronger influence of precipitation on tree activity [70]. In accordance with this observation,Forests 2018, 9, 528 11 of 15
the negative PDSI signal pointed towards a severe drought event that had already been reported
by [38,41] as the worst over the past four decades in this country. This drought was notable because
of its severity and duration. In response, the plantation trees exhibited a sharp drop of greenness as
the NDVI reached a value of 0.64—the lowest recorded over the study period, with the exception of
clones over the central east region that showed tolerance. More recently, in KwaMbonambi, [71] found
large-scale dieback of a single E. gxu hybrid clone, while other E. gxu clones in the same area remained
relatively healthy. Following this finding, intensive assessments were carried out to consider the
possible role of insect pests and pathogens on the affected trees, and the results showed no evidence
that these disturbances were responsible for the dieback [71]. Instead, their results showed variation
in the hydraulic functioning among the E. gxu clones, where dying clones suffered from drier field
conditions compared with other healthier clones.
This is also supported by the extended reduced precipitation over the same period. For this
purpose, [61] advised that the advent of El Niño conditions should signify to key stakeholders the
probability of severe drought effects. To maintain maximum productivity in the face of threatening
climate variability, scientists have long been adjusting and developing crop hybrids that can survive
drier conditions [72]. Nevertheless, the El Niño-mediated droughts are most frequent in South
Africa [38] and hold important implications not only for the forestry sector but also water resources,
food systems, and the socio-economic welfare of the country. Otherwise, the performance of the NDVI
and the NDII in detecting the 2015 drought was comparable, with the NDVI showing slightly more
sensitivity. In other related studies [32], the NDII was found to react to drought conditions faster and
to greater extent than the NDVI. Furthermore, the analyses between the NDVI, NDII, and climate
variables using the BFAST time series method proved to be a robust tool for probing forest ecosystem
function responses to climate variability [73,74].
The overall impression is that these findings for 2015 indicate several landscape scenarios with
implications for forest productivity in northeastern South Africa. First, that the plantation trees
appeared to have suffered from moisture stress, as evidenced by the decrease in the NDVI and the
NDII; second, that a clear variation in the NDVI was apparent, suggesting that some clones were more
sensitive to climate variation than others. This is consistent with [75] who established that the variation
in canopy response to water availability has been recorded for many Eucalyptus clones in South Africa;
and lastly, based on these conditions, the growth of drought-sensitive clones was affected.
The method demonstrated in this study can be applied on a broader scale and to other
drought-prone areas to help provide greater economic security of the plantation forests. Particularly,
the GEE platform enables the efficient characterization of the plantations’ responses to droughts with
minimal data processing [26]. This holds much promise to address Huang’s [71] concerns that drought
monitoring at regional to global scales are challenging.
5. Conclusions
This study provides the first demonstration of the influence of drought on the plantation forest
tree activity in South Africa using high-density satellite time series data. The analyses of the NDVI,
NDII, and climatic variables offered a more detailed account of the spatiotemporal effects of drought
conditions on Eucalyptus plantations. The results showed a positive correlation of the NDVI with the
NDII and precipitation; all declined sharply in 2015. This decrease was associated with a strong El
Niño event, which is credited with inducing drier conditions over this period. Severe drought was
apparent in 2015, as confirmed by a negative (−2.6) PDSI and a low (0.13) NDII value, suggesting a soil
moisture deficit. In light of these results, we concluded that the vegetation activity of the Eucalyptus
species in KwaMbonambi responded with varying sensitivity to the 2015 drought event. For that
reason, we support the suggestion by [76] that drought-tolerant clones can be an ideal substitute for
sensitive ones. In addition, it would be desirable to evaluate how different clones react to climatic
variability and to evaluate these variables on a larger scale. Lastly, the MODIS-derived NDVI andForests 2018, 9, 528 12 of 15
NDII proved to be reliable indicators for the temporal pattern of drought conditions and provided an
efficient means for characterizing plantations and their response to climate variability.
Overall, the results highlight the great potential of the GEE platform in refining our ability to map
forest responses to climate variability. Through free access to ready-to-use satellite data, along with
continuous algorithm developments, the retrieval of temporal drought effects on plantation forests is
now possible. This offers a promising outlook for uncovering key disturbance patterns, which will
enable a much-improved understanding of complex forest processes in the face of the changing climate.
Author Contributions: Conceptualization, S.X., M.G., K.P., and R.I.; Methodology, Formal Analysis, Resources,
Writing of Original Draft, S.X.; and Review and Editing of Final Manuscript: S.X., M.G., K.P., and R.I.
Funding: This research was partly funded by the South African National Space Agency (SANSA).
Acknowledgments: We would like to thank Nkanyiso Mbatha for his assistance with the data gathering and
presentation. The authors would also like to thank Graham Baker for editing this paper. Lastly, the three
anonymous reviewers are thanked for providing constructive comments, which greatly improved the manuscript.
Conflicts of Interest: The authors declare no conflicts of interest.
References
1. Solh, M.; van Ginkel, M. Drought preparedness and drought mitigation in the developing world’s drylands.
Weather Clim. Extremes 2014, 3, 62–66. [CrossRef]
2. Bayissa, Y.; Tadesse, T.; Demisse, G.; Shiferaw, A. Evaluation of satellite-based rainfall estimates and
application to monitor meteorological drought for the Upper Blue Nile Basin, Ethiopia. Remote Sens. 2017, 9,
669. [CrossRef]
3. Mokhtari, A.; Mansor, S.B.; Mahmud, A.R.; Helmi, Z.M. Monitoring the impacts of drought on land
use/cover: A developed object-based algorithm for NOAA AVHRR time series data. J. Appl. Sci. 2011, 11,
3089–3103. [CrossRef]
4. Millar, C.I.; Stephenson, N.L. Temperate forest health in an era of emerging megadisturbance. Science 2015,
349, 823–826. [CrossRef] [PubMed]
5. Alencar, A.A.; Solórzano, L.A.; Nepstad, D.C. Modeling forest understory fires in an eastern Amazonian
landscape. Ecol. Appl. 2004, 14, 139–149. [CrossRef]
6. Pausas, J.G. Changes in fire and climate in the eastern Iberian Peninsula (Mediterranean Basin). Clim. Chang.
2004, 63, 337–350. [CrossRef]
7. Kolb, T.E.; Fetting, C.J.; Ayres, M.P.; Bentz, B.J.; Hicke, J.A.; Mathiasen, R.; Stewart, J.E.; Weed, A.S. Observed
and anticipated impacts of drought on forest insects and diseases in the United States. For. Ecol. Manag.
2016, 380, 321–334. [CrossRef]
8. Asner, G.P.; Brodrick, P.G.; Anderson, C.B.; Vaughn, N.; Knapp, D.E.; Martin, R.E. Progressive forest canopy
water loss during the 2012–2015 California drought. Proc. Natl. Acad. Sci. USA 2016, 113, E249–E255.
[CrossRef] [PubMed]
9. Weed, A.S.; Ayres, M.P.; Hicke, J.A. Consequences of climate change for biotic disturbances in North
American forests. Ecol. Monogr. 2013, 83, 441–470. [CrossRef]
10. Laube, J.; Ziegler, K.; Sparks, T.H.; Estrella, N.; Menzel, A. Tolerance of alien plant species to extreme events
is comparable to that of their native relatives. Preslia 2015, 87, 31–53.
11. Bruins, H.J.; Berliner, P.R. Bioclimatic Aridity, Climatic Variability, Drought and Desertification: Definitions and
Management Options; Springer: Dordrecht, The Netherlands, 1998.
12. McIntyre, P.J.; Thorne, J.H.; Dolanc, C.R.; Flint, A.L.; Flint, L.E.; Kelly, M.; Ackerly, D.D. Twentieth-century
shifts in forest structure in California: Denser forests, smaller trees, and increased dominance of oaks.
Proc. Natl. Acad. Sci. USA 2015, 112, 1458–1463. [CrossRef] [PubMed]
13. Clark, J.S.; Iverson, L.; Woodall, C.W.; Allen, C.D.; Bell, D.M.; Bragg, D.C.; Jackson, S.T. The impacts of
increasing drought on forest dynamics, structure, and biodiversity in the United States. Glob. Chang. Biol.
2016, 22, 2329–2352. [CrossRef] [PubMed]
14. Norman, S.P.; Koch, F.H.; Hargrove, W.W. Review of broad-scale drought monitoring of forests: Toward an
integrated data mining approach. For. Ecol. Manag. 2016, 380, 346–358. [CrossRef]Forests 2018, 9, 528 13 of 15
15. Allen, C.D.; Breshears, D.D.; McDowell, N.G. On underestimation of global vulnerability to tree mortality
and forest die-off from hotter drought in the Anthropocene. Ecosphere 2015, 6, 1–55. [CrossRef]
16. Young, D.J.N.; Stevens, J.T.; Earles, J.M.; Moore, J.; Ellis, A.; Jirka, A.L.; Latimer, A.M. Long-term climate and
competition explain forest mortality patterns under extreme drought. Ecol. Lett. 2017, 20, 78–86. [CrossRef]
[PubMed]
17. Byer, S.; Jin, Y. Detecting drought-induced tree mortality in sierra nevada forests with time series of satellite
data. Remote Sens. 2017, 9, 929. [CrossRef]
18. Martínez-Vilalta, J.; Lloret, F.; Breshears, D.D. Drought-induced forest decline: Causes, scope and
implications. Biol. Lett. 2012, 8, 689–691. [CrossRef] [PubMed]
19. Neumann, M.; Mues, V.; Moreno, A.; Hasenauer, H.; Seidl, R. Climate variability drives recent tree mortality
in Europe. Glob. Chang. Biol. 2017, 23, 4788–4797. [CrossRef] [PubMed]
20. Asner, G.P.; Alencar, A. Drought impacts on the Amazon forest: The remote sensing perspective. New Phytol.
2010, 187, 569–578. [CrossRef] [PubMed]
21. Hayes, M.J.; Svoboda, M.D.; Wardlow, B.D.; Anderson, M.C.; Kogan, F. Drought Monitoring: Historical and
Current Perspectives; CRC Press: Boca Raton, FL, USA, 2012.
22. Rao, M.; Silber-Coats, Z.; Powers, S.; Fox, L.; Ghulam, A. Mapping drought-impacted vegetation stress in
California using remote sensing. GISci. Remote Sens. 2017, 54, 185–201. [CrossRef]
23. Park, S.; Im, J.; Park, S.; Rhee, J. Drought monitoring using high resolution soil moisture through multi-sensor
satellite data fusion over the Korean peninsula. Agric. For. Meteorol. 2017, 237, 257–269. [CrossRef]
24. Roy, D.P.; Wulder, M.A.; Loveland, T.R.; Woodcock, C.E.; Allen, R.G.; Anderson, M.C.; Scambos, T.A.
Landsat-8: Science and product vision for terrestrial global change research. Remote Sens. Environ. 2014, 145,
154–172. [CrossRef]
25. Wulder, M.A.; White, J.C.; Loveland, T.R.; Woodcock, C.E.; Belward, A.S.; Cohen, W.B.; Roy, D.P. The global
Landsat archive: Status, consolidation, and direction. Remote Sens. Environ. 2016, 185, 271–283. [CrossRef]
26. Sazib, N.; Mladenova, I.; Bolten, J. Leveraging the Google Earth Engine for drought assessment using Global
Soil Moisture Data. Remote Sens. 2018, 10, 1265. [CrossRef]
27. Liu, H.Q.; Huete, A.A. A feedback based modification of the NDVI to minimize canopy background and
atmospheric noise. IEEE Trans. Geosci. Remote Sens. 1995, 33, 457–465.
28. Guo, X.Y.; Zhang, H.Y.; Wang, Y.Q.; He, H.S.; Wu, Z.F.; Jin, Y.H.; Zhao, J.J. Comparison of the spatio-temporal
dynamics of vegetation between the Changbai Mountains of eastern Eurasia and the Appalachian Mountains
of eastern North America. J. Mt. Sci. 2018, 15, 1–12. [CrossRef]
29. Piao, S.; Mohammat, A.; Fang, J.; Cai, Q.; Feng, J. NDVI-based increase in growth of temperate grasslands
and its responses to climate changes in China. Glob. Environ. Chang. 2006, 16, 340–348. [CrossRef]
30. Wardlow, B.D.; Anderson, M.C.; Verdin, J.P. Remote Sensing of Drought: Innovative Monitoring Approaches;
CRC Press: Boca Raton, FL, USA, 2012.
31. Sriwongsitanon, N.; Gao, H.; Savenije, H.H.G.; Maekan, E.; Saengsawan, S.; Thianpopirug, S. The Normalized
Difference Infrared Index (NDII) as a proxy for soil moisture storage in hydrological modelling. Hydrol. Earth
Syst. Sci. Discuss. 2015, 12, 8419–8457. [CrossRef]
32. Sriwongsitanon, N.; Gao, H.; Savenije, H.H.G.; Maekan, E.; Saengsawan, S.; Thianpopirug, S. Comparing
the Normalized Difference Infrared Index (NDII) with root zone storage in a lumped conceptual model.
Hydrol. Earth Syst. Sci. 2016, 20, 3361–3377. [CrossRef]
33. Beyaztas, U.; Arikan, B.B.; Beyaztas, B.H.; Kahya, E. Construction of prediction intervals for Palmer drought
severity index using bootstrap. J. Hydrol. 2018, 559, 461–470. [CrossRef]
34. Mika, J.; Horvath, S.Z.; Makra, L.; Dunkel, Z. The Palmer Drought Severity Index (PDSI) as an indicator of
soil moisture. Phys. Chem. Earth Parts A/B/C 2005, 30, 223–230. [CrossRef]
35. Hayes, M.; Svoboda, M.D.; Wall, N.; Widhalm, M. The Lincoln declaration on drought indices: Universal
meteorological drought index recommended. Bull. Am. Meteorol. Soc. 2011, 92, 485–488. [CrossRef]
36. Warburton, M.; Schulze, R. Climate Change and the South African Commercial Forestry Sector: An Initial Study;
ACRUcons Report 54; Report to Forestry SA: Pietermaritzburg, South Africa, 2006.
37. Dube, L.T.; Jury, M.R. The nature of climate variability and impacts of drought over KwaZulu-Natal,
South Africa. S. Afr. Geogr. J. 2000, 82, 44–53. [CrossRef]
38. Baudoin, M.A.; Vogel, C.; Nortje, K.; Naik, M. Living with drought in South Africa: Lessons learnt from the
recent El Niño drought period. Int. J. Disaster Risk Reduct. 2017, 23, 128–137. [CrossRef]Forests 2018, 9, 528 14 of 15
39. DAFF (Department of Agriculture, Forestry and Fisheries). Drought Relief Update and the Country’s Readiness
to Import Grains; Department of Agriculture, Forestry and Fisheries: Pretoria, South Africa, 2016.
40. Vogel, C.; van Zyl, K. Drought: In search of sustainable solutions to a persistent, ‘wicked’ problem in
South Africa. In Climate Change Adaptation Strategies—An Upstream-Downstream Perspective; Springer: Cham,
Switzerland, 2016.
41. AgriSA. A Rain Drop in the Drought. Report to the Mulfi-Stakeholder Task Team on the Drought—Agri SA’s Status
Report on the Current Drought Crisis, Viewed; Agri South Africa: Pretoria, South Africa, 2016.
42. Assal, T.J.; Anderson, P.J.; Sibold, J. Spatial and temporal trends of drought effects in a heterogeneous
semi-arid forest ecosystem. For. Ecol. Manag. 2016, 365, 137–151. [CrossRef]
43. Department of Water Affairs and Forestry (DWAF). Water Resource Protection and Assessment Policy
Implementation Process. Resource Directed Measures for Protection of Water Resource: Methodology for the
Determination of the Ecological Water Requirements for Estuaries; Department of Water Affairs and Forestry:
Pretoria, South Africa, 2004.
44. Dovey, S.B. Effects of Clear Felling and Residue Management on Nutrient Pools, Productivity and
Sustainability in a Clonal Eucalypt Stand in South Africa. Ph.D. Thesis, Stellenbosch University, Stellenbosch,
South Africa, 2012.
45. Little, K.; Rolando, C. The impact of vegetation control on the establishment of pine at four sites in the
summer rainfall region of South Africa. S. Afr. For. J. 2001, 192, 31–39. [CrossRef]
46. Mucina, L.; Rutherford, M.C. The Vegetation of South Africa, Lesotho and Swaziland; South African National
Biodiversity Institute: Pretoria, South Africa, 2006.
47. Luvuno, L.; Kotze, D.; Kirkman, K. Long-term landscape changes in vegetation structure: Fire management
in the wetlands of KwaMbonambi, South Africa. Afr. J. Aquat. Sci. 2016, 41, 279–288. [CrossRef]
48. Lesch, W.; Scott, D.F. The response in water yield to the thinning of Pinus radiata, Pinus patula and Eucalyptus
grandis plantations. For. Ecol. Manag. 1997, 99, 295–307. [CrossRef]
49. Schaaf, C.B.; Gao, F.; Strahler, A.H.; Lucht, W.; Li, X.; Tsang, T.; Strugnell, N.C.; Zhang, X.;
Jin, Y.; Muller, J.P.; et al. First operational BRDF, albedo nadir reflectance products from MODIS.
Remote Sens. Environ. 2002, 83, 135–148. [CrossRef]
50. Salmon, B.P.; Olivier, J.C.; Kleynhans, W.; Wessels, K.J.; van den Bergh, F.; Steenkamp, K.C. The use of a
multilayer perceptron for detecting new human settlements from a time series of MODIS images. Int. J. Appl.
Earth Obs. Geoinform. 2011, 13, 873–883. [CrossRef]
51. Reinecker, M.M.; Suarez, M.J.; Gelaro, R.; Todling, R.; Bacmeister, J.; Liu, E.; Bosilovich, M.G.; Schubert, S.D.;
Takacs, L.; Kim, G.K.; et al. MERRA: NASA’s modern-era retrospective analysis for research and applications.
J. Clim. 2011, 24, 3624–3648. [CrossRef]
52. Halpert, M.S.; Ropelewski, C.F. Surface temperature patterns associated with the Southern Oscillation.
J. Clim. 1992, 5, 577–593. [CrossRef]
53. Ropelewski, C.F.; Halpert, M.S. Global and regional scale precipitation patterns associated with the El
Niño/Southern Oscillation. Mon. Weather Rev. 1987, 115, 1606–1626. [CrossRef]
54. Van der Schrier, G.; Barichivich, J.; Briffa, K.R.; Jones, P.D. A scPDSI-based global data set of dry and wet
spells for 1901–2009. J. Geophys. Res. Atmos. 2013, 118, 4025–4048. [CrossRef]
55. Jong, R.; Verbesselt, J.; Schaepman, M.E.; de Bruin, S. Trend changes in global greening and browning:
Contribution of short-term trends to longer-term change. Glob. Chang. Biol. 2012, 18, 642–655. [CrossRef]
56. Birsan, M.V.; Molnar, P.; Burlando, P.; Pfaundler, M. Streamflow trends in Switzerland. J. Hydrol. 2005, 314,
312–329. [CrossRef]
57. Alcaraz-Segura, D.; Liras, E.; Tabik, S.; Paruelo, J.; Cabello, J. Evaluating the consistency of the 1982–1999
NDVI trends in the Iberian Peninsula across four time-series derived from the AVHRR sensor: LTDR,
GIMMS, FASIR, and PAL-II. Sensors 2010, 10, 1291–1314. [CrossRef] [PubMed]
58. Pohlert, T. Non-Parametric Trend Tests and Change-Point Detection. 2018. Available online: https://cran.r-
project.org/web/packages/trend/trend.pdf (accessed on 12 April 2018).
59. Jiang, L.L.; Jiapaer, G.; Bao, A.M.; Guo, H.; Ndayisaba, F. Vegetation dynamics and responses to climate
change and human activities in central Asia. Sci. Total Environ. 2017, 599, 967–980. [CrossRef] [PubMed]
60. Fauchereau, N.; Trzaska, S.; Rouault, M.; Richard, Y. Rainfall variability and changes in southern Africa
during the 20th century in the global warming context. Nat. Hazards 2003, 29, 139–154. [CrossRef]Forests 2018, 9, 528 15 of 15
61. Rouault, M.; Richard, Y. Intensity and spatial extension of drought in South Africa at different time scales.
Water SA 2003, 29, 489–500. [CrossRef]
62. Tollefson, J. 2015 breaks heat record: Pacific Ocean warming helped to make last year the hottest in history.
Nature 2016, 529, 450–451. [PubMed]
63. Richard, Y.; Trzaska, S.; Roucou, P.; Rouault, M. Modification of the southern African rainfall
variability/ENSO relationship since the late 1960s. Clim. Dyn. 2000, 16, 883–895. [CrossRef]
64. Wang, J.; Rich, P.M.; Price, K.P. Temporal responses of NDVI to precipitation and temperature in the central
Great Plains, USA. Int. J. Remote Sens. 2003, 24, 2345–2364. [CrossRef]
65. Udelhoven, T.; Stellmes, M.; del Barrio, G.; Hill, J. Assessment of rainfall and NDVI anomalies in Spain
(1989–1999) using distributed lag models. Int. J. Remote Sens. 2009, 30, 1961–1976. [CrossRef]
66. Liu, G.; Liu, H.; Yin, Y. Global patterns of NDVI-indicated vegetation extremes and their sensitivity to climate
extremes. Environ. Res. Lett. 2013, 8. [CrossRef]
67. Bachmair, S.; Tanguy, M.; Hannaford, J. How well do meteorological indicators represent agricultural and
forest drought across Europe? Environ. Res. Lett. 2018, 13, 34–42. [CrossRef]
68. Song, Y.; Ma, M. A statistical analysis of the relationship between climatic factors and the Normalized
Difference Vegetation Index in China. Int. J. Remote Sens. 2011, 32, 3947–3965. [CrossRef]
69. Huemmrich, K.F.; Kinoshita, G.; Gamon, J.A.; Houston, S.; Kwon, H.; Oechel, W.C. Tundra carbon balance
under varying temperature and moisture regimes. J. Geophys. Res. Biogeosci. 2010, 115. [CrossRef]
70. Formica, A.F.; Burnside, R.J.; Dolman, P.M. Rainfall validates MODIS-derived NDVI as an index
of spatio-temporal variation in green biomass across non-montane semi-arid and arid Central Asia.
J. Arid Environ. 2017, 142, 11–21. [CrossRef]
71. Crous, C.J.; Greyling, I.; Wingfield, M.J. Dissimilar stem and leaf hydrailic traits suggest varying drought
tolerance among co-occurring Eucalyptus grandis × E.urophylla clones. South. For. J. For. Sci. 2018, 80, 175–184.
[CrossRef]
72. Forestry South Africa. Climate Change: A Forest for Forestry. 2016. Available online: http://www.forestry.
co.za/climate-change-a-forecast-for-forestry/ (accessed on 10 April 2018).
73. Huang, K.; Zhou, T.; Zhao, X. Extreme drought-induced trend changes in MODIS EVI time series in Yunnan,
China. IOP Conf. Ser. Earth Environ. Sci. 2014, 17, 012070. [CrossRef]
74. Piao, S.; Fang, J.; Zhou, L.; Ciais, P.; Zhu, B. Variations in satellite-derived phenology in China’s temperate
vegetation. Glob. Chang. Biol. 2006, 12, 672–685. [CrossRef]
75. Eksteen, A.B.; Grzeskowiak, V.; Jones, N.B.; Pammenter, N.W. Stomatal characteristics of Eucalyptus grandis
clonal hybrids in response to water stress. South. For. J. For. Sci. 2013, 75, 105–111. [CrossRef]
76. Herrero, A.; Zamora, R. Plant responses to extreme climatic events: A field test of resilience capacity at the
southern range edge. PLoS ONE 2014, 9. [CrossRef] [PubMed]
© 2018 by the authors. Licensee MDPI, Basel, Switzerland. This article is an open access
article distributed under the terms and conditions of the Creative Commons Attribution
(CC BY) license (http://creativecommons.org/licenses/by/4.0/).You can also read


