Drought years in peatland rewetting: rapid vegetation succession can maintain the net CO2 sink function - Biogeosciences
←
→
Page content transcription
If your browser does not render page correctly, please read the page content below
Biogeosciences, 18, 917–935, 2021
https://doi.org/10.5194/bg-18-917-2021
© Author(s) 2021. This work is distributed under
the Creative Commons Attribution 4.0 License.

Drought years in peatland rewetting: rapid vegetation succession
can maintain the net CO2 sink function
Florian Beyer1, , Florian Jansen2 , Gerald Jurasinski2 , Marian Koch3, , Birgit Schröder2 , and Franziska Koebsch2,
1 Geodesy  and Geoinformatics, Faculty for Agricultural and Environmental Sciences,
Rostock University, 18059 Rostock, Germany
2 Landscape Ecology, Faculty for Agricultural and Environmental Sciences, Rostock University, 18059 Rostock, Germany
3 Soil Physics, Faculty for Agricultural and Environmental Sciences, Rostock University, 18059 Rostock, Germany
 These authors contributed equally to this work.
 deceased, 15 April 2020

Correspondence: Florian Beyer (florian.beyer@uni-rostock.de)

Received: 9 June 2020 – Discussion started: 10 July 2020
Revised: 19 October 2020 – Accepted: 5 December 2020 – Published: 8 February 2021

Abstract. The rewetting of peatlands is regarded as an im-        CO2 release. Altogether, the restored fen remained a net CO2
portant nature-based climate solution and intended to recon-      sink in the year of drought, though net CO2 sequestration was
cile climate protection with the restoration of self-regulating   lower than in other years. CH4 emissions were 20 % below
ecosystems that are resistant to climate impacts. Although        average on an annual basis, though stronger reduction effects
the severity and frequency of droughts are predicted to in-       occurred from August onwards, when daily fluxes were 60 %
crease as a consequence of climate change, it is not well un-     lower than in reference years.
derstood whether such extreme events can jeopardize rewet-           Our study reveals an important regulatory mechanism of
ting measures. The goal of this study was to better under-        restored fens to maintain their net CO2 sink function even in
stand drought effects on vegetation development and the ex-       extremely dry years. It appears that, in times of more fre-
change of the two important greenhouse gases CO2 and CH4 ,        quent climate extremes, fen restoration can create ecosys-
especially in rewetted fens. Based on long-term reference         tems resilient to drought. However, in order to comprehen-
records, we investigated anomalies in vegetation dynamics,        sively assess the mitigation prospects of peatland rewetting
CH4 emissions, and net CO2 exchange, including the compo-         as a nature-based climate solution, further research needs to
nent fluxes of ecosystem respiration (Reco ) and gross ecosys-    focus on the long-term effects of such extreme events beyond
tem productivity (GEP), in a rewetted fen during the extreme      the actual drought period.
European summer drought in 2018. Drought-induced vege-
tation dynamics were derived from remotely sensed data.
   Since flooding in 2010, the fen was characterized by
a patchy mosaic of open-water surfaces and vegetated              1   Introduction
areas. After years of stagnant vegetation development,
                                                                  Peatlands constitute the largest terrestrial C store and exert
drought acted as a trigger event for pioneer species such as
                                                                  significant feedback effects on the climate system (Gorham,
Tephroseris palustris and Ranunculus sceleratus to rapidly
                                                                  1991; Frolking and Roulet, 2007; Yu et al., 2010). Under
close persistent vegetation gaps. The massive spread of veg-
                                                                  the massive human disturbance of recent times, the global
etation assimilated substantial amounts of CO2 . In 2018, the
                                                                  peatland biome has shifted from a net sink to a source of
annual GEP budget increased by 20 % in comparison to av-
                                                                  greenhouse gases (GHGs) (Leifeld et al., 2019). The shift
erage years (2010–2017). Reco increased even by 40 %, but
                                                                  in peatland climate function is mainly a result of extensive
enhanced photosynthetic CO2 sequestration could compen-
                                                                  drainage: when water levels fall, oxygen availability initi-
sate for half of the drought-induced increase in respiratory
                                                                  ates a cascade of organic matter breakdown that culminates

Published by Copernicus Publications on behalf of the European Geosciences Union.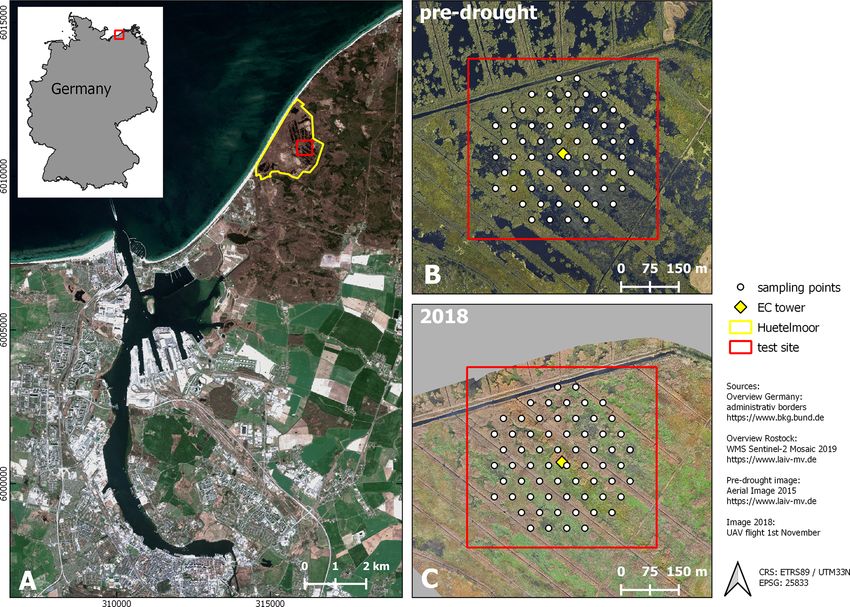
918                                                                      F. Beyer et al.: Drought years in peatland rewetting

in peat decomposition (Freeman et al., 2004; Fenner and            peat areas fallen dry (Ma et al., 2013). Altogether, years of
Freeman, 2011). In this way, drainage turns peatlands from         drought may reduce CH4 emissions and turn peatlands from
CO2 sinks to CO2 sources. Among minerotrophic peatlands            net CO2 sinks to sources of CO2 (Lafleur et al., 2003; Lund
(fens) in central Europe, 90 % have been drained, most of          et al., 2012), whereby the magnitude of effects can be further
them for agricultural purposes (Pfadenhauer and Grootjans,         modulated by plant community composition (Robroek et al.,
1999; Moen et al., 2017). Drained peatlands rank among the         2017).
largest CO2 sources from agriculture and forestry in many             Worldwide 43–51 Mha of peatlands is drained (Joosten
European countries, even when they cover only a small per-         et al., 2016; Leifeld and Menichetti, 2018; Leifeld et al.,
centage of the national areas (Tiemeyer et al., 2016; Tubiello     2019). Rewetting these areas is essential to achieve our cli-
et al., 2016). A reduction of these emissions is urgently re-      mate goals (Humpenöder et al., 2020; Günther et al., 2020).
quired because drained peatlands consume 10 %–41 % of the          However, estimates on the mitigation potential of nature-
remaining emission budget to maintain global warming be-           based climate solutions often lack any consideration for
low 2 ◦ C (Leifeld et al., 2019).                                  how future climate change will impact peatland function-
   Rewetting is a common measure, not only to restore the          ing and greenhouse gas exchange. In view of increasing fre-
natural habitat function of peatlands, but also to stop CO2        quency and severity of climatic extreme events (Pachauri
emissions and thereby to mitigate climate change (Leifeld          et al., 2014), drought has the potential to jeopardize the cli-
and Menichetti, 2018). Peatland conservation and rewetting         mate mitigation goals of peatland rewetting (Lavendel, 2003;
is therefore considered one of the major natural climate so-       Harris et al., 2006). Yet, our understanding of drought ef-
lutions (Griscom et al., 2017; Leifeld and Menichetti, 2018)       fects on rewetted peatlands is largely incomplete, which adds
and a key measure to return the terrestrial land system to its     considerable uncertainty to the mitigation potential achiev-
natural net CO2 sink function (Humpenöder et al., 2020). As        able through natural climate solutions under a changing cli-
rewetting re-establishes anaerobic conditions, it diminishes       mate. The majority of drought studies are designed as meso-
CO2 emissions from peat degradation. However, rewetting            cosm and/or treatment experiments and address near-natural
may also resume the emissions of methane (CH4 ), a strong          bogs (Shurpali et al., 1995; Alm et al., 1999; Arneth et al.,
yet short-lived greenhouse gas (Wilson et al., 2016). The          2002; Lafleur et al., 2003; Lund et al., 2012). As hydrolog-
net cooling effect of peatland rewetting is essentially accom-     ical and vegetation differ between peatland types, the same
plished by the savings of CO2 emissions, which is why cli-         drought-related mechanisms may not necessarily occur in
mate mitigation measures in peatlands focus primarily on the       fens (Sulman et al., 2010). Even comparisons with pristine
reduction of the CO2 source (Tiemeyer et al., 2020). How-          fens may be misleading, because the drainage–rewetting se-
ever, the warming pulse caused by concurrent CH4 emissions         quence irreversibly affects ecosystem functioning of restored
can retard the desired mitigation effect (Günther et al., 2020).   fens (Koch et al., 2017). Hence, a better understanding of
   The successful implementation of peatland rewetting can         drought-induced processes in restored fens is needed.
be challenging, as the degradation processes provoked by              Here, we aim to elucidate the in situ effects of drought
drainage are largely irreversible. Under intense compaction        on vegetation development, as well as the exchange of CO2
and decomposition, the peat surface can subside for several        and CH4 in rewetted fens. To this end, we investigated the
decimeters (Leifeld et al., 2011), and rewetted fen areas can      impact of the extreme summer drought 2018 on a rewetted
easily develop to shallow lakes with average water depths of       degraded fen in northeastern Germany. The drought event
20–60 cm (Steffenhagen et al., 2012). Slow or stagnant veg-        caused the water level to drop below the ground surface,
etation development withholds the extensive spread of peat-        for the first time since rewetting, and therefore provided a
land species as a prerequisite for CO2 uptake and C accumu-        good opportunity to investigate our research question. Veg-
lation (Timmermann et al., 2009; Koch et al., 2017).               etation development and the exchange of CO2 and CH4 at
   Given the importance of hydrological conditions for peat        our particular fen site have been monitored since the rewet-
conservation and formation, meteorological drought can also        ting started in 2010, which offers a valuable long-term ref-
severely impact peatland functioning (Dise, 2009). Analo-          erence record for the assessment of drought-induced effects.
gously to human-induced drainage, drought implies a lower-         Vegetation dynamics were evaluated on both the canopy and
ing of the groundwater level, which may enhance ecosystem          species level. For the canopy level, we used satellite-derived
respiration (Reco ) and peat consumption (Alm et al., 1999;        remote sensing products such as the enhanced vegetation in-
Knorr et al., 2008; Lund et al., 2012). Further, gross ecosys-     dex (EVI) and the fraction of absorbed photosynthetically ac-
tem productivity (GEP) may decrease as plant stress due to         tive radiation (fPAR). Information on the species level was
drought limits photosynthetic CO2 uptake (Shurpali et al.,         obtained through vegetation mapping derived from multi-
1995; Schreader et al., 1998; Arneth et al., 2002; Lafleur         sensor data of an unmanned aerial system (UAS). Drought
et al., 2003; Lund et al., 2012; Olefeldt et al., 2017). At the    effects on greenhouse gas exchange, including the CO2 com-
same time, temporary drought can lower the obligate anaero-        ponent fluxes Reco , and GEP were investigated based on a
bic production of CH4 (Morozova and Wagner, 2007; Knorr            multi-year record of eddy covariance measurements (Mont-
et al., 2008) and increase the oxic consumption of CH4 in the      gomery, 1948; Baldocchi, 2003). The CO2 flux time series

Biogeosciences, 18, 917–935, 2021                                                      https://doi.org/10.5194/bg-18-917-2021
F. Beyer et al.: Drought years in peatland rewetting 919
was also used to infer the start and end of the carbon uptake EVI data were retrieved from the MOD13A1 and
period (CUP) as a proxy to derive drought effects on plant MYD13A1 product, and fPAR data were retrieved from
phenology. In addition, we deployed a simple GEP light-use MCD15A3H, using the NASA AppEEARS tool (https:
efficiency model (Hunt, 1994; Gower et al., 1999) to further //lpdaacsvc.cr.usgs.gov/appeears/, last access: 12 Octo-
elucidate the biophysical mechanisms that control photosyn- ber 2020). The time series created spanned the period 2010–
thetic CO2 uptake during periods of drought. This interdisci- 2018, and the 500 m pixel size covered the eddy covariance
plinary long-term approach, including ecosystem-scale mon- flux climatology (Figs. 1 and B1, Appendix B). We com-
itoring of vegetation development and greenhouse gas ex- bined data from both MODIS satellites, Aqua and Terra, and
change, allowed us to track the response mechanisms of a thereby obtained time series with 8 d intervals for EVI and
rewetted fen to a severe drought event and thereby to infer 4 d intervals for fPAR. The data records were filtered accord-
insights into the resilience of this novel ecosystem in times ing to pixel reliability and pixelwise quality assessment. Sub-
of more frequently upcoming climate extremes. sequently, data gaps were filled by linear interpolation and
the time series was smoothed with an exponentially weighted
function (span = 5) to reduce unwanted scatter.
2 Methods
2.3 Vegetation mapping
2.1 Site description
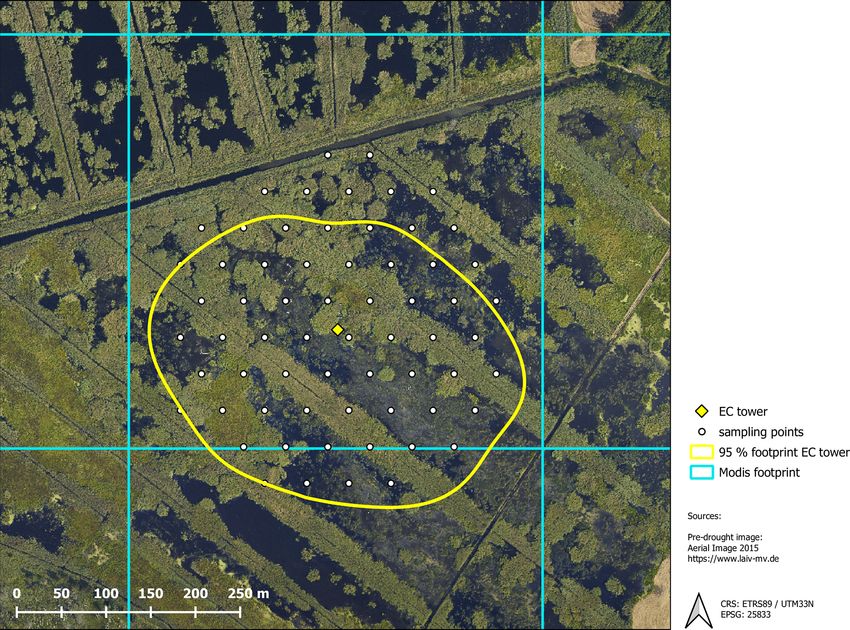
The study area “Rodewiese” (WGS84: 54.211◦ N, 2.3.1 Preprocessing of the unmanned aerial system
12.178◦ E) is a coastal paludification fen in the nature data
reserve “Heiligensee und Hütelmoor”, located in northeast-
ern Germany (Fig. 1). Uncrewed aerial system data were collected to classify plant
The area has been heavily drained for grassland use since composition and distribution of the dominant species. In or-
the 1970s with water levels down to 1.6 m below ground. Un- der to assess the drought effect on vegetation, the changes
der drainage, the peat was degraded strongly and can today observed in 2018 were related to the state prior to drought as
be described as sapric histosol. In winter 2009/2010, the site described in Koch et al. (2017). Accordingly, the study area
was rewetted with the goal to stop peat decomposition and to and processing routines for 2018 were harmonized to the best
create a self-regulating ecosystem and water fowl habitat. As possible degree with the approach used in Koch et al. (2017).
a result of rewetting, the site became inundated year-round In contrast to Koch et al. (2017), not only normal RGB data
and the canopy turned to a patchy mosaic of different dom- and texture indices were available but also additional sensors
inant species and open-water areas. Since then, the vegeta- as well as data types (additional wavelengths and geometrical
tion has been dominated by stands of competitive emergent information) were used.
macrophytes such as common reed (Phragmites australis) Aerial images were acquired in late autumn (1 Novem-
and lesser pond sedge (Carex acutiformis) as well as grey ber 2018) using a fixed-wing unmanned aerial system (UAS,
and sea club rush (Schoenoplectus tabernaemontani and Bol- Sensefly eBee Plus). As the UAS can operate only one cam-
boschoenus maritimus). Both of the two latter species present era at a time, high-resolution true-color images (SenseFly
relics of former brackish impact from the nearby Baltic Sea. S.O.D.A, 20 Mpix), multispectral images (Parrot Sequoia,
Vegetation patterns were mostly stable in the years following 4× 1.2 Mpix), and thermal images (SenseFly thermoMAP,
inundation with a slight tendency towards higher patch com- 0.3 Mpix) were taken during subsequent flights within a time
pactness. Koch et al. (2017) provide a detailed description of frame where insolation can be considered stable. The ac-
the vegetation development of 2011 until 2014. quired images were then mosaicked with the photogrammet-
ric software Pix4D (Fig. A1, Appendix A). The multisensor
2.2 Assessing canopy dynamics data set was processed as described in Beyer et al. (2019)
and, eventually, consisted of 107 bands: three RGB bands,
Satellite-derived vegetation indices provide information on four multispectral bands, and one thermal band, as well as
plant phenology and coverage on the canopy level, the spa- one digital surface model (DSM), 74 spectral indices, and
tial scope of which fits well to that of the eddy covariance 24 textural indices. The DSM was derived photogrammetri-
approach. For this study, we obtained the enhanced vegeta- cally using RGB color information (Fig. A1) and can, due
tion index (EVI) and the fraction of absorbed photosyntheti- to the flat topography of the study area, be interpreted as
cally active radiation (fPAR) from MODIS (Moderate Reso- plant height proxy. The texture indices were calculated as
lution Image Spectrometer). The EVI is especially suited to in Koch et al. (2017) for each RGB band. The 74 spec-
resolve variations at the upper end of the canopy reflection tral indices were selected using the index database (https:
range (Huete et al., 2002) and has been successfully used //www.indexdatabase.de, last access: 5 June 2020, Henrich
in past studies to describe subtle vegetation dynamics in our et al., 2012, 2009). The main reason to select such a high
study area (Koebsch et al., 2013). number of spectral indices was not only to improve the clas-
sification accuracy but also to get better knowledge of the
https://doi.org/10.5194/bg-18-917-2021 Biogeosciences, 18, 917–935, 2021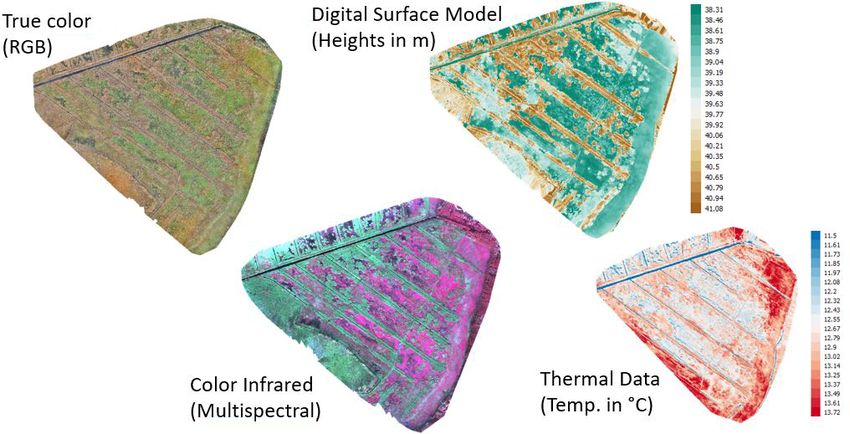
920                                                                            F. Beyer et al.: Drought years in peatland rewetting

Figure 1. Study site. (A) Location (city of Rostock). (B) August 2015 and (C) November 2018: aerial photograph with vegetation survey
grid. From 2010 to 2017 (pre-drought), the fen was almost permanently inundated. At that time, the canopy consisted of a patchy mosaic of
open-water and vegetated areas. During the drought in 2018, the site fell completely dry, except for the former drainage ditches.

importance of the specific wavelengths used within the mul-            occurrence per plot). These six dominant species were, in
tisensor data set. This approach continues the earlier study           concert with bare peat and open water, incorporated as sur-
from Beyer et al. (2019). All bands, indices, and their mean-          face classes in the following analysis.
ing are listed in Appendix C (Table C1). Further, a Python
script and an overview of the used indices can be found on             2.3.3    Vegetation classification
https://github.com/florianbeyer/SpectralIndices, last access:
24 January 2021.                                                       To classify the vegetation cover, we used the random forest
                                                                       (RF; Breiman, 2001) classifier with 500 trees and a mini-
2.3.2   Vegetation survey                                              mum branching depth of 2. RF has proven to be a robust and
                                                                       efficient machine learning classification approach in previ-
Likewise, with the study of Koch et al. (2017), vegeta-                ous remote sensing studies (Beyer et al., 2015; Belgiu and
tion sampling in 2018 was conducted within an equidistant              Drăguţ, 2016; Beyer et al., 2019). On the basis of the vegeta-
grid of 64 circular plots, each with a 1 m radius (Fig. 1).            tion mapping, a calibration data set was generated in GIS in
The re-survey was conducted at the end of September and                order to train the RF. We assessed the performance of the RF
included total plant coverage as well as species cover-                model with an independent validation data set. The RF clas-
age (%). Among the 36 species found, only Phragmites                   sification algorithm achieved an overall accuracy of 99.84 %.
australis, Schoenoplectus tabernaemontani, Bolboschoenus               Also, the single class accuracies were high and ranged be-
maritimus, Tephroseris palustris, Ranunculus sceleratus, and           tween 98 % and 100 %. In addition, we extracted the impor-
Carex acutiformis were occurring in dominant stands. Here,             tance of every single band in the multisensor data set us-
dominance was defined by (1) the per-plot abundance and                ing the GINI coefficient (Archer and Kimes, 2008) in order
(2) the occurrence frequency across all 64 sample points (oc-          to assess the most important input variables. The results of
curring more than 30 times in 65 plots or more than 50 %               the importance analysis are summarized in Table C2 (Ap-

Biogeosciences, 18, 917–935, 2021                                                           https://doi.org/10.5194/bg-18-917-2021
F. Beyer et al.: Drought years in peatland rewetting 921
pendix C). The classification script can be found at https: diation threshold < 5 W m−2 ). Subsequently, we calculated
//github.com/florianbeyer/RandomForest-Classification, last GEP from the difference between the measured daytime NEE
access: 24 January 2021. and modeled Reco . Input variables for the ANN included air
temperature, water level, EVI, as well as fuzzy-transformed
2.4 CO2 flux processing variables for different seasons. The ANN was built from one
hidden layer and four nodes. Validation of the ANN yielded
The exchange of CO2 and CH4 was determined with the eddy a determination coefficient for the nighttime fluxes of 0.88.
covariance approach, which provides a continuous time se-
ries of half-hourly fluxes on an ecosystem scale. The setup 2.5 Auxiliary data
comprised open-path sensors for CO2 and CH4 molar density
(LI-7500 and LI-7700 from LI-COR, Lincoln, NE, USA) and Meteorological measurements since 2009 were conducted
a three-dimensional sonic anemometer (CSAT3, Campbell directly at the eddy covariance tower and logged in
Scientific, Logan, UT, USA) measuring wind velocities and 30 min intervals. Measurements included (1) global radi-
sonic temperature. All signals were recorded by a CR3000 ation (Rg ), measured with a pyranometer (CMP-3; Kipp
Micrologger (Campbell Scientific, Logan, Utah) with a scan and Zonen, Delft, the Netherlands); (2) air temperature
rate of 10 Hz. Half-hourly fluxes of CO2 and CH4 were pro- (HMP45C, Vaisala, Vantaa, Finland); (3) and precipitation
cessed with the software EddyPro version 6.0.0 (LI-COR, (52203 RM Young). Minor data gaps were filled with data
Lincoln, NE, USA) using the common corrections for open- from a nearby station of the German Weather Service (DWD)
path eddy covariance setups. Refer to Koebsch et al. (2013) 7.5 km from our field station (https://cdc.dwd.de/portal/, last
and Koebsch et al. (2015) for more details on the setup and access: 24 June 2019, station ID: 4271). DWD weather data
the complete sequence of flux processing steps. The source were also used for the meteorological longtime reference pe-
area of the measured greenhouse gas fluxes was determined riod 1999–2017.
with the analytical footprint model of Kormann and Meixner The water level time series was reconstructed back to
(2001) and cumulated over the course of the year. According 2010 from manual discrete measurements and pressure-
to the resulting footprint climatology, 90 % of the measured compensated automated measurements (Onset U20-001-01
gas exchange comes from within a 200 m distance around the water level data logger, Onset, Bourne, USA). The final wa-
eddy covariance tower (Fig. B1, Appendix B). ter level time series is referenced to the average elevation
Data gaps in the CO2 and CH4 flux time series were filled height of the fen, with positive values indicating water levels
using artificial neural networks (ANNs; Bishop, 1995) based above surface.
on the common back-propagation algorithm incorporated in In addition, we used the carbon uptake period (CUP) as a
the R package neuralnet (R Core Team, 2019; Fritsch, 2016). proxy to describe potential drought effects on plant phenol-
Gap filling was conducted in two steps: (1) for small data ogy. The start and end dates of the CUP were extracted from
gaps < 24 h, we set up several ANNs that predicted half- a 20 d moving window sliding over the time series of daily
hourly fluxes separately for each year. (2) For larger data NEE sums. CUP started from the day on, when the fen acted
gaps > 24 h, we aggregated the data set daywise and set as a net CO2 sink for at least 20 d in a row; i.e, all daily NEE
up a single ANN that encompassed all available measure- sums within the moving windows were negative. CUP ended
ments from 2009–2018. Input variables for all ANNs in- from the day on, when the fen acted as a net CO2 source
cluded air temperature, global radiation, water level, and for at least 20 d in a row; i.e, all daily NEE sums within the
EVI, and fuzzy-transformed variables for time of day and moving windows were positive.
season. A simple architecture comprising one hidden layer
and three to four nodes proved applicable for all ANNs. Val- 2.6 Light use efficiency modeling
idation of the ANNs with an independent data subset yielded
determination coefficients ranging from 0.46–0.83 for half- The light use efficiency (LUE) of GEP relates plant CO2 as-
hourly fluxes and 0.77–0.93 for daily aggregated fluxes. similation to the light absorption capacity of the canopy and
The net ecosystem exchange (NEE) of CO2 was further was originally conceived as an ecosystem-specific constant
partitioned into its two component fluxes gross ecosystem (Monteith, 1972; Heinsch et al., 2003). However, LUE also
productivity (GEP) and ecosystem respiration (Reco , Eq. 1). varies over the course of the season and can be attenuated
through the plant-physiological response to environmental
NEE = Reco − GEP (1) stresses (Heinsch et al., 2003; Connolly et al., 2009). LUE
is given as
Hereby, GEP represents the photosynthetic sequestration of
CO2 from the atmosphere into the canopy, whilst Reco rep- GEP = · APAR, (2)
resents the CO2 release by autotrophic and heterotrophic
respiration into the atmosphere. We partitioned NEE into where is the light use efficiency parameter (g C MJ−1 ).
its component fluxes with an ANN algorithm that predicted GEP is derived from the eddy covariance approach and here
Reco from the daily aggregated nighttime fluxes (global ra- implemented in g CO2 -C m−2 d−1 . APAR is the absolute
https://doi.org/10.5194/bg-18-917-2021 Biogeosciences, 18, 917–935, 2021922 F. Beyer et al.: Drought years in peatland rewetting value of absorbed photosynthetically active radiation (PAR) in MJ m−2 d−1 and is given as APAR = ↓ PAR · fPAR, (3) where ↓PAR is incident photosynthetically active radiation in MJ m−2 d−1 . fPAR is the remote-sensing-derived fraction of the photosynthetically active radiation absorbed by the canopy within the eddy covariance footprint. 3 Results and discussion 3.1 Meteorological and hydrological conditions in 2018 At the study site, 2018 was among the warmest and sunni- est years within the reference period (1999–2018; Fig. 2), with only 2003 sharing the same low precipitation sums (457 mm). Hence, 2018 was also the driest year since rewet- ting of the fen started in 2010. Mean annual temperature amounted to 10.8 ◦ C, which was 1 K above the long-term average of the reference period. Global radiation in 2018 summed up to 2370 kW m−2 , which exceeded the long-term radiation sum by 213 kW m−2 . Total precipitation sum in 2018 was 160 mm below the long-term average total of 617 mm (Fig. 2b). Drought, excessive heat, and radiation in 2018 occurred primarily from April to July. During these months, the mean temperature exceeded the long-term average April–July tem- perature (14.0 ◦ C) by 1.9 K. The global radiation sum dur- ing April–July 2018 exceeded the average radiation sum by 140 kW m−2 (long-term average: 1277 kW m−2 ). Further- more, precipitation from April to July 2018 summed up to only 111 mm, which is less than half of the rainfall occur- ring in average years (228 mm). In particular, May 2018 was extraordinarily dry with only 5 mm of rainfall (average May rainfall: 51 mm). The spatially averaged, mean annual water level (Fig. 3a and Table 1) in 2018 was 17 cm above surface level (a.s.l.), which is in the lower range of post-rewetting water levels (20–40 cm a.s.l. from 2010–2018). However, meteorological conditions induced a pro- nounced hydrological variation during the course of 2018. As a result of unusually high precipitation in the previous year (746 mm), water level was still extraordinarily high (∼ 0.4 m a.s.l.) until early spring 2018 but decreased rapidly due to rainfall deficit starting in April. Hence, the filled wa- ter reservoirs from 2017’s high rates of rainfall contributed to the postponement of the hydrological drought and thereby Figure 2. Air temperature (a), cumulative precipitation (b), and cu- buffered the effect of the meteorological drought, at least un- mulative global radiation (c) over the course of the year. Variables til April 2018. Whilst the fen had been permanently inun- are represented as the black line for 2018 whereas the grey shading dated since the rewetting in 2010, the water level dropped represents the variable range (minimum–maximum) throughout the below ground surface in August 2018. A water level mini- reference period 1999–2017. mum of 0.4 m below surface level (b.s.l.) was met in October. Biogeosciences, 18, 917–935, 2021 https://doi.org/10.5194/bg-18-917-2021
F. Beyer et al.: Drought years in peatland rewetting                                                                                      923

Figure 3. Water level (a), enhanced vegetation index (EVI, b), absorbed photosynthetically active radiation (fPAR, c), and light use efficiency
(, d) over the course of the year. Values measured in 2018 are represented as black lines, whereas the grey shading represents the value
range (minimum–maximum) throughout the reference period 2010–2017. Due to large uncertainties occurring during the dormancy period,
 is presented only for the growing season.

Table 1. Annual means and sums of certain climate and biophysical parameters from the observation period 2010–2018 (EVI: enhanced
vegetation index; fPAR: fraction of absorbed photosynthetically active radiation; LUE: light use efficiency; CUP: carbon uptake period;
DOY: day of year).

 Year     Temperature     Precipitation    Global radiation     Water level            EVI            fPAR             LUE           CUP
          annual mean      annual sum          annual sum      annual mean     annual mean     annual mean      annual mean      start   end
                 (◦ C)           (mm)           (kW m−2 )             (cm)                                        g C MJ−1      DOY DOY
 2010              8.1             706            2096.399               36             0.28           0.536           0.177      145      296
 2011              9.8             955            2109.110               41             0.25           0.509           0.120      113      294
 2012              9.2             490            2103.767               20             0.26           0.505           0.137      136      291
 2013              9.4             611            2183.956               24             0.27           0.537           0.121      142      280
 2014             10.7             553            2224.981               19             0.28           0.547           0.115      114      266
 2015             10.3             611            2223.394               26             0.27           0.518           0.132      130      278
 2016             10.1             479            2160.338               25             0.27           0.524           0.125      131      245
 2017             10.1             746            2075.759               39             0.27           0.521           0.101      138      286
 2018             10.7             457            2369.617               17             0.32           0.603           0.120      130      307

https://doi.org/10.5194/bg-18-917-2021                                                                Biogeosciences, 18, 917–935, 2021
924 F. Beyer et al.: Drought years in peatland rewetting
3.2 Vegetation response to drought level dropped below 0.2 m a.s.l. At that time, extensive veg-
etation areas were already affected by drought, even if the
3.2.1 Species shift spatially averaged water level was still relatively high. Dur-
ing the following months, the subsequent downward trend
Rewetting of the fen in 2010 initiated a shift towards in EVI slowed down considerably. From September 2018
flooding-resistant species (Koch et al., 2017). However, these on, EVI was distinctively higher than normally indicating
dynamics were confined only to the first 1–2 years after an extension of the growing season until late in the year.
rewetting, whilst vegetation development stagnated in the Mean annual EVI of 0.32 in 2018 compared to the mean of
following years and provided a stable baseline for the in- time series 2010–2017 0.27 (SD = 0.009) supports this con-
vestigation of drought effects. In 2014 (Fig. 4a), which clusion (Table 1). Interestingly, the drought-induced canopy
serves as reference year for the vegetation situation prior anomalies became less apparent in the fraction of absorbed
to drought, the fen canopy consisted of Phragmites aus- photosynthetically active radiation (fPAR). In comparison to
tralis (47.8 %), Schoenoplectus tabernaemontani (21.0 %), EVI, the seasonal dynamics in fPAR formed a broad plateau
open water (20.5 %), Carex acutiformis (5.6 %), and Bol- with maxima up to 0.90 that lasted from May to September
boschoenus maritimus (5.1 %). Field observations proved (Fig. 3d). This indicates that there is little variation in the
that these area proportions remained stable until 2017. The amount of energy absorbed by the canopy during most of the
drought in 2018 induced a dramatic species change (Fig. 4b), growing season. Further, as the magnitude of fPAR remained
with the exception of Phragmites australis, which consti- constantly high throughout summer 2018, the drought stress
tuted the dominant species before and after drought (areal of the vegetation was not reflected by an attenuation of ab-
proportions of 44.4 %). When rain failed to fall, open- sorbed PAR.
water patches dried up completely and were colonized by
Tephroseris palustris and Ranunculus sceleratus. Both are 3.3 Response of CO2 exchange to drought
pioneer species that can rapidly spread along the nutrient-
rich shores of dried-up water bodies (Henker et al., 2006). The rewetted fen site is highly productive with substan-
Though of minor abundance in previous years (Leipe and tial rates of GEP and Reco (Koebsch et al., 2013). De-
Leipe, 2017), in 2018, Tephroseris palustris and Ranuncu- spite strong interannual variation, the fen has acted as a
lus sceleratus gained a spatial coverage of 26.6 % within a net CO2 sink since rewetting with average NEE budgets of
few weeks. The spatial proportion of both Bolboschoenus −0.70 kg m−2 a−1 (Koebsch et al., 2013). New record lev-
maritimus and Schoenoplectus tabernaemontani decreased els of GEP and Reco were reached in 2018 (Fig. 5a and b).
from 26.1 % to 6.3 % in 2018. In contrast to previous years, The annual Reco budget totalled 3.22 kg CO2 m−2 and ex-
when each of these species formed extensive clusters, they ceeded the post-rewetting average by 0.93 kg m−2 . Further,
now appeared strongly dispersed and were therefore merged with −3.61 kg CO2 m−2 total annual GEP exceeded the av-
into a single vegetation class. In contrast, the areal cover- erage photosynthetic CO2 uptake by 0.63 kg m−2 . Hence, in
age of Carex acutiformis, a species adapted to moist rather 2018, the fen remained a net CO2 sink, though net CO2
than flooded conditions, increased from 5.6 % to 17.3 %. sequestration was 0.30 kg m−2 lower than in average post-
Hence, after years of stagnation, drought changed the species rewetting years.
composition of the fen within weeks: dried-up open-water NEE and its component fluxes showed marked seasonal
patches served as habitat for fast-growing pioneer plants, dynamics including a decoupling of GEP and Reco when
but the established vegetation also responded with substan- drought took effect from July 2018 on (Fig. 5c). Before July,
tial withdrawal of flooding-adapted species and a spread of daily Reco and GEP sums were in the upper range of normal
species adapted to moderate moisture. years. This is most likely due to high temperatures and ra-
diation supply, which fostered efficient growth of the estab-
3.2.2 Seasonal dynamics lished vegetation. As the rise in C assimilation outweighed
the increase in respiratory CO2 release, the first weeks in
The special vegetation dynamics during the drought year the growing season 2018 also exhibited comparatively high
2018 were best represented by the enhanced vegetation index rates of net CO2 uptake. GEP peaked at −37 g CO2 m−2 d−1
(EVI). The EVI increased rapidly from a comparatively low in June–July, which coincided with the maximum EVI. Fol-
initial value of 0.1 in February–March to a new maximum lowing this peak, photosynthetic CO2 uptake decreased sub-
of 0.53 at the start of July. The steep springtime rise and the stantially, which was likely driven by the onset of drought-
high summer peak in EVI can most likely be attributed to the induced stress for the established vegetation.
rapid growth of the established vegetation, which was trig- This was further supported by the drop in light use
gered by high temperatures and radiation supply from April efficiency (LUE) of GEP, which halved from 0.18 to
on. However, in comparison to other years, EVI decreased 0.09 g C MJ−1 between June and July 2018 (Fig. 3d). This
early at the beginning of July 2018, which marked the onset drop in LUE was related to a decrease in GEP, i.e., to an
of drought-related changes in canopy reflectance when water attenuation of photosynthetic CO2 uptake, whilst the PAR
Biogeosciences, 18, 917–935, 2021 https://doi.org/10.5194/bg-18-917-2021F. Beyer et al.: Drought years in peatland rewetting 925 Figure 4. Vegetation composition in 2014 (a) as presented in Koch et al. (2017) and after the drought in 2018 (b). absorbance characteristics of the canopy remained virtually tumn 2018 were promoted by unusually high temperatures, unaffected. Such a drought-related decrease in LUE has been which enhance the capacity of photosynthetic CO2 assimila- reported by a variety of peatland studies and is related to tion and increase the maximum photosynthesis rate at light stomata closure as a common physiological mechanism of saturation (Lüttge et al., 2010). In accordance, the CUP 2018 vascular plants to cope with water deficit (Connolly et al., also extended until late in the season at day of year (DOY) 2009; Kross et al., 2016). 307. Hence, carbon uptake lasted 26 d longer and the length At the same time, Reco maintained its upward trend and of the total CUP was extended by 33 d in comparison to ref- reached a new record of 25 g CO2 m−2 d−1 at the end of July. erence years. Altogether, biomass accumulation through the Reco remained on this plateau for the following 2 months, massive spread of pioneer species in combination with high reflecting a persistent CO2 loss, which is likely to be asso- autumn temperatures held GEP rates high until late in the ciated with a shift from prevailing autotrophic to prevailing growing season. heterotrophic respiration (Olefeldt et al., 2017). In normal years, the fen smoothly shifts from being a net CO2 sink to 3.4 Response of CH4 exchange to drought a net CO2 source at the end of the growing season. The dry spell in summer 2018, however, caused a rapid switch from Annual CH4 sums in the rewetting period 2011–2017 aver- net CO2 sink to CO2 neutrality already in July. aged 66 g m−2 but fell down to 53 g m−2 in 2018, which was After the drought-related decline in July 2018, GEP in- 20 % below the average of the reference period (Fig. 5d). creased again in August. This second peak in GEP coincided The decline in CH4 emissions occurred mainly in the pe- with a sustained upswing in LUE and the observed coloniza- riod from August onwards, when daily fluxes kept below tion of dried-up areas by Tephroseris palustris and Ranun- 0.2 g CH4 m−2 d−1 and were thus 60 % lower than in refer- culus sceleratus. LUE reached high values of 0.30 g C MJ−1 ence years. Preceding the steep decline in CH4 emissions in even late in the season in October–November. At that time, August, there was a distinct emission peak with flux rates high rates of photosynthetic CO2 uptake represented by GEP up to 0.2 g CH4 m−2 d−1 that occurred when the water ta- occurred regardless of the decreasing PAR absorbance ca- ble dropped down to surface level. Such a CH4 emission pacity of the senescing canopy. Tephroseris palustris and pulse concomitant to falling water tables is commonly asso- Ranunculus sceleratus are pioneer plants, the ecophysiology ciated with degassing due to decreasing hydrostatic pressure of which is targeted for vigorous biomass production and, (Moore et al., 1990; Dinsmore et al., 2009). thus, efficient CO2 assimilation. Further, GEP rates in au- https://doi.org/10.5194/bg-18-917-2021 Biogeosciences, 18, 917–935, 2021
926                                                                     F. Beyer et al.: Drought years in peatland rewetting

   The following drought-induced reduction in CH4 emis-           abrupt episodes of habitat conversion, which are essential for
sions was expected given the shift in the peat redox regime       the succession trajectory of peatlands. Such drought-induced
and the adjustments of the methane cycling community. In          state shifts are known for kettle peatland development and
a complementary study addressing the microbial response to        are associated with greatly increased C-accumulation rates
the drought spell, we found a substantial increase in the abun-   (Ireland et al., 2012).
dance of type I methanotrophs of the order Methylococcales           Analogue climate feedback mechanisms cannot be antic-
(Unger et al., 2020). Accordingly, the observed reduction in      ipated for degraded restored fens, where catchment hydrol-
CH4 emissions is most likely due to a combination of inhib-       ogy, soil, and trophic conditions as well as propagule avail-
ited methanogenesis under the presence of oxygen and other        ability have been subject to irreversible change (van Digge-
terminal electron acceptors and an increase in microbial CH4      len et al., 2006; Klimkowska et al., 2010). Here, we describe
consumption.                                                      a distinct response mechanism of such newly created systems
   N2 O is another effective and long-lived greenhouse gas of     to severe drought: sinking water levels exposed bare spots
potential relevance in peatlands. N2 O is produced from in-       that were rapidly colonized by pioneer species. Hence, af-
complete turnover reaction of organic nitrogen compounds          ter years of stagnant vegetation development, drought acted
(Bremner and Blackmer, 1980) and can substantially con-           as a trigger event to close persistent vegetation gaps. Our
tribute to the radiative forcing of drained peatlands (Günther    study shows how drought-induced founding effects can cre-
et al., 2020). However, as emissions cease under the anaero-      ate an impetus to overcome stagnant vegetation succession of
bic conditions, N2 O is not of primary concern for most rewet-    rewetted fens, the canopies of which are often interspersed
ted peatlands (Hendriks et al., 2007). Indeed, our own flux       by more or less extended open-water patches where vege-
measurements conducted at the study site in the year prior to     tation cannot take root (Steffenhagen et al., 2012; Matthes
rewetting in 2009 indicated N2 O emissions to be negligible       et al., 2014; Franz et al., 2016). During the build-up of
(Koebsch, 2009). Yet, we cannot exclude that the alternating      new biomass, substantial amounts of CO2 were sequestered,
water tables occurring in summer 2018 can stimulate N2 O          which overcompensated for the drought-induced decline of
production and thereby add to the radiative forcing of peat-      photosynthetic CO2 uptake by the established vegetation. On
lands affected by drought.                                        an annual basis, enhanced GEP offset half of the drought-
                                                                  induced increase in Reco . Therefore, the restored fen main-
                                                                  tained its net CO2 sink function even in such a year of ex-
4     Drought response mechanisms of restored fens                treme drought.
                                                                     The rapid colonization by pioneer species and the asso-
Peatland conservation and rewetting is considered one of          ciated CO2 uptake during the peak of the drought in Au-
the major natural climate solutions (Griscom et al., 2017;        gust 2018 was only possible because there was still sufficient
Leifeld and Menichetti, 2018). In comparison to afforestation     moisture for germination. When rainfall stopped in May, the
in monoculture plantations, peatland protection is expected       water reservoirs in the fen under study were well filled, which
to conserve or recreate self-regulating ecosystems that are       dampened the severity of the drought. Such buffer proper-
resilient to climate impacts (Leifeld and Menichetti, 2018;       ties result from the hydrological sink function characteristic
Seddon et al., 2020). Nevertheless, in view of increasing         for fens which are commonly fed by various inflows. There-
frequency and severity of extreme climatic events (Pachauri       fore, the mechanisms described above cannot be transferred
et al., 2014), the effects of temporary droughts on the func-     to raised bogs, which are exclusively fed by precipitation and
tioning of rewetted peatlands are still largely unexplored and    are likely to be affected by drought to a greater extent (Dise,
lead to considerable uncertainty with regard to the inherent      2009). Overall, our study suggests that chances of restoring
climate mitigation goals.                                         self-regulating fens under increasing frequency and severity
   Pristine peatlands are adaptive systems characterized by       of droughts improve if the peatland can regain its natural
quasi-stable equilibrium states and feature resilience mecha-     function as a hydrological sink which, in turn, depends on
nisms to cope with drought to a certain extent (Dise, 2009).      the hydrological connectivity still existing in the catchment.
The ecohydrology of intact peat is characterized by its large        The reduction of CH4 emissions under low water tables is
water-holding capacity and its capillary-wicking processes        quite common, and this fact is also used to reduce CH4 emis-
(Ingram, 1987; Lapen et al., 2000). Whilst these present          sions from rice cultivation through the deliberate introduc-
an efficient regulation mechanism to buffer short-term dry        tion of periodic drought (Runkle et al., 2019). CH4 emissions
spells, persistent drought or increasing drought frequency        cause a substantial radiative forcing peak in the first decades
can also induce shifts in vegetation and C regime (Couwen-        of peatland rewetting (Günther et al., 2020). Therefore, active
berg and Joosten, 1999; Couwenberg et al., 2008). In mires,       water management for the temporary introduction of aerobic
drought can induce changes from low-phenolic mosses/herbs         conditions could also be considered to optimize the mitiga-
towards phenol-rich shrub vegetation, which increases C se-       tion potential of peatland rewetting as nature-based climate
questration and protects soil C (Riutta et al., 2007; Limpens     solutions (Unger et al., 2020). Nevertheless, such measures
et al., 2008; Wang et al., 2015). Drought can even trigger        must be assessed with regard to their impact on other ecosys-

Biogeosciences, 18, 917–935, 2021                                                     https://doi.org/10.5194/bg-18-917-2021
F. Beyer et al.: Drought years in peatland rewetting 927
Figure 5. Component fluxes GEP (a) and Reco (b) of NEE (c) and CH4 (d) over the course of the year. Variables are represented as the black
line (7 d rolling mean of black dots) for 2018 whereas the grey shading represents the variable range (minimum–maximum) throughout the
reference period 2010–2017 (dark grey line is the mean of the reference period).
tem functions and weighed against possible effects on CO2 1. The relevance of drought-induced founding events for
and N2 O exchange. the long-term succession of restored fens will rely
As much as the immediate effects of temporary droughts on the capability of the newly formed vegetation to
are important, it is conceivable that such extreme events ini- gain a lasting foothold in these systems. Dependent on
tiate distinct carryover effects that extend beyond the actual whether these pioneer species can cope with the recur-
drought period and can set the course for the future devel- rent water level rise (Koch et al., 2017), they will con-
opment of restored fens and their C cycle. Though, in prac- tribute to the ecosystems’ C budget in one way or the
tice, it is difficult to unravel such aftereffects of past events other: if the drought event can indeed accelerate the clo-
from contemporary influences. For example, we could still sure of persistent canopy gaps, it could increase pho-
observe the presence of Tephroseris palustris, despite the re- tosynthetic CO2 sequestration and C accumulation in
suming water level rise in the year after the drought. However the long run. A comparison to another drought-affected
since the majority of the resupplied water originated from fen has shown that the chances of the new vegetation to
an episodic brackish water intrusion event in January 2019, gain a foothold in the long-term increase if the founding
we cannot generalize the observations from 2019 to common event includes species that already predominate on the
freshwater fens. Since our own data are not suited to address site (Koebsch et al., 2020). However, if the new vege-
the post-drought development under common hydrological tation declines after the return of normal hydrological
conditions, we provide some considerations for possible fu- conditions, the dead biomass will form a large pool of
ture scenarios for fens affected by drought. easily decomposable C. Eventually, this C will be re-
leased as CO2 and CH4 , so that the radiative forcing
https://doi.org/10.5194/bg-18-917-2021 Biogeosciences, 18, 917–935, 2021928 F. Beyer et al.: Drought years in peatland rewetting
effect of drought could simply be postponed to the fol-
lowing years. Still, even in this unfavorable case, the
dieback of the new vegetation could initiate silting pro-
cesses in flooded peatlands and thereby set the stage for
subsequent peat-forming vegetation.
2. While the potential dieback of the newly formed vege-
tation could feed CH4 production in the post-drought
period, existing research indicates alternative scenar-
ios in which drought alters the redox geochemistry
of peat to sustainably reduce CH4 emissions. For ex-
ample, falling water tables can recharge the stock of
electron acceptors, thereby establishing thermodynami-
cally unfavorable conditions for methanogenesis (Knorr
and Blodau, 2009). Furthermore, drought can affect the
methane cycling community by increasing the abun-
dance of methanotrophs and/or declining the abundance
of methanogens (Unger et al., 2020). In either of these
cases, the temporal suspension of CH4 emissions be-
yond the actual drought period would contribute to im-
prove the climate balance of peatland rewetting.
In view of the divergent succession trajectories and the
contrasting climate mitigation prospects for peatlands af-
fected by drought, there is substantial demand for ecosystem-
scale studies to delineate drought impacts in relation to
climate-normal years and, further, to track the post-drought
development of the site under consideration. In this respect,
our study provides a starting point to demonstrate the far-
reaching implications of drought events under special con-
sideration of the link between vegetation response and green-
house gas exchange. Although designed as a case study, we
believe that our observations are transferable to a wider range
of degraded, rewetted fens, as many of these sites resemble
each other in terms of hydrology and canopy characteristics.
Further research is of particular relevance given the role of
peatland rewetting in nature-based climate solutions and the
need to meet the mitigation expectations under a changing
climate.
Biogeosciences, 18, 917–935, 2021 https://doi.org/10.5194/bg-18-917-2021F. Beyer et al.: Drought years in peatland rewetting 929 Appendix A: UAS data sets Figure A1. True-color, multispectral (band combination: near infrared–red–green), digital surface model and thermal orthomosaic of the multisensor UAS data. Appendix B: Modis footprint Figure B1. Spatial coverage of the different data sources including the 95 % footprint climatology of the eddy covariance (EC) flux mea- surements, ground-truthing points for vegetation mapping and the grid cell used for MODIS vegetation indices. https://doi.org/10.5194/bg-18-917-2021 Biogeosciences, 18, 917–935, 2021
930 F. Beyer et al.: Drought years in peatland rewetting Appendix C: Bands of the multisensor data set and its importance for classification Table C1. Multisensor data set consists of 107 bands. All indices are described in https://github.com/florianbeyer/SpectralIndices, last access: 24 January 2021. No. Band name Type/meaning Data from Derived from No. Band name Type/meaning Data from Derived from 1 RGB1 Blue RGB sensor 55 fe3 Spectral index Multispectral sensor 2 RGB2 Green RGB sensor 56 gemi Spectral index Multispectral sensor 3 RGB3 Red RGB sensor 57 gndvi Spectral index Multispectral sensor 4 MS1 Green Multispectral sensor 58 osavi1 Spectral index Multispectral sensor 5 MS2 Red Multispectral sensor 59 osavi2 Spectral index Multispectral sensor 6 MS3 Red edge Multispectral sensor 60 pvr Spectral index Multispectral sensor 7 MS4 Near infrared Multispectral sensor 61 rdvi Spectral index Multispectral sensor 8 DSM Digital surface model (DSM) RGB sensor 62 rededge2 Spectral index Multispectral sensor 9 th_index Thermal Thermal sensor 63 savi Spectral index Multispectral sensor 10 ngrdi Spectral index RGB sensor 64 sbl Spectral index Multispectral sensor 11 tgi Spectral index RGB sensor 65 spvi Spectral index Multispectral sensor 12 vari Spectral index RGB sensor 66 tc_gvimss Spectral index Multispectral sensor 13 exg Spectral index RGB sensor 67 tc_nsimss Spectral index Multispectral sensor 14 gcc Spectral index RGB sensor 68 tc_sbimss Spectral index Multispectral sensor 15 gli Spectral index RGB sensor 69 tc_yvimss Spectral index Multispectral sensor 16 ari Spectral index Multispectral sensor 70 tcari Spectral index Multispectral sensor 17 arvi2 Spectral index Multispectral sensor 71 tcari_osavi Spectral index Multispectral sensor 18 atsavi Spectral index Multispectral sensor 72 tcari2 Spectral index Multispectral sensor 19 avi Spectral index Multispectral sensor 73 tci Spectral index Multispectral sensor 20 bri Spectral index Multispectral sensor 74 tvi Spectral index Multispectral sensor 21 ccci Spectral index Multispectral sensor 75 varirededge Spectral index Multispectral sensor 22 chlgreen Spectral index Multispectral sensor 76 wdrvi Spectral index Multispectral sensor 23 chlrededge Spectral index Multispectral sensor 77 ndrdi Spectral index Multispectral sensor 24 cigreen Spectral index Multispectral sensor 78 ndre Spectral index Multispectral sensor 25 cirededge Spectral index Multispectral sensor 79 ndvi Spectral index Multispectral sensor 26 ctvi Spectral index Multispectral sensor 80 nli Spectral index Multispectral sensor 27 cvi Spectral index Multispectral sensor 81 normg Spectral index Multispectral sensor 28 datt1 Spectral index Multispectral sensor 82 normnir Spectral index Multispectral sensor 29 datt4 Spectral index Multispectral sensor 83 normr Spectral index Multispectral sensor 30 ddn Spectral index Multispectral sensor 84 band1_Energy Texture index RGB sensor 31 diff1 Spectral index Multispectral sensor 85 band1_Entropy Texture index RGB sensor 32 diff2 Spectral index Multispectral sensor 86 band1_Correlation Texture index RGB sensor 33 dvimss Spectral index Multispectral sensor 87 band1_InverseDifferenceMoment Texture index RGB sensor 34 gosavi Spectral index Multispectral sensor 88 band1_Inertia Texture index RGB sensor 35 grndvi Spectral index Multispectral sensor 89 band1_ClusterShade Texture index RGB sensor 36 lai Spectral index Multispectral sensor 90 band1_ClusterProminence Texture index RGB sensor 37 lci Spectral index Multispectral sensor 91 band1_HaralickCorrelation Texture index RGB sensor 38 logr Spectral index Multispectral sensor 92 band2_Energy Texture index RGB sensor 39 maccioni Spectral index Multispectral sensor 93 band2_Entropy Texture index RGB sensor 40 mari Spectral index Multispectral sensor 94 band2_Correlation Texture index RGB sensor 41 mcari Spectral index Multispectral sensor 95 band2_InverseDifferenceMoment Texture index RGB sensor 42 mcari_mtvi2 Spectral index Multispectral sensor 96 band2_Inertia Texture index RGB sensor 43 mcari_osavi Spectral index Multispectral sensor 97 band2_ClusterShade Texture index RGB sensor 44 mcari1 Spectral index Multispectral sensor 98 band2_ClusterProminence Texture index RGB sensor 45 mcari2 Spectral index Multispectral sensor 99 band2_HaralickCorrelation Texture index RGB sensor 46 mgvi Spectral index Multispectral sensor 100 band3_Energy Texture index RGB sensor 47 mnsi Spectral index Multispectral sensor 101 band3_Entropy Texture index RGB sensor 48 msavi Spectral index Multispectral sensor 102 band3_Correlation Texture index RGB sensor 49 msbi Spectral index Multispectral sensor 103 band3_InverseDifferenceMoment Texture index RGB sensor 50 msr670 Spectral index Multispectral sensor 104 band3_Inertia Texture index RGB sensor 51 mtvi2 Spectral index Multispectral sensor 105 band3_ClusterShade Texture index RGB sensor 52 myvi Spectral index Multispectral sensor 106 band3_ClusterProminence Texture index RGB sensor 53 evi2 Spectral index Multispectral sensor 107 band3_HaralickCorrelation Texture index RGB sensor 54 evi22 Spectral index Multispectral sensor Biogeosciences, 18, 917–935, 2021 https://doi.org/10.5194/bg-18-917-2021
F. Beyer et al.: Drought years in peatland rewetting                                                                                        931

Table C2. All bands of the multisensor data set ordered by the GINI coefficient. The higher the GINI, the more important the band for the
random forest classification.

 No.   Band                               Gini   Gini (%)   c. Gini   No.   Band                               Gini   Gini (%)   Cumulative Gini
 8     DSM                             0.06415        6.4      6.4     63   savi                            0.00618        0.6             85.0
 35    grndvi                          0.03760        3.8     10.2    100   band3_Energy                    0.00596        0.6             85.6
 82    normnir                         0.03268        3.3     13.4     85   band1_Entropy                   0.00560        0.6             86.1
 17    arvi2                           0.02773        2.8     16.2    106   band3_ClusterProminence         0.00556        0.6             86.7
 50    msr670                          0.02674        2.7     18.9     96   band2_Inertia                   0.00551        0.6             87.2
 74    tvi                             0.02510        2.5     21.4     45   mcari2                          0.00539        0.5             87.8
 38    logr                            0.02499        2.5     23.9     87   band1_InverseDifferenceMoment   0.00522        0.5             88.3
 76    wdrvi                           0.02460        2.5     26.4     43   mcari_osavi                     0.00522        0.5             88.8
 52    myvi                            0.02302        2.3     28.7     93   band2_Entropy                   0.00517        0.5             89.3
 49    msbi                            0.02271        2.3     30.9     54   evi22                           0.00498        0.5             89.8
 40    mari                            0.02140        2.1     33.1     95   band2_InverseDifferenceMoment   0.00492        0.5             90.3
 30    ddn                             0.02102        2.1     35.2     48   msavi                           0.00486        0.5             90.8
 5     MS2                             0.02093        2.1     37.3     80   nli                             0.00485        0.5             91.3
 79    ndvi                            0.02086        2.1     39.4    102   band3_Correlation               0.00485        0.5             91.8
 26    ctvi                            0.01867        1.9     41.2     53   evi2                            0.00478        0.5             92.3
 34    gosavi                          0.01826        1.8     43.0    101   band3_Entropy                   0.00477        0.5             92.7
 67    tc_nsimss                       0.01819        1.8     44.9     84   band1_Energy                    0.00456        0.5             93.2
 64    sbl                             0.01775        1.8     46.6     66   tc_gvimss                       0.00443        0.4             93.6
 83    normr                           0.01750        1.7     48.4     29   datt4                           0.00435        0.4             94.1
 47    mnsi                            0.01665        1.7     50.1     36   lai                             0.00432        0.4             94.5
 31    diff1                           0.01630        1.6     51.7     44   mcari1                          0.00432        0.4             94.9
 68    tc_sbimss                       0.01529        1.5     53.2     81   normg                           0.00386        0.4             95.3
 75    varirededge                     0.01527        1.5     54.7    104   band3_Inertia                   0.00370        0.4             95.7
 70    tcari                           0.01515        1.5     56.3     65   spvi                            0.00367        0.4             96.0
 7     MS4                             0.01454        1.5     57.7     11   tgi                             0.00301        0.3             96.3
 22    chlgreen                        0.01404        1.4     59.1     98   band2_ClusterProminence         0.00291        0.3             96.6
 60    pvr                             0.01399        1.4     60.5      4   MS1                             0.00289        0.3             96.9
 6     MS3                             0.01375        1.4     61.9    105   band3_ClusterShade              0.00275        0.3             97.2
 55    fe3                             0.01319        1.3     63.2     90   band1_ClusterProminence         0.00268        0.3             97.5
 33    dvimss                          0.01283        1.3     64.5     32   diff2                           0.00257        0.3             97.7
 24    cigreen                         0.01272        1.3     65.8     14   gcc                             0.00246        0.2             98.0
 19    avi                             0.01267        1.3     67.0     15   gli                             0.00240        0.2             98.2
 9     th_index                        0.01096        1.1     68.1     89   band1_ClusterShade              0.00222        0.2             98.4
 27    cvi                             0.01083        1.1     69.2     59   osavi2                          0.00169        0.2             98.6
 57    gndvi                           0.00977        1.0     70.2     10   ngrdi                           0.00160        0.2             98.8
 71    tcari_osavi                     0.00975        1.0     71.2     86   band1_Correlation               0.00145        0.1             98.9
 77    ndrdi                           0.00957        1.0     72.1     12   vari                            0.00144        0.1             99.1
 107   band3_HaralickCorrelation       0.00896        0.9     73.0     69   tc_yvimss                       0.00142        0.1             99.2
 58    osavi1                          0.00885        0.9     73.9     94   band2_Correlation               0.00097        0.1             99.3
 56    gemi                            0.00879        0.9     74.8     97   band2_ClusterShade              0.00085        0.1             99.4
 91    band1_HaralickCorrelation       0.00874        0.9     75.7     78   ndre                            0.00070        0.1             99.4
 103   band3_InverseDifferenceMoment   0.00838        0.8     76.5     25   cirededge                       0.00062        0.1             99.5
 73    tci                             0.00816        0.8     77.3     23   chlrededge                      0.00059        0.1             99.6
 16    ari                             0.00811        0.8     78.1     72   tcari2                          0.00058        0.1             99.6
 18    atsavi                          0.00773        0.8     78.9     21   ccci                            0.00051        0.1             99.7
 99    band2_HaralickCorrelation       0.00772        0.8     79.7     61   rdvi                            0.00051        0.1             99.7
 51    mtvi2                           0.00727        0.7     80.4     37   lci                             0.00051        0.1             99.8
 20    bri                             0.00686        0.7     81.1     62   rededge2                        0.00050        0.1             99.8
 42    mcari_mtvi2                     0.00682        0.7     81.8     28   datt1                           0.00046        0.0             99.9
 88    band1_Inertia                   0.00660        0.7     82.4     39   maccioni                        0.00038        0.0             99.9
 92    band2_Energy                    0.00659        0.7     83.1      3   RGB3                            0.00035        0.0            100.0
 41    mcari                           0.00643        0.6     83.7     13   exg                             0.00029        0.0            100.0
 46    mgvi                            0.00627        0.6     84.3      1   RGB1                            0.00011        0.0            100.0
                                                                        2   RGB2                            0.00009        0.0            100.0

https://doi.org/10.5194/bg-18-917-2021                                                                Biogeosciences, 18, 917–935, 2021
You can also read