When Mad Men Meets Flash Boys
←
→
Page content transcription
If your browser does not render page correctly, please read the page content below

Dushan Batrovic dbatrovic@differencecapital.com
                                                                       Tom Astle, CFA, Tom Liston, CFA
                                                                         Jordan Udaskin, Steven Russo

           When Mad Men Meets Flash Boys
             Opportunities Abound in the New World of Advertising Technologies

                                               May 2014

                                                Advertising used to be simple business. My newspaper
                                                has a million readers. My TV program has a million
                                                viewers. Now let’s negotiate what it’s worth to you Mr.
                                                Brand to put your ad in front of my audience. The web
                                                made this dynamic a bit more complicated, but early on
                                                the process was quite similar. My website gets a million
                                                hits per month and now let’s figure out what a banner ad
                                                is worth to you. The story got more complicated rather
                                                quickly as a bunch of genius coders realized that
                                                advertising is actually the perfect domain for technology
                                                because tech is capable of bringing way more
                                                measurement and accountability than ad buyers had
                                                ever seen before. It’s not a coincidence that all of those
                                                high flying tech stocks you follow are really advertising
                                                companies – think Google, Facebook, Twitter, Yahoo,
                                                Baidu. Online advertising is a $100 billion global market,
                                                or about 10x larger than it was in the early 2000s. This
                                                segment has risen from nowhere to become second only
  www.hongkiat.com                              to television advertising but growing much more quickly.

What we find compelling about advertising technology is that it continues to transform in very rapid
fashion. The complexity factor took another major leap about five years ago with the rise of something
called programmatic buying and real time bidding (RTB). The concept here is that every single website
impression creates a live auction. From the time I click my mouse to the time that the web page opens
up (a few milliseconds), computers have figured out generally who I am, what I like to browse, what
purchases I’ve made online, my gender, etc. This data has been delivered to advertisers and those
advertisers have bid for the right to place their ad. The winner of the auction has been selected and the
ad is now sitting on my web page. And once again, all of this took place over the span of 10 milliseconds
a few billion times in the past hour. The technology used to make all of this happen is very cool stuff –
reminiscent of the high frequency trading platforms popularized in Michael Lewis’ new book.

The overall industry is growing rapidly, well into the double digits and there are especially lucrative
pockets of growth in that mix, which are growing more than 2x year over year. These include mobile,
video, and social. We at Difference Capital are particularly keen on the ad-tech vertical given the
tremendous growth potential. A few of our portfolio companies that touch this theme are: Appinions,
EQ, iPowow and Vision Critical.

Difference Capital - Insights                                                                Page 1 of 28
When Mad Men Meets Flash Boys – May 2014
                                                        Dushan Batrovic dbatrovic@differencecapital.com

Here are a few topics we will be exploring in this report:

      1. Market segmentation and growth forecasts
      2. Why do ad-tech companies overcomplicate things – understanding the metrics of ad-tech and
         why we don’t have something similar to TV ratings to gauge the success of online channels
      3. The rise of programmatic and real time bidding – nearly 80% of marketers have never used
         programmatic, yet the market is exploding
      4. Combating click fraud – new metrics and the rise of premium programmatic
      5. Making sense of the ecosystem – why does the website only receive 20% of the revenue from
         an ad purchase?
      6. What does a real time bidding auction look like?
      7. Best of breed vs. suite – how Google owns the stack
      8. Mobile, Video and Social – similarities and differences in the ad-tech model
      9. Examples of failures and successes in ad campaigns

1.0      Market Segmentation

The US advertising market is worth roughly $175 billion annually. Television remains the dominant
media for this spend, representing about $75 billion or 43% of the total. This segment has been the
largest for some time and has shown relatively flattish growth. The Internet segment is second, worth
$43 billion last year or 24% of the total. This category has been growing quickly over the past decade.
Internet has grown at an 18% CAGR since 2004. Within this category, mobile has been the strongest
performer over the past few years. Mobile now represents 17% of total Internet spend or roughly $7
billion. This figure was below $2 billion in 2011 and virtually zero in 2009.

Difference Capital - Insights                                                                Page 2 of 28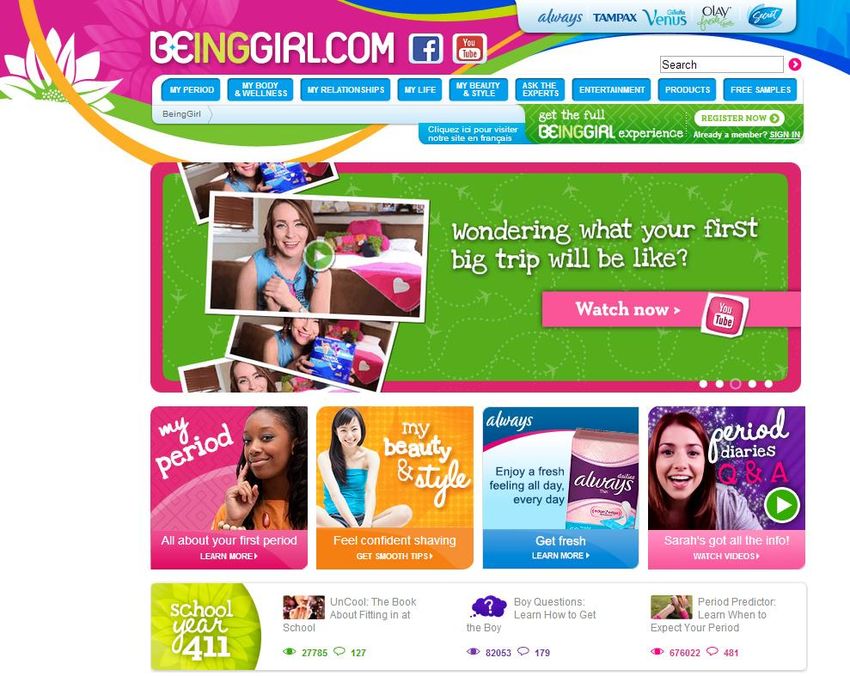
When Mad Men Meets Flash Boys – May 2014
                                                          Dushan Batrovic dbatrovic@differencecapital.com

                           US Advertising Revenue by Media – 2013 ($ billion)

            Source: Difference Capital, based on data from IAB

                                US Advertising Internet Revenue ($ billion)

            Source: Difference Capital, based on data from IAB

Within Internet advertising, the search category remains by far the largest with 43% share last year.
These are basically your standard Google-type searches on the web. The display/banner segment was
second at 19%, followed by mobile at 17%. Search has been relatively flattish over the past 5 years but

Difference Capital - Insights                                                                Page 3 of 28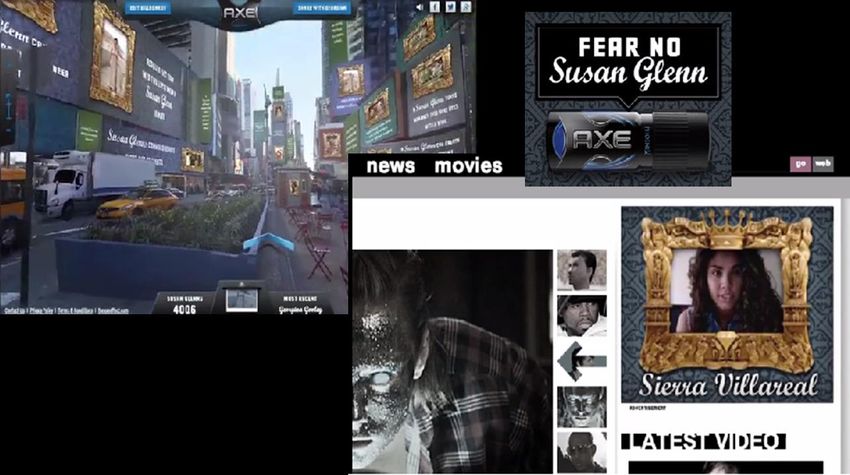
When Mad Men Meets Flash Boys – May 2014
                                                                  Dushan Batrovic dbatrovic@differencecapital.com

slipped a bit in 2013. Display/banner has also been flat to down recently. The major growth is coming
from mobile and video. Mobile is more than doubling year over year and actually took the second place
position from display/banner in the fourth quarter.

                             US Internet Advertising Revenue by Format – 2013

             Source: Difference Capital, based on data from IAB

                                   Advertising Format Market Share Trends

          Source: IAB

Difference Capital - Insights                                                                        Page 4 of 28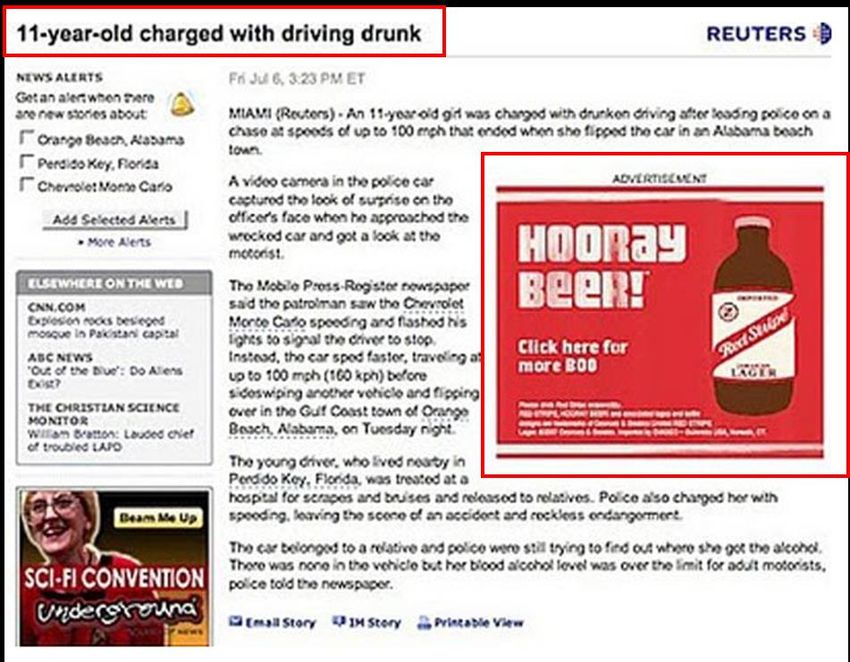
When Mad Men Meets Flash Boys – May 2014
                                                        Dushan Batrovic dbatrovic@differencecapital.com

2.      Why do Ad-Tech Companies Overcomplicate Things?

Despite the rapid growth and massive size of Internet advertising, we contend that the market is
actually being stifled by what should be an enormous asset. Technology is capable of giving advertising
much more accountability than the industry has ever seen before. And this is probably the biggest
reason why companies like Google have become global titans in relatively short timeframes. We would
argue that one of the less acknowledged talents that Google possesses is simplicity. Google spends $15
billion per year on R&D and capex, yet the company’s message is quite simple. Bid on the right to place
an ad when somebody conducts a certain search. I.e. I’m willing to pay 50 cents every time somebody
clicks onto my ad and goes to my website.

The newest wave of techies could learn something from Google in our opinion. These new
programmatic and RTB companies have over-complicated the ad business. Global advertisers spend
$200 billion on TV commercials and don’t seem to care a whole lot about measuring ROI. The key driver
for TV ad spend in the US is ratings and the proxy for ratings is a metric called gross rating point (GRP).
GRP is defined as what portion of the audience saw an ad multiplied by how many times they saw it. So
for example, if a commercial played 3 times during a show and 20% of the audience was watching that
show, the total GRP would be 3 x 20 = 60. The TV networks tend to charge advertisers about $50K per
GRP. Pretty simple stuff, right? So where do things go wrong? Firstly, the TV ratings are sampled from
what people from about 20,000 homes in the US are watching. Of the 110 million or so homes in the
US, this translates into a sample size of about 0.02%. And what about those viewers who prefer to
watch their content online or via streaming service like Netflix? And is there a mechanism to track how
many people who watched that Nike commercial went out to purchase that pair of shoes? No way.

Despite these limitations, advertisers appear perfectly content spending lots and lots of money on TV
commercials. Why is online advertising held to a much higher standard? The easy answer is inertia. TV
advertising first began in the 1940s and really entered the mainstream in the 1960s. It has been the
easy and safe place to park your money over the past 50 years. The more nuanced answer is that ad-
tech is too complicated. Techies love numbers and love measuring things. Advertisers are constantly
telling us they get so much data, they don’t know what to do with it all. While it may be interesting that
our banner ad got 3x more clicks on Tuesday morning in the state of Utah, is it relevant and what can I
do with this data?

Online advertising allows ad-tech companies to introduce dozens of fancy acronyms in order to impress
the marketing buyers. Unique visitors, impressions, SEO, SEM, CTR, CPM, DSP, RTB, etc. The problem is
that the advertiser, newly empowered with these new acronyms, now wants to translate CTR and CPM
into the most important metric of all, ROI. Unfortunately, this is very tricky. Just because I didn’t click
on the ad, doesn’t mean it didn’t capture my attention and get me thinking about that tasty chocolate
dip donut at Tim Hortons. After seeing 5 different ads about the new Godzilla movie coming out on my
phone, tablet, computer and TV, I went to Google to check out the trailer. Who takes credit for
converting me to watch that ad? Ad-tech companies have become their own worst enemies by
constantly raising the measurement bar in order to differentiate themselves. Ad-tech company A says I

Difference Capital - Insights                                                                  Page 5 of 28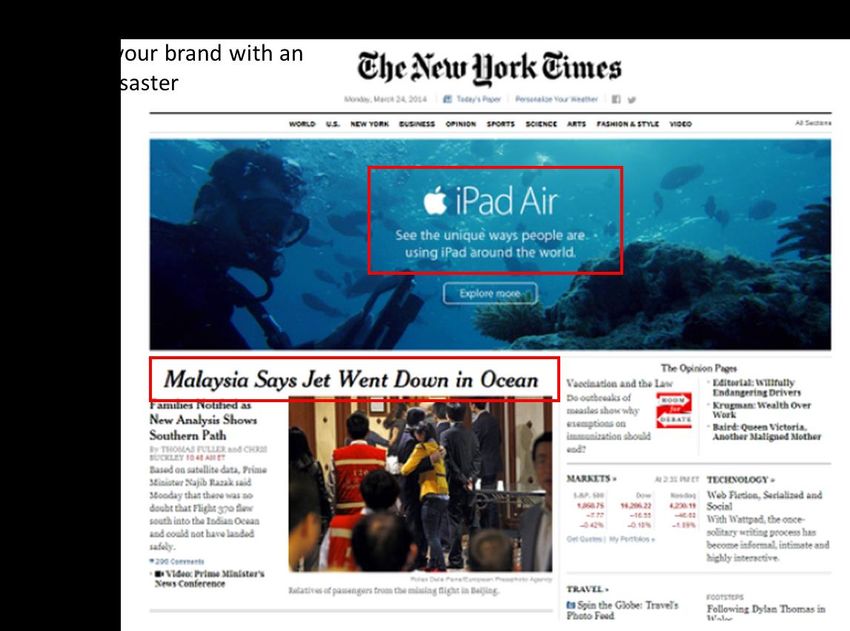
When Mad Men Meets Flash Boys – May 2014
                                                        Dushan Batrovic dbatrovic@differencecapital.com

can get you access to 10 million people who like sports and 0.1% will click your ad. Ad-tech company B
now has to get you access to 10 million males who like baseball and 0.15% will click your ad. And the
arms race grows. One of the last big ad-tech IPOs, Rocket Fuel, claims to have developed an “artificial
Intelligence and Big Data-driven predictive modeling and automated decision-making platform”. If that
mouthful of words doesn’t excite the techies, nothing will.

Why not introduce a concept like GRP for digital media? Our website gets 10 million unique visitors per
month and those visitors tend to be male, between the ages of 25-34. That ad was seen by 1 million
visitors so 10% of the total and it was shown an average of 10 times in the month. Therefore, the total
GRP is 100. Let’s charge $50K per GRP and we, the website, starts making $5 million in ad revenue per
month. Is this too simple to work? Perhaps. But there is some precedent. In fact, Google recently
announced a partnership with comScore to launch the concept of “active GRPs” in display advertising.
The purpose is to make adjustments to online data in order to make this metric comparable to standard
GRP and thereby have an apples-to-apples way to compare online with offline campaigns.

Also, the Media Rating Council (MRC) in March this year announced that it has released some guidelines
around what constitutes a valid ad impression. The Viewable Impression Measurement Guidelines
specify that 50% of pixels must be in the viewable portion of the browser for a minimum of one
continuous second to qualify as having been viewed.

We think the ad-tech industry is full of data and advertisers are getting confused by what it all means
and what is truly relevant. Any ideas like GRP and viewability guidelines, which drive toward more
simplicity in ad-tech, will be useful in promoting wider adoption of these technologies. Digital
advertising has been growing quickly but still lags behind where it should be. Advertisers in the US still
spend more ad dollars on print than they do on Internet despite the fact that people spend 4x more
time on the web than they do reading newspapers and/or magazines.

                  % of Time Spent in Media vs. % of Advertising Spending (USA, 2012)

 Source: KPCB. Internet Trends. May 2013.

Difference Capital - Insights                                                                  Page 6 of 28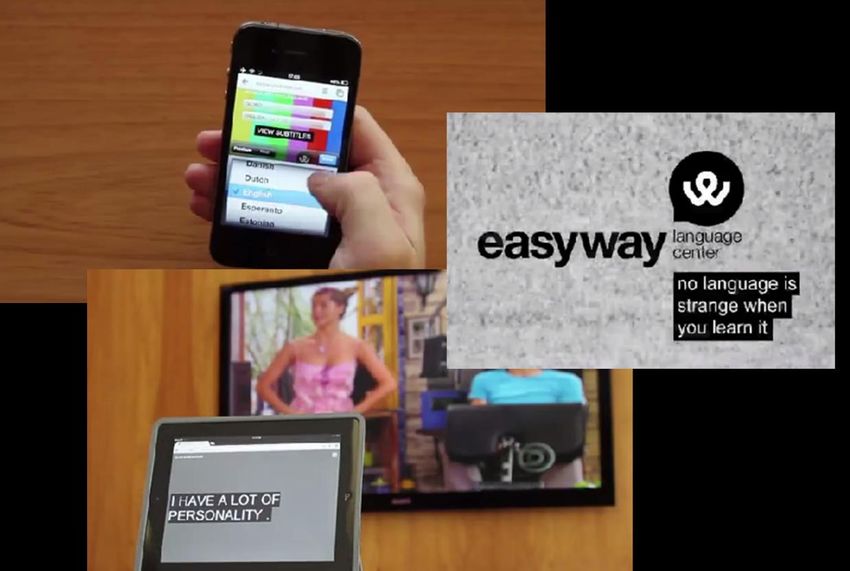
When Mad Men Meets Flash Boys – May 2014
                                                         Dushan Batrovic dbatrovic@differencecapital.com

3.0     Advertising Becomes Hi-Tech

Most forms of advertising, including Internet, have been relatively low tech. Ie. You as the TV show,
newspaper or website share your traffic figures with a brand and then negotiate how much you will
charge that brand for the right to place its content in front of your viewers. The Internet advertising
model has changed rather dramatically over the past few years with the emergence of real time bidding
and programmatic buying – terms that tend to be used interchangeably even though they are not the
same thing. The concept is relatively simple even though the execution is quite complex. These
technologies allow brands to bid on users one at a time based on the information about those users.
Knowing what a web viewer likes, his browsing history, demographic, etc. will presumably lead certain
brands to bid more for the right to advertise. One cannot help but be impressed when considering all
that needs to happen to get that targeted ad in front of your eyeballs between the time that you click
your mouse to the time that the website opens up.

The advantages of the programmatic approach are quite obvious. This has led to dramatic growth of
programmatic buying and real time bidding in the market. The share of programmatic has risen from
24% in 2011 to 53% in 2013. Global programmatic buying represents $12 billion in 2013, according to
Magna Global. This is expected to grow to $33 billion by 2017. Of this total, US real time bidding is a
$3.9 billion market, expected to grow to over $10 billion by 2017.

               US Programmatic Market Share (% of display-related media transactions)

         Source: Difference Capital, based on data from Magna Global

Difference Capital - Insights                                                                Page 7 of 28
When Mad Men Meets Flash Boys – May 2014
                                                              Dushan Batrovic dbatrovic@differencecapital.com

What is perhaps most impressive about this growth is that advertisers are still somewhat perplexed by
the concept of programmatic buying. A recent survey of US client-side marketers in March 2014
showed that only 23% of respondents understood programmatic buying and have used it to execute a
campaign. 77% have never used programmatic and over 40% do not even know what the term means.

                            Survey of Programmatic Understanding by Marketers

          Source: Difference Capital, based on data from eMarketer.com

4.0     Fraud and the Push for Premium Programmatic
Since the inception of pay-per-click (PPC) advertising, click fraud has emerged as a real burden to
advertisers and advertising networks alike. Costing advertisers billions of dollars per year, click fraud
stands to undermine the entire digital media industry. It was reported earlier this year that up to 36% of
traffic is generated from machines, not humans. The goals of this machine traffic is often to create fake
clicks in order for publishers to earn advertising revenue. This can place a heavy toll on brands that
need to pay for this illegitimate traffic. Both the publisher and the ad network are incentivized to drive
click rates as they can lead to revenue streams as high as a $40 CPM (or $0.04 per click). Whether the
players are automated robots (“bots”) or cheap offshore labour, the end result is the same. The clicks
drive the advertising spend through the roof, which undermines the industry.

The industry has been responding to the click fraud threat through the adoption of various detection
and prevention technologies. These can include things like blacklists (which sites to avoid) or whitelists
(which sites to accept) or more elaborate forms of real-time bot detection. The result has been a
significant decrease in bot traffic over the past few quarters. According to Integral Ad Science, the

Difference Capital - Insights                                                                    Page 8 of 28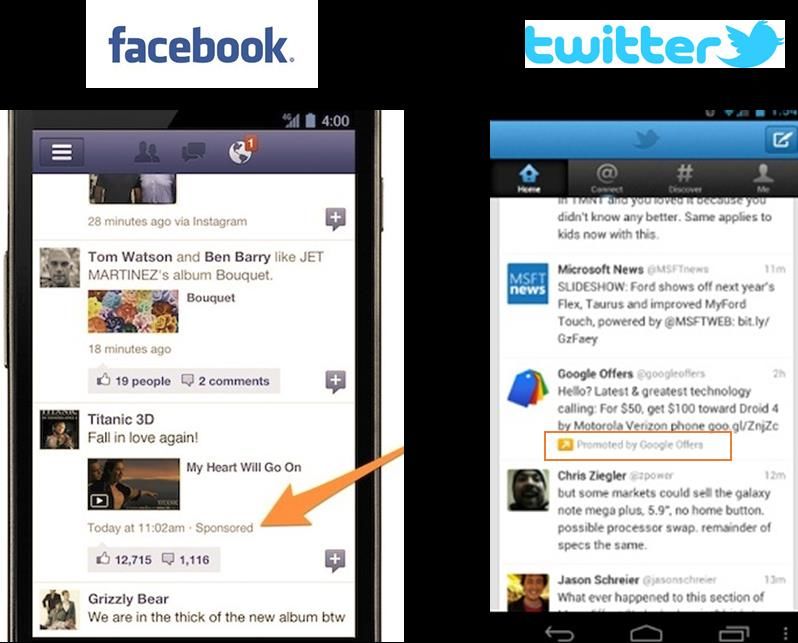
When Mad Men Meets Flash Boys – May 2014
                                                              Dushan Batrovic dbatrovic@differencecapital.com

portion of suspicious activity on ad exchanges has dropped from 20% in the first half of 2013 to 13% in
the second half. The portion of suspicious activity in direct ad sales is still well below at 2%. Viewability
is another important metric as discussed above. The proportion of ads viewable for longer than 1
second is between 44% to 56% on average. A third metric that matters to advertisers is brand safety or
how often ads gets placed on questionable websites (i.e. Adult content, illegal downloads,
drugs/alcohol, etc.) Direct publishers continue to be the least risky according to this metric. In Q4/13,
2.8% of impressions were placed alongside objectionable content according to Integral Ad Science. The
figure for ad exchanges was 7.2%.

Questions around click fraud and brand safety have led to the rise of something called premium
programmatic ad spending. Programmatic and real time bidding began as a way to get remnant
publishing inventory sold so that websites could increase their fill rates and monetize on all available
traffic. The industry is now looking for a hybrid way to marry the best of both worlds – the speed and
efficiency of programmatic combined with the safety and quality of direct ad sales. The term premium
programmatic has emerged to fill this gap. Spending in this area is expected to grow exponentially in
the coming years. eMarketer forecasts this segment to grow from $200 million last year to $1.6 billion
next year and nearly $6 billion by 2017.

                    US Premium Programmatic Digital Display Ad Spending ($ million)

        Source: Difference Capital, based on data from eMarketer.com

Difference Capital - Insights                                                                    Page 9 of 28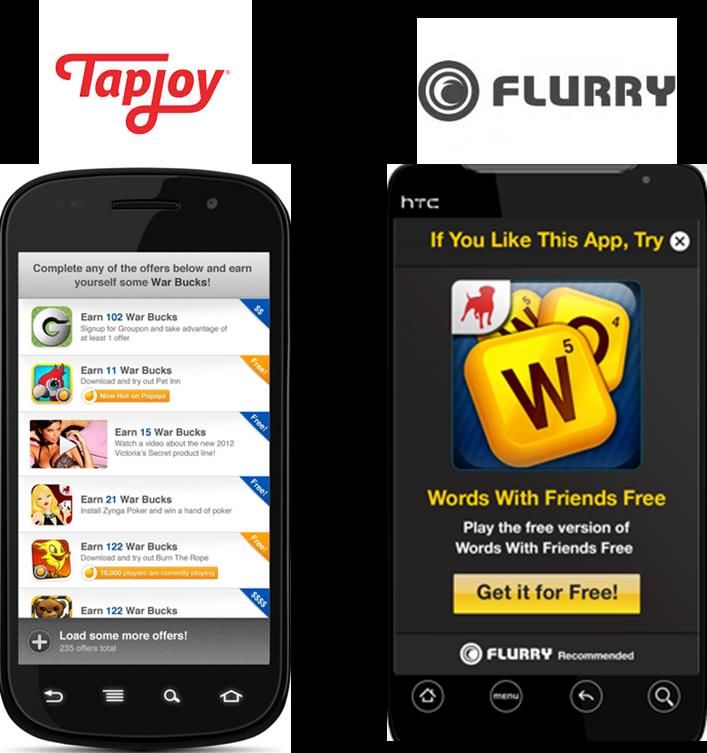
When Mad Men Meets Flash Boys – May 2014
                                                      Dushan Batrovic dbatrovic@differencecapital.com

5.0     Making Sense of the Ecosystem
How hard can it be to put that Big Mac logo on my web page as I’m perusing through the NBA playoff
scores before I get to work? It’s probably trickier than you would think, at least judging by all of the
parties in the ecosystem. An industry consultant a few years ago estimated that out of a $5 ad
purchase, about $1 may go to the publisher or the website that attracted my eyeballs to the screen. The
rest of the $4 gets split between the agency, ad network, exchange, data provider and various other
intermediaries. We offer a glimpse of this ecosystem below and attempt to explain what everybody
does in plain old English.

                                        The Ad-Tech Ecosystem

  Source: Difference Capital

Advertiser – The company that wants to put their brand in front of you so that you buy their stuff.
Advertisers can work through agencies to place their ads or can circumvent the agency for the execution
of the ad.

Agency – The marketing geniuses that come up with campaigns to most effectively differentiate your
stuff from other stuff in the marketplace.

Difference Capital - Insights                                                             Page 10 of 28
When Mad Men Meets Flash Boys – May 2014
Dushan Batrovic dbatrovic@differencecapital.com
DSP (Demand Side Platform) – For an advertiser, good eyeballs are in demand. Brands demand eyeballs
and websites (publishers) supply those eyeballs. The demand side platform (DSP) helps advertisers
purchase eyeballs in a centralized fashion with the right business rules. Not all eyeballs are created
equal. Eyeballs attached to big wallets tend to be more coveted than eyeballs attached to small wallets.
It would be overly cumbersome for advertisers to purchase eyeballs from websites directly and so they
run through DSPs. DSPs fill two primary roles. Firstly, they offer a centralized place for advertisers to
purchase this virtual shelf-space. Secondly, they allow advertisers to set the rules of what types of
eyeballs they want to target. In effect, an advertiser like Ford could ask its DSP for 1 million people to
view its new truck ad. Ford wants to deliver this ad to males, ages 35-45, with annual income above
$60K, who have shown some interest in vehicles over the past 30 days. The DSP translates this request
into an algorithm and then scours a list of hundreds of websites for people that fit the profile. EQ is a
DCF portfolio company that fits into this category. The company helps brands and agencies reach their
target audience with a technology platform that connects into multiple exchanges into the PC, mobile,
video and social segments. Other Canadian companies that fit this category are AcuityAds, adgear,
Chango, and eyeReturn.
Ad Exchange – This is where the trade happens – where advertisers bid on eyeballs and the winning
bidder gets to put his ad on your desktop or phone. The main purpose of the exchange is to facilitate an
automated auction-based process in real time. In order to establish an efficient auction, the bidders
need good data on who is looking at the web page. The publisher will typically try to provide as much of
this data as possible based on cookies and other sources of information. Third party data providers will
also try to supplement this data with their own proprietary sources. The auction process is described in
a bit more detail below.
Ad Network – these were created to aggregate publishing inventory in order to make the process of
buying for an advertiser easier. An ad network would negotiate with multiple publishers (websites) in
order to be able to bundle different types of eyeballs together. An ad network that has relationships
with 50 top websites is able to more granularly slice the inventory by demographic, geography, etc. The
ad network can then purchase a large campaign and be confident that it can place the ads in front of the
right eyeballs.
SSP (Supply Side Platform) – these are similar to DSPs except they are used to help publishers or
websites manage their inventory. Publishers would use SSPs to optimize their selling prices in real time
in order to effectively balance revenue maximization with fill rates (ie. How many opportunities for an
ad actually get placed with an ad?)
Publishers – these are the websites that attract the eyeballs.
6.0 Visualizing the Auction Process
What does the auction process look like in an ad exchange? We offer a pictorial depiction below. Step 1
has a user going to a website. Let’s assume ESPN in this case. The website publisher typically collects
information on the user and his surfing habits based on cookies and other third party sources. This data
is delivered to the DSPs in step 2. The DSPs have been programmed by advertisers and agencies to bid
on users that match a certain profile. Step 3 has the DSPs evaluating the criteria and bidding on the
right to place their ad through the ad exchange. In our example below, Bidder A is representing
Difference Capital - Insights Page 11 of 28When Mad Men Meets Flash Boys – May 2014
Dushan Batrovic dbatrovic@differencecapital.com
Canadian Tire, either directly or through an agency. Canadian Tire sees that the user was recently on its
website browsing bicycles. This would be deemed a very relevant and targeted ad placement. As such,
the DSP has been instructed it is able to make a $3 CPM bid on this user. CPM is cost per thousand
impressions. So effectively, Canadian Tire is bidding $0.003 to place that one ad on that one person’s
web page. Bidder B represents Walt Disney Company. Based on the user’s web surfing habits and
interest in ESPN, the DSP representing Disney believes this is a male, aged 22-29. This information is
pretty good but not as targeted as Bidder A had. As such, it only makes sense for Bidder B to make a $2
CPM bid for the right to place the ad. Bidder C doesn’t really care much about the targeting data.
Bidder C represents Nike and Nike is simply interested in promoting its new line of shoes on any sports
related website. In this case, Nike is only willing to bid a $1 CPM. In Step 4, the exchange selects Bidder
A as the winning bidder. In Step 5, the winning ad is placed on the ESPN web page. This whole process
took about 5 milliseconds from start to finish.
Difference Capital - Insights Page 12 of 28When Mad Men Meets Flash Boys – May 2014
Dushan Batrovic dbatrovic@differencecapital.com
Real-Time Bidding Auction Process
Source: Difference Capital, inspired by an OpenX whitepaper: Ad Neworks vs. Ad Exchanges: How They Stack Up
7.0 Leaders of the Stack
That ecosystem picture we provided above gives a high level overview of the ad-tech value chain. If we
rotate that picture by 90 degrees, we get something that techies like to call a “stack”. There is one
primary company that seems to be trying to acquire its way into the entire stack and that company is, to
no surprise, Google. Others like Adobe and AOL are making their fair share of acquisitions as well –
Adobe with Omniture, Auditure and Neolane. AOL, with the acquisitions of Convertro, Adap.tv and
Gravity, has repackaged its ad-tech offerings into something called “One by AOL”.
Difference Capital - Insights Page 13 of 28When Mad Men Meets Flash Boys – May 2014
Dushan Batrovic dbatrovic@differencecapital.com
Google Ad Stack
Source: Difference Capital
The best of breed vs. suite discussion pops up in most tech segments and ad-tech is no different. One of
the top areas experiencing convergence is with agencies that are bringing more tech in-house. There
was a time when ad agencies were in charge of strategic vision and creative content while ad-tech
companies were responsible for the execution of that vision. An agency comes up with a great
campaign and then the tech company makes sure it gets delivered the right way. However, both
segments are trying to keep a higher portion of the margin by encroaching into each other’s territory.
Ad-tech companies are adding a creative component to their offering and agencies are bringing much of
the DSP function in-house. Converged players argue that controlling everything leading into the ad
exchange ensures good quality control and flexible execution. Best of breed players argue that
independence is what ensures innovation and there is greater transparency in having the agency
function and the DSP function separated. Some industry players have speculated that agencies over-
inflate the DSP cost in a bundled offering, which has led some brands to explicitly dictate that they do
not want their agency utilizing its own DSP for ad placement.
Difference Capital - Insights Page 14 of 28When Mad Men Meets Flash Boys – May 2014
Dushan Batrovic dbatrovic@differencecapital.com
8.0 Content Marketing
Content marketing is how brands try to communicate with consumers in a more subtle fashion than
through the typical ad. It is meant to offer real and tangible value to consumers through information or
entertainment. Through this process, brand recognition is meant to improve and hopefully lead to
positive feelings at some point. These positive feelings should eventually lead to sales. Content
marketing is this report. Hopefully you find it useful, which helps build some goodwill down the road so
that good companies invite us to invest in them. We could have just placed an ad on the TV, radio or
web but we decided that generating this publication was probably the better route. According to
Demand Metric, content marketing is 62% less expensive than traditional marketing but leads to 3x as
many leads. Prominent examples of content marketing throughout history include the Michelin Guides,
which are over 100 years old. The Michelin brothers in 1900 published their first car guide, which they
gave away for free. The concept was intended to boost demand for cars and therefore car tires. The
idea worked out pretty well as Michelin became and still is one of the largest tire makers in the world. A
more recent example is Proctor & Gamble’s BeingGirl.com, a website devoted to providing puberty
advice to adolescent girls. The site’s popularity has grown since being created in 2000 and now gets
over 2 million visitors per month. This form of advertising was found to be 4x more effective than
typical ads.
Content Marketing Example – beinggirl.com
Difference Capital - Insights Page 15 of 28When Mad Men Meets Flash Boys – May 2014
Dushan Batrovic dbatrovic@differencecapital.com
So where does the technology come into play? The first place is measurement. Similar to many forms
of online media, content marketing effectiveness is tricky to measure. Transaction-based advertising
campaigns are easier to measure (ie. Sign up to receive something or click here to purchase). Content
marketing is based on the premise that brands need to develop relationships with consumers over time.
Relationships are tough to measure and do not correlate well to page views or clicks. So companies like
Contently have begun to offer tools that measure engagement time as an example. They will track
scrolling and mouse movements in order to determine whether a person is actively engaging with a
piece of content. Or they will track what portion of consumers actually finish reading a story. The
second important tech category for content marketing is content creation. Contently addresses this
issue as well by offering a marketplace that connects brands with freelance publishers willing to blog or
otherwise create new content for an average of $275 per blog.
Appinions is a DCF portfolio company that extends the content marketing theme. Appinions’ technology
is used to identify and message leading influencers on any topics. Influencers are perceived as being
knowledgeable and independent. Hence, their views go a long way in swaying purchasing decisions.
Appinions will help content marketers reach the right audience by identifying who the key influencers
are.
9.0 Mobile
Mobile advertising is in theory similar to the rest of digital advertising, except the ads are designed to be
seen on your phone or tablet rather than your PC. There has been great enthusiasm for this segment
because mobility tends to be more contextual and geo-specific. This means that if you are searching for
movie info on your phone, there is a higher probability that you are probably planning to see a movie in
the near term. If you’re searching on your PC, perhaps you’re simply curious about a trailer or maybe
you simply enjoy reading movie reviews.
Mobile ad revenues more than doubled in 2013 to $18 billion and are expected to grow another 75%
this year according to eMarketer. Google is still the market leader with about 50% share in 2013;
however Facebook is growing quickly having only turned on its mobile ads last year. It is projected to
increase its market share from 18% last year to 22% this year.
Difference Capital - Insights Page 16 of 28When Mad Men Meets Flash Boys – May 2014
Dushan Batrovic dbatrovic@differencecapital.com
Mobile Internet Ad Spending Worldwide ($ billions)
Source: eMarketer, March 2014
Advertising on mobile devices comes with a few key differences to the standard PC ad model. Firstly, PC
advertising generally relies on cookies from your web browsing history being used to understand your
preferences. Mobile devices don’t really have cookies so targeting becomes a more complicated
process. Consumers spend about 80% of their smartphone time on apps and only 20% on the web.
Traditional online ad companies don’t have any visibility into the consumer while he’s playing with his
apps. In-app targeting requires a different infrastructure where firms build back-end technology that
integrates into the app developer’s first party data. A few Canadian companies that fit the mobile
theme are Addictive Mobility, Juice Mobile and Go2mobi.
The second difference between mobile and PC advertising is that the mobile screen tends to be a lot
smaller and so the ad needs to be less obtrusive. A banner ad on the mobile device can take up half of
the screen, which doesn’t make for a very worthwhile experience for the user. Facebook and Twitter
have been very careful on how and when to launch their mobile advertising networks. Below are
examples of how Facebook sponsored posts and Twitter promoted tweets are integrated into the user’s
experience.
Difference Capital - Insights Page 17 of 28When Mad Men Meets Flash Boys – May 2014
Dushan Batrovic dbatrovic@differencecapital.com
Facebook & Twitter Mobile Advertising Integration
We stated above that apps are hugely important for the mobile ecosystem. People spend 80% of their
mobile time on apps and gaming is by far the most popular activity taking up that time. Flurry in 2012
suggested that 52% of mobile sessions were gaming related. The number 2 category was social
networking, representing 22% of mobile sessions. The intriguing thing for developers is that people
actually pay a lot of money to play these free games through in-game purchases. Finnish game
developer, Supercell, grew its revenues last year to nearly $900 million from $100 million in the year
prior. The success was primarily driven from two games – Clash of Clans and Hay Day. A second major
game developer, King Digital, recently IPO’d and last quarter generated over $600 million in sales and
nearly $250 million in EBITDA because it has 3 of the top 10 mobile gaming apps on the key platforms.
The average paying user spends $18 per month playing “free” games like Candy Crush. These are
serious dollars, which are undoubtedly attracting serious attention from other game developers. The
problem with the app world is it is an extremely pointy pyramid where the top 10 games make 90% of
the revenues and the vast majority of games die a quiet death.
This phenomenon has created a major new mobile advertising segment called “app discoverability”.
Mobile app analytics companies are suggesting that the price charged for an app install has risen
dramatically over the past year. SuperData Research reported that the average cost per install had risen
to $2.73 in late 2013 from $0.97 in the year ago period. Some are forecasting that this figure will grow
Difference Capital - Insights Page 18 of 28When Mad Men Meets Flash Boys – May 2014
Dushan Batrovic dbatrovic@differencecapital.com
to $7.00 over the next year or two. Companies like Tapjoy and Flurry are leading this new segment.
Tapjoy creates an exchange that allows users to earn virtual currency and points if they engage with ads
(ie. Watching a video). Flurry allows game developers to target consumers based on their habits so for
example if a user downloads a new game, he may be asked if he wants to try out another game that is
similar in style.
App Discoverability Examples
10.0 Video
Video advertising is expected to grow materially in the coming years. Brands love to put videos in front
of consumers because sight, sound and motion are useful in establishing an emotional connection with
the audience. This is the likely reason why the $500 billion global advertising market continues to be
dominated by TV. According to ComScore data below, online video ad views have grown to about 25-30
billion views per month so far this year from less than 5 billion monthly views in early 2011. The market
is below $3 billion annually currently but expected to grow to $5 billion by 2016. The popularity of video
ads is partially driven by the high click through rates. The CTR is nearly 2% relative to most other ad
formats at sub 0.5%.
Difference Capital - Insights Page 19 of 28When Mad Men Meets Flash Boys – May 2014
Dushan Batrovic dbatrovic@differencecapital.com
Several new ad tech IPOs geared towards video have come to market of late. Tremor Video, YuMe and
TubeMogul all aim to help advertisers efficiently place the right video ads in front of the right audience.
The key to success in this market appears to be to make the buying process as similar to traditional TV
advertising as possible. According to a recent WSJ article, major advertisers such as MasterCard and
Verizon Wireless have in the past year begun to shift a portion of their TV advertising budget to online
video. The same article reports that Starcom MediVest, a large US ad agency, has shifted $500 million
out of TV over the past 12 months, with three-quarters of that moving to online.
A slightly different perspective on the video theme comes from another Canadian tech company named
Vidyard. Vidyard helps companies manage and monetize their video content by tracking usage data and
integrating into other CRM platforms.
iPowow, a DCF portfolio company, is helping both online and traditional TV broadcasters become more
social and boost their engagement levels by offering something called participation TV. iPowow allows
these content providers to seek audience input from viewers. This has opened up many new
opportunities for differentiated content creation and greater advertising inventory.
Monthly Online Video Ad Views (USA)
Source: BI Intelligence, based on ComScore data
Difference Capital - Insights Page 20 of 28When Mad Men Meets Flash Boys – May 2014
Dushan Batrovic dbatrovic@differencecapital.com
Revenue For Top 3 Video-focused Public Ad-Tech Companies ($M)
Source: Difference Capital, based on SEC Filings
11.0 Social
The use of social media has skyrocketed from relative obscurity in the mid-2000s. Facebook has reached
1.3 billion monthly active users (MAU) from a figure of less than 200 million in early 2009. The average
tweets per day on Twitter have jumped to over 500 million, which is up more than 10-fold from levels in
early 2010. The surge in social media has necessitated an equally rapid adoption of technology tools
that help companies understand and manage what all of this new content actually means. Just as
companies were finally starting to get comfortable with crafting their own websites and controlling their
email content, the landscape has dramatically changed. The discussion of brand and products is no
longer centralized at the company’s owned properties (ie. website, email, pamphlets, paid
advertisements). With social media, the discussion and sharing of content moves externally to blog
sites, forums and portals like Facebook and Twitter. At this stage companies notice that they have lost a
great deal of control over their messaging. Millions of conversations are happening that affect how a
company is being perceived in the marketplace, which will ultimately impact revenues and the bottom
line. Some companies are aiming to better understand the nature of these conversations ahead of full
product launches so they are soliciting feedback from users early in the product lifecycle. One of our
portfolio companies, Vision Critical, offers access to online groups of customers and/or prospects so that
brands get a better sense of how people will react to products, packaging, pricing, etc. before, during
and after the campaign.
Difference Capital - Insights Page 21 of 28When Mad Men Meets Flash Boys – May 2014
Dushan Batrovic dbatrovic@differencecapital.com
So now you are a corporation that has identified a need to invest some time and money into social.
Where do you spend? According to an Altimeter Group report, the average large corporation spent
$833K per year on social in 2010. We believe this figure is likely well above $1 million today. The
variation depending on the size of company is significant. Firms with less than $250 million in revenue
spent $230K per year on social. Those with more than $10 billion in revenue spent $2 million. But
where does this money go? According to the same Altimeter Group report, nearly 40% of the social
budget was directed at customer facing initiatives such as paid advertising, agency driven campaigns and
blogger programs. About 32% was spent on internal soft costs such as hiring staff and training &
development. The final 29% was devoted to technology, mainly management platforms and brand
monitoring. All three of these categories are expected to grow rapidly but technology is projected to
expand at the fastest pace at over 50% per year. While the rapid adoption of monitoring technology is
expected to generate significant data around mentions, sentiment and engagement, companies are still
going to be challenged to generate reliable ROI data. According to the Altimeter Group, “48% of social
strategists said their primary internal focus is to develop ROI measurements”.
The social ad market is growing relatively quickly but there continues to be some trepidation over how
effectively companies are able to incorporate ads in their networks. Social ad revenues are split into
two main categories – display and native. Display advertising is similar to banner ads on your PC. Not
very exciting and not very popular. Native ads are more integrated into the social experience, similar to
the Facebook and Twitter examples we cited above (ie. sponsored stories and promoted tweets). The
total social ad market is worth about $6 billion annually, split roughly 60% display and 40% native. This
is expected to increase to about $11 billion by 2017.
Social Ad Revenue Forecast ($ billion)
Source: Difference Capital, based on data from BIAKelsey
Difference Capital - Insights Page 22 of 28When Mad Men Meets Flash Boys – May 2014
Dushan Batrovic dbatrovic@differencecapital.com
12.0 So Much Potential for Greatness…and for Failure
Technology in advertising has the potential to do some amazing things with creativity and interactivity.
But as always, there is the downside. Let’s start with the bad news first. Below are some examples of
how automation in banner ads can damage brands. Most are rather comical if you’re not the brand on
display. These examples come courtesy of BusinessInsider.com.
Banner Ad Automation Failure Examples
Difference Capital - Insights Page 23 of 28When Mad Men Meets Flash Boys – May 2014
Dushan Batrovic dbatrovic@differencecapital.com
Banner Ad Automation Failure Examples
Is this ad really saying hooray for drunk driving?
Banner Ad Automation Failure Examples
Difference Capital - Insights Page 24 of 28When Mad Men Meets Flash Boys – May 2014
Dushan Batrovic dbatrovic@differencecapital.com
Now, let’s end things on a high note. These examples come courtesy of the IAB awards. The common
theme below is that video and mobility create greater engagement and emotional resonance than the
boring and stale banner ads above. Technology in combination with creativity has the potential to do
some amazing things. We hope you agree.
Coca-Cola built two interactive vending machines, one placed in India, the other in Pakistan. The
machines allowed users to stand face-to-face and interact with each other on both sides of the border.
This type of a campaign makes me want to go out and buy a Coke even though I don’t even like the
beverage.
Coca-Cola Interactive Vending Machine Campaign
Source: http://www.iab.net/mixxawardsinsights/case_studies/view/1
Difference Capital - Insights Page 25 of 28When Mad Men Meets Flash Boys – May 2014
Dushan Batrovic dbatrovic@differencecapital.com
Easy Way Language Center in Brazil built an app that translated local TV shows in real-time to any
language over a tablet or smartphone. This type of a campaign demonstrates clear utility for a
consumer. People will use it because it adds value in their lives and for those that are interested in
learning the language, there will be only one obvious choice.
Easy Way Language Center Campaign
Source: http://www.iab.net/mixxawardsinsights/case_studies/view/6
Difference Capital - Insights Page 26 of 28When Mad Men Meets Flash Boys – May 2014
Dushan Batrovic dbatrovic@differencecapital.com
Unilever created a campaign for its Axe brand, which used augmented reality, mobile, social and
traditional media to enter the public consciousness. This branding helped me become an Axe customer.
Axe Campaign
Source: http://www.iab.net/mixxawardsinsights/case_studies/view/15
Dushan Batrovic, Vice President, Difference Capital
Mr. Batrovic brings 10 years’ experience in capital markets and equity research. He is recognized as a
technology industry thought leader, having published reports related to software, networking, wireless
and digital media and making regular appearances in news media including the Financial Post, Globe and
Mail and BNN. Prior to joining Difference, Mr. Batrovic was a co-founder of 4Front Capital Partners and
was a Vice-President of Equity Research. Previously, Dushan was a senior technology analyst at Dundee
Securities and an equity research analyst at Canaccord Capital. Dushan graduated with a Bachelor of
Applied Science and Engineering from the University of Toronto where he ranked top of his senior year
class. Dushan has a Master of Business Administration from the University of Toronto where he earned
Deans’ List Honours status in both years of the program.
About Difference Capital Financial Inc.
Difference Capital Financial Inc. invests in and advises growth companies. We leverage our capital
markets expertise to help unlock the value in technology, media and healthcare companies as they
approach important milestones in their business lifecycle. Difference Capital Financial Inc. is traded
under the Toronto Stock Exchange under the symbol “DCF”. www.differencecapital.com
Difference Capital - Insights Page 27 of 28When Mad Men Meets Flash Boys – May 2014
Dushan Batrovic dbatrovic@differencecapital.com
This report is for informational purposes only and does not constitute an offer or solicitation to sell shares
or securities in any of the mentioned companies or any related or associated companies. None of the
information or analyses presented are intended to form the basis for any investment decision, and no
specific recommendations are intended. Accordingly, this presentation does not constitute investment
advice or counsel or solicitation for investment in any security.
This report does not constitute or form part of, and should not be construed as, any offer for sale or
subscription of, or any invitation to offer to buy or subscribe for, any securities, nor should it or any part
of it form the basis of, or be relied on in any connection with, any contract or commitment whatsoever.
Difference Capital expressly disclaims any and all responsibility for any direct or consequential loss or
damage of any kind whatsoever arising directly or indirectly from: (i) reliance on any information
contained in the presentation, (ii) any error, omission or inaccuracy in any such information or (iii) any
action resulting therefrom.
Difference Capital has investment positions in the following companies that are mentioned in the report:
Appinions Inc, EQ Inc, iPowow Inc, and Vision Critical Communications Inc.
Difference Capital - Insights Page 28 of 28You can also read