Dynamic Tidal Flow Lane - on Provincial Roads in the Netherlands
←
→
Page content transcription
If your browser does not render page correctly, please read the page content below

Dynamic Tidal Flow Lane
                    on Provincial Roads in the Netherlands

          Intelligent Transport Systems 2

                                                    January, 2008

                                                   Mike Fafieanie
                                                     Erik Sambell
Assessment of Dynamic Tidal Flow Lane on Provincial Roads in the Netherlands

Pref ace

In the last two months we worked on this report as part of the subject Intelligent Transport System 2 on
the University of Twente (Civil Engineering). We had the choice to come up with our own intelligent
transport system and design it. We already heard something about dynamic road marking, which is a very
interesting and innovative field of development in traffic management. Combined with some creative
thinking, our transport system was born: the Dynamic Tidal Flow lane.

We would like thank some people for their help in our project. First Mohamed Mahmod, whom was our
appointed supervisor, helped us out great and was very accurate in doing that. Nina Schaap and Bart van
Arem were also of great assistance. In order to carry out the user acceptance assessment, the 100
respondents were essential to our research. Finally, thanks to Henri Stembord (Rijkswaterstaat) for
updating us on the latest developments on DRM and helping us with some financial details of DRM.

Enschede, the Netherlands

Mike Fafieanie (s0144797)
Erik Sambell   (s0029092)

                                                                                                      1
Assessment of Dynamic Tidal Flow Lane on Provincial Roads in the Netherlands

Management Summary
      Pretext
From a congestion-free world we are now used to the daily traffic jams. Of course roads had to be
constructed and expanded to keep up in the process. Today more and more intelligent methods of road
expansion are used. One of these is Dynamic Road Marking (DRM). This technology enables road
operators to prioritize directions in their demand of capacity.
In the case of provincial roads (80km/h) DRM is also applicable. These roads are appropriate for this
system, because barriers are not a requirement like on highways is the case. The use of a dynamic lane
enables the road operator to expand road capacity during rush hours.

There are still many questions unanswered in applying a Dynamic Tidal Flow (DTF) lane on provincial
roads. This report focuses on the costs and benefits of DTF, the users’ acceptance towards transition
methods and the risks involved.

      Recommendations
From the cost-benefit analysis it can be concluded that a DTF lane is not the solution to congestion
problems on provincial roads. However, this analysis only applies to the N261. A DTF lane could be the
answer on roads with stronger tidal flows and with less space available to expand. In the case of the tidal
flow, it is very interesting to know what the maximum allowable intensity is for the calm direction during
rush hours. More study should be conducted on these matters.
The current prices of DRM are known. But there is no notion, what the level of these prices will be, in case
the DRM technology is widely used and prices drop. When these levels are known, there is more clarity
whether DRM and the DTF lane in specific are serious options. Further research is required.

The users’ assessed a transition phase with an active matrix sign above the road as most positive. A LED
arrow on the road is a good second. A combination would be most optimal, but also very expensive.
Depending on projects specifications, the road operator should select one of these three options.

Like any project, many risks are involved. Using the formulated mitigation actions, the five most relevant
risks should be controlled and/or avoided.

                                                                                                          2
Assessment of Dynamic Tidal Flow Lane on Provincial Roads in the Netherlands

Table of contents

PREFACE............................................................................................................................................... 1
MANAGEMENT SUMMARY ....................................................................................................................... 2
1      INTRODUCTION .............................................................................................................................. 4
2      BACKGROUND DRM ....................................................................................................................... 5
3      DYNAMIC TIDAL FLOW LANE ............................................................................................................. 7
4      STAKEHOLDER ASSESSMENT PLAN ...................................................................................................... 9
5      COST-BENEFIT ANALYSIS................................................................................................................. 14
6      U SER ACCEPTANCE ASSESSMENT...................................................................................................... 18
7      RISK ANALYSIS ............................................................................................................................. 22
8      CONCLUSIONS AND RECOMMENDATIONS ........................................................................................... 26
9      REFERENCES ................................................................................................................................ 27
APPENDIXES ........................................................................................................................................ 28

                                                                                                                                                      3
Assessment of Dynamic Tidal Flow Lane on Provincial Roads in the Netherlands

1 Introduction
Thanks to the technological progress made in the last decades, new tools have become available to the
road operator to battle the growing congestion. Because of the high costs, environmental issues and often
scarce space available, it becomes ever more difficult to just add a few lanes and increase capacity.
Already these problems are being solved on another level: the tidal flow lane for example, is a great
success. Also Dynamic Road Marking (DRM) offers very advanced traffic applications which have a great
potential to solve traffic problems. This report will assess such an advanced application: the Dynamic Tidal
Flow lane (DTF).

1.1 Field of interest
A 2x1 road with a DTF middle lane enables the road operator to switch the direction of the middle lane.
This should have very positive consequences for delay times on congested roads dealing with tidal flows
during rush hours. The application is especially useful for provincial roads which have little space to
expand because of environmental reasons or developments along the road. Take the picture on the front
page as example. If this road would expand to a 2x2 lane road because of tidal flow congestion, at least
one line of trees would have to be chopped. With a dynamic tidal flow lane, this would not be necessary.

1.2 Research questions
The idea of DTF has not been applied yet and a lot of gaps in knowledge exist. This report aims to tackle
some of these gaps:
    1. Do the benefits exceed the costs?
    2. In what fashion should the middle lane be closed?
    3. What are the most relevant risks involved and how should they be dealt with?

1.3 Approach
First a stakeholder assessment plan is created, as preparation for research questions one and two.
The first research question is about the impact on traffic and the costs of road expansion. The impact and
costs of conventional road expansion and DTF expansion are compared, leading to a conclusion. Parts of
the stakeholder assessment plan are used to measure impact.
Closing the middle lane in order to switch directions is called a transition. It is unknown what the road
user desires in terms of signals. To find out what is acceptable, using the stakeholder assessment plan, a
user acceptance assessment is carried out. A questionnaire is used to obtain the necessary data.
In order to answer the third research question, a risk analysis using the RAID approach is conducted. The
end results are mitigation actions to control or avoid key risks.

1.4 Structure
First a background (chapter 2) and a description of the application (chapter 3) is presented. In chapter 4 a
stakeholder assessment plan using the CONVERGE approach is described. Following this assessment plan
is a cost-benefit analysis (chapter 5) through an impact assessment and financial analysis. The second
assessment is the user acceptance assessment (chapter 6). This assessment targets to measure the user
acceptance of different transition methods available to close the middle lane. Chapter 7 describes the risk
assessment. Key risks are described and mitigation actions for these risks are proposed. Finally,
conclusions and recommendations are included in chapter 8.

                                                                                                          4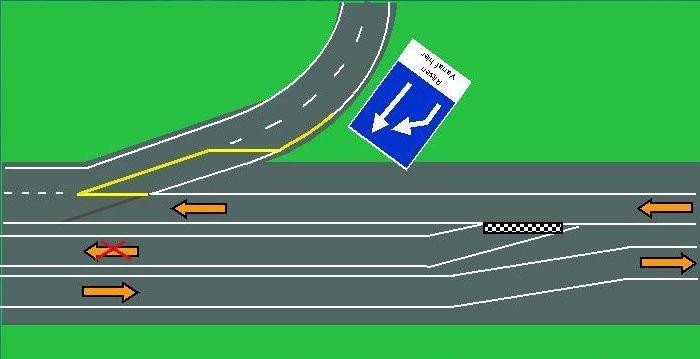
Assessment of Dynamic Tidal Flow Lane on Provincial Roads in the Netherlands

2 Background DRM
This chapter serves as an introduction to DRM. First the need for DRM and its history is discussed. Next
DRM in foreign countries is shortly mentioned.

2.1 Need for DRM
Dynamic Road Marking has an enormous potential to use road networks more flexible and efficient. It is
especially useful in tidal traffic flows. A tidal flow occurs in case a road experiences congestion during the
morning rush hour in direction A to B and during evening rush hour in direction B to A. Tidal flows often
have one characteristic common: greatly inefficient use of the road capacity. DRM could be applied on
very different ways to use the road capacity more efficient by adapting to the demand of capacity. Some
promising applications are dynamic rush-hour lanes, dynamic on- and off ramps, dynamic marking in case
of road works and dynamic bus lanes.

2.2 DRM in the Netherlands
In the Netherlands, DRM began its existence in the Programme for Innovation ‘Roads to the Future’. DRM
fitted in the Dutch national policy of a more optimal utilization of the existing infrastructure. Since the
programme started, the technology of DRM instruments as well as the traffic application has steadily
developed.

In order to develop DRM, pilots were carried out from 1999 to 2005. These are shown in table 1.
                         Table 1. DRM Pilots in the Netherlands [Rijkswaterstaat, 2005a]
Year      Pilot (location)                                        Primary target
1999      A15 (between Papendrecht and Wijngaarden)               Technology and transport oriented
2001      A12 (near Utrecht)                                      Technology and transport oriented
2003      A44 (near Amsterdam)                                    Technology
2004      RWS test centre (Delft)                                 Light technology
2004      A50 (near Schaarsbergen)                                Transport oriented
2005      A2 (near Den Bosch)                                     Transport oriented

An important conclusion was the better utilization of capacity;          Figure 1. DRM in the Netherlands (Source:
this was especially the case at pilots experimenting with a                     Heijmans, The Netherlands)
dynamic rush hour lane.
Most problems occurring mainly concerned the lightning and
user behaviour. Some of light technologies could not withstand
the forces caused by traffic and broke down. In the beginning
there were problems concerning the amount of electricity
needed, but this was later solved using technologies which
required less electricity like LED lights. At one pilot the lining had
a very low visibility during bright sun shine. At present the
lightning problems are solved and some DRM systems can be
functional and able to withstand forces from traffic.
Besides technology, users tend to experience DRM very
negatively if it is suddenly switched on. An introductory section
or time period is needed to avoid this behaviour. If such a
section or time period was applied, most drivers did understand
the dynamic marking and complied with it.

                                                                                                               5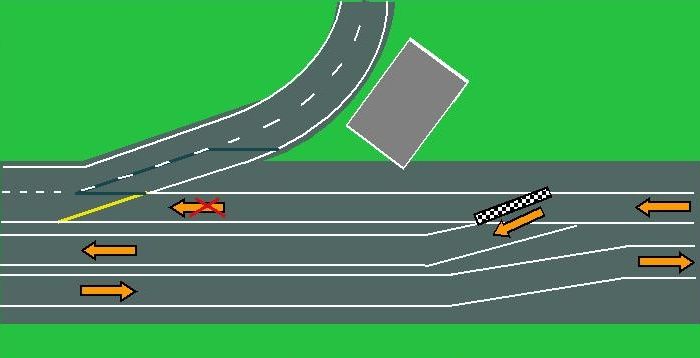
Assessment of Dynamic Tidal Flow Lane on Provincial Roads in the Netherlands

The pilots were very informative, but it is also apparent that DRM as an instrument is not yet fully
developed. Examples of knowledge gaps are the factual quantitative surplus value of DRM applications for
traffic management, the costs at large scale applications and the legal status which DRM should have in
traffic regulations. The cooperation of public and private stakeholders is also not clear yet
[Rijkswaterstaat, 2005a].

Since October 2007 a DRM is functional at a ramp on a junction (A50/A73) near Ewijk. Experiences are
positive, the big disadvantage to this point are the high costs. Because DRM is not used massively,
overhead costs are high. Figure 2 shows the junction with the DRM implemented.
                            Figure 2. DRM junction Ewijk (source: Rijkswaterstaat)
               Low traffic volume: no priority                 Rush hour: A50 > A73 has priority

DRM is planned for implementation in 2008 on another junction (A12/A18) near Ouddijk. Just as in Ewijk,
priority can be given to through traffic or to joining traffic, shown in figure 3.
                           Figure 3. DRM junction Ouddijk (source: Rijkswaterstaat)
            Low traffic volume: A12 has priority                 Rush hour: A18 has priority

2.3 DRM in foreign countries
DRM already has been implemented in three countries: Germany, Norway and Spain. In Frankfurt Am
Main (Germany), where the Bundesautobahn A5 separates from the A66, DRM is applied. In normal traffic
conditions one exit lane is available, but during rush hours DRM creates a second exit lane. This measure
is indicated during rush hours by two parallel lines of lights, 700 meter in length.
In Oslo (Norway), DRM is applied for the purpose of lane shifting for road works in a tunnel. In Sevilla
(Spain), DRM is used on the ring road SE30. A road section with Tidal Flow is indicated with DRM
[Rijkswaterstaat, 2005].

                                                                                                       6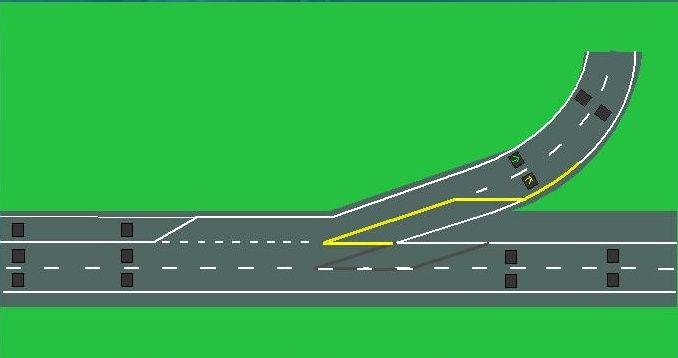
Assessment of Dynamic Tidal Flow Lane on Provincial Roads in the Netherlands

3 Dynamic Tidal Flow Lane
This chapter describes the application. Its domain, function, operation, advantages and issues are
discussed.

3.1 Domain and function
The specific application considered in this report is for use on the provincial roads in the Netherlands.
These roads have 2x1 or 2x2 lane designs. In this report, the 2x1 version with a maximum speed of 80
km/h is relevant. With these speeds a physical barrier is not a requirement. Provincial roads that do not
have sufficient capacity during rush hours, and have rush hours behaving like a tidal flow, are of particular
interest for the application.
A provincial road equipped with a DTF middle lane can be switched from direction. It is closed and opened
through changing the dynamic marking along this middle lane. The road marking can be shown as a
continuous line or as striping. Figure 4 illustrates this transition.

3.2 Operation
To give the reader a more practical view of the application, the operation of the application is discussed
next.

3.2.1 Transition
It is essential that the transition occurs in a safe manner. It has to be absolutely clear to drivers to which
direction the middle lane is assigned. Figure 4 shows in schematised fashion the functioning of the
application. The chosen time periods are fictional, the grey arrows and red crossed are only put in to
clarify the picture.
                                       Figure 4. Transition middle lane

In the morning rush hour the middle lane is assigned for traffic driving from the village to the city: the
‘busy’ direction. Ten minutes before noon drivers are signalled of the coming closure of the middle lane.
At noon the middle lane is closed.
3.2.2 Technology
The technology lies outside the scope of this report. It is assumed that the technology is durable and has
the same appearance as fixed white marking. The common technology most manufacturers use, is LED
lights (appendix 2).

3.3 Advantages
There are major advantages of this application compared to expanding a 2x1 road to 2x2 road:
    • Less space required than conventional expansion. This could result in less costs and a higher
        support of the public.
    • The LED lights could make conventional lighting above the road unnecessary.

                                                                                                            7
Assessment of Dynamic Tidal Flow Lane on Provincial Roads in the Netherlands

    •   Function is expandable. Not only could the DRM be used for tidal flow, but it could also be
        transformed later. Examples are dynamic bus-lanes, road works, emergency services, accident
        control or other applications.
    •   Use of the road is more optimal.

3.4 Issues
Apart from the R&D issues concerning DRM, the interaction of this application with the road user is very
important. If interaction fails, and it is not clear to the driver which actions are desired, than traffic flow
could be distorted and safety of road users could be in danger. Especially in the case of the transition
phase, user acceptance is very important.
Besides the user acceptance, it is unknown whether a DTF lane is cost-effective. Especially benefits
(increasing efficiency of traffic flow) are not measured in monetary units yet.

                                                                                                             8
Assessment of Dynamic Tidal Flow Lane on Provincial Roads in the Netherlands

4 Stakeholder Assessment Plan
In this chapter, an assessment plan is made for two stakeholders: road operator and road user. The goal is
to achieve a better understanding of these stakeholders and the functioning of the application. For each
stakeholder, the CONVERGE approach (Ertico, 1998) is followed. This approach is a guidebook for
assessment of transport telematics applications. CONVERGE identifies seven key stages which constitute a
generic assessment process:
     1. Definition of user needs
     2. Describing applications
     3. Defining assessment objectives
     4. Pre-assessment of expected impacts
     5. Assessment methods
     6. Data analysis
     7. Reporting results
This order of stages is used in the assessment plans for the road operator and road user.

4.1 Definition of user needs
How can the application be designed to best meet the users’ needs? The user needs of a decision maker
(road operator) and a direct user (road user) are described in this subsection.

4.1.1 Road operator (decision maker)
In the Netherlands the responsibility for provincial roads (mostly N-roads) is divides among the twelve
provinces. The needs of the road operator are:
     • Safety (accident prevention/management)
     • Smooth traffic flow
     • Efficient traffic flow
In the last years also the environment has a role in the decision making. Because of its minor role, it will
not be considered in this report.
In order to use the DRM application effectively, and pursue a smoother and more efficient traffic flow
while sustaining safety levels, it is important that drivers fully understand the indications given by dynamic
markings and be able to follow these indications. The user needs of road users are essential.

4.1.2 Road user (direct user)
The road users considered for the development of the application are the drivers (stuck) in the tidal flow:
mostly commercial (e.g. trucks) and commuter traffic. The user needs of these road users are:
    • Safety
    • Comfort
    • Congestion-free roads
In order to fulfil these needs, two conditions have to be met: indications given by the DRM has to be fully
clear and drivers should have enough time to respond to and act according to the indications.

4.1.3 Other stakeholders
Other stakeholders whom are affected by the application are:
    • Manufacturers of DRM
    • Researchers
    • Organized lobbies (ANWB)
    • National road operator (Rijkswaterstaat and ministry)
    • Residents alongside provincial roads

                                                                                                            9
Assessment of Dynamic Tidal Flow Lane on Provincial Roads in the Netherlands
The national road operator is Rijkswaterstaat, and has operational responsibility for the national
highways. Rijkswaterstaat is supervised by the Ministry of Transport and Public Works. The ministry does
not only carry out transport policies but also develops them. The policies are aimed at accessibility, safety
and liveability [verkeerenwaterstaat.nl, 2007], and concur with the policies of the provincial road
operators.
4.2 Application description
The key characteristics of the application need to be clear for an effective assessment plan. Four key
characteristics are distinguished: application name, major technologies, functionality and demonstration
sites. Table 2 shows the content of these characteristics.
Table 2. Description of application
Application: Dynamic Road Marking
Technology • Light: 5 tested technologies (Appendix A) using LED (4) or halogen (1)
• Cables for energy and communication
• Operator interface
Function Changing direction of the middle lane
Demonstration Netherlands: dynamic rush hour lane, on and off ramps (pilots)
sites Germany: dynamic exit lane (functioning)
Norway: dynamic lanes for road works (functioning)
Spain: tidal flow section (functioning)
4.3 Defining assessment objectives
Two assessments will be carried out: an impact assessment for the road operator and a user acceptance
assessment. In this subsection the assessment objectives are described. First the user needs of the
decision maker (road operator) are translated to assessment objectives. If the needs of the road operator
are fulfilled, the needs of the road user are also fulfilled.
Table 3. Decision makers, user groups involved and objectives
Application Decision Maker Objectives
Dynamic Road Road operator • Smoother traffic flow
Marking • More efficient traffic flow
• Maintain safety levels
These objectives will be translated to assessment objectives for the impact assessment and the user
acceptance assessment. The objective of the impact assessment is to measure the effectiveness of the
application in terms of traffic flow. The objective of the user acceptance assessment is to estimate users’
attitudes to different transition methods of the application. It would be very dangerous in case road users
would not understand the signals. Table 4 summarizes the assessment objectives.
Table 4. Assessment objectives, assessment category and user groups
Assessment category Assessment objective User groups involved in
validation
Impact assessment Measure effectiveness Road operator
User acceptance assessment Estimate users’ acceptance towards Road user (driver)
different transition methods
10Assessment of Dynamic Tidal Flow Lane on Provincial Roads in the Netherlands
4.4 Pre-assessment of expected impacts
A pre-assessment of expected impacts is necessary to get a good idea of the nature and scale of likely
impacts. First, the expectations of the impact assessment are written down in the table below.
Table 5. Expectations Impact Assessment
Assessment Target group Impact
Impact assessment Road operator Lower delays (hours)
User acceptance assessment Road user Negative to positive
4.5 Assessment methods
The assessment methodology is an important step in the assessment plan, and more extensive than the
other steps. This stage is conducted through six steps: definition of indicators, reference case, data
collection, conditions of measurements, statistical considerations and the integrity of measurement.
These steps are summarized at the end.
4.5.1 Definition of indicators
Indicators are used for estimating the performance or impacts of a transport telematics application. This
will give an idea of how far the objectives will be achieved by the application. Two basic requirements
have to be taken into account when defining indicators:
• The indicators must be able to reflect clearly the related performance or impact.
• The indicators must be capable of reliable assessment using the experimental tools and
measurement methods chosen.
The indicator for the impact assessment will be delay. Delay is expressed in time (minutes) and is caused
by vehicles driving below their desired speed. For example, (overtaking) trucks often cause delays. Delay is
often used as a performance indicator for transport systems.
The indicator for the user acceptance assessment will be expressed as the scale for usefulness and
satisfaction running from -2 to +2.
4.5.2 Reference case
The reference case for the impact assessment is a 2x1 lane situation. From this point onwards the road
operator has three possibilities: conventional expansion to a 2x2 lane road and expansion to a DTF lane.
The DTF lane possibility can be configured in two ways: an optimal configuration and only used in rush
hours (for legal reasons).
The user acceptance requires a reference case with a transition. The reference case is a matrix sign above
the road with green arrow pointing to the right (option 1). This is the most conventional option and
regarded as useful and satisfying to users. The four tested transition methods are:
2. White arrow (LED) on the road
3. Red cross (LED) on the road
4. Red blinking cross (LED) on the road
5. White blinking continuous line
4.5.3 Data collection
A real-life experiment would be unpractical for many reasons. That is why the application and the
reference cases are modelled in the transport model AIMSUN to measure the effectiveness. Through
using a screenshot, from Google Maps, the road can be simulated. AIMSUN requires traffic intensities to
load the links. The selected N-road must have tidal flow conditions and congestion at rush hours.
Measuring of acceptance can be done best through the simulation of the five methods. The user should
‘drive’ in the different simulated scenarios.
11Assessment of Dynamic Tidal Flow Lane on Provincial Roads in the Netherlands
In this project the users’ acceptance is estimated by using the VanderLaan scale. The scale aims to assess
the acceptance of advanced transport telematics through measuring usefulness and satisfaction of the
user. The technique is simple and consists of nine 5-point rating-scale items. These items load on two
scales: a scale denoting the usefulness of the system, and a scale designating satisfaction. The scale
enables researchers to check on validity of the results [Van der Laan, 1996]. Table 6 shows the nine items.
Table 6. VanderLaan scale (usefulness: 1,3,5,7,9 – satisfaction: 2,4,6,8)
1. useful ¨¨¨¨¨ useless
2. pleasant ¨¨¨¨¨ unpleasant
3. bad ¨¨¨¨¨ good
4. nice ¨¨¨¨¨ annoying
5. effective ¨¨¨¨¨ superfluous
6. irritating ¨¨¨¨¨ likeable
7. assisting ¨¨¨¨¨ worthless
8. undesirable ¨¨¨¨¨ desirable
9. raising alertness ¨¨¨¨¨ sleep-inducing
It is advisable to record the age of the respondent. This is because older drivers may have different
opinions than young drivers. The role of driving experience is not clear yet. That is why the respondent
should be asked if he or she owns a driving license.
4.5.4 Conditions of measurements
Because the impact assessment is modelled and the methods within the user acceptance assessment are
simulated, environment conditions are fully controlled. That makes it easy to match conditions.
In the simulation, the input data has to be the same for each case. Also the road has to be equally drawn.
In the questionnaire the roadside, inside of the car, etc. have to be completely similar in all simulated
transition methods. Practically only the marking and/or signs may differ.
4.5.5 Statistical considerations
The VanderLaan scale has nine items measuring scales usefulness and satisfaction (Table 6). This division
in these nine items is used to measure consistency of the items in the usefulness and the satisfaction
group. Cronbach’s α is used to calculate the correlation between items and will generally increase when
the correlations between items increase. Cronbach's α is defined as:
N σ X − ∑ i =1 σ Yi
2 N 2
N −1 σ X2
Where:
N the number of components
σ X2 is the variance of the observed total test scores
σ Yi2 is the variance of component i
The VanderLaan method states that reliability is sufficiently high if Cronbach’s α is above 0.65.
4.5.6 Integrity of measurement
The three considerations of the assessment process are completeness, insularity and disturbance.
• Completeness: the simulation has to be realistic enough to be complete. That is also the case for
the traffic model.
• Insularity: no factors have been identified as missed and having a significant effect on the
performance of the application and the reference application.
• Disturbance of the validation process: there may be accidental or intended bias introduced into
the measurement process by such factors as: respondent fatigue, policy response bias and
12Assessment of Dynamic Tidal Flow Lane on Provincial Roads in the Netherlands
justification bias. The questionnaire takes a maximum of 10 minutes, so it is not expected that
respondents get tired and rush through the questionnaire. Respondents do not have direct
interests in the topic, so policy response bias is unlikely. In case the questionnaire can be filled in
anonymous, a justification bias is not likely to happen.
4.5.7 Summary
Table 7 summarizes the steps.
Table 7. Summary assessment methods
Item Impact Assessment User acceptance assessment
Assessment objective Measure effectiveness Estimate users’ acceptance towards
different transition methods
Indicator Delay (minutes) Usefulness and satisfaction
Reference case 2x1 lane road, 2x2 lane road Matrix sign
Methods of measurement Transport model Online questionnaire/simulation
Measurement or simulation Morning rush hour (traffic data Only marking/signs change in
conditions from real road) simulation
Statistical confidence level Not applicable α > 0.65
Overall definition of success Lower delays Positive assessment of one or two
transition methods
Integrity of measurement OK Disturbance is unlikely
4.6 Data analysis
The data analysis for the impact assessment is very straight-forward. The output from the transport model
can be exported into a software programme like Excel and results can be compared.
Analysing data for user acceptance assessment is more complex. First data (scores, age and driving
license) has to be exported in Excel. Then the results have to be checked through Cronbach’s α. If this test
holds, the results can be averaged for usefulness and satisfaction. This can be done for all respondents or
the different age categories.
4.7 Reporting results
The results are eventually most important for the road operators. The impact assessment helps them to
make the decision for the implementation of DTF lane application. The user acceptance assessment helps
to design the dynamic lane. The report, aimed at the road operators, should be divided in three parts:
Part I Key validation results at project level
Part II Detailed validation results
Part III Comparison of validation results across sites
The decision-maker (road operator) is especially interested in the first part. The second and third parts are
the more detailed parts of the report.
13Assessment of Dynamic Tidal Flow Lane on Provincial Roads in the Netherlands
5 Cost-benefit Analysis
This chapter will evaluate costs and benefits of the DTF lane to conclude whether this application is cost-
effective or not.
5.1 Impact Assessment
5.1.1 Goal
The goal of the simulation is to investigate what the impact on traffic flows is for the four different
scenarios. These scenarios are the 2x1 lanes, 2x2 lanes and 2x1 + DTF lane. The DTF lane scenario is
divided in two scenarios. The first scenario functions only during rush hours (from 6:00 – 10:00 and from
15:00 – 20:00). The second system functions the whole day (from 3:00 – 9:00 and from 9:00 – 3:00). The
DTF lane is opened for the direction which has the highest intensity. Logically the first, less optimal DTF
system, causes a lower decrease in delay times than the second. However, this scenario is used for legal
reasons. In the Netherlands road operators are obliged to do a research on the environmental impacts
(MER study) when planning a tidal flow lane. However, a few tidal flow lanes in the Netherlands can only
open in rush hours because the effects on air quality were not researched sufficient.
5.1.2 Method
The impact assessment is simulated through the micro simulation program Figure 5. Screenshot in AIMSUN
Aimsun. This computer program has the possibility to simulate different
scenarios on the road. The output of Aimsun is converted to Access and Excel.
In Excel, the different situations are compared and the final results calculated.
First the N261 is modelled in Aimsun. A Google Maps screenshot is imported
in Aimsun and a vector is drawn over the road. Two centroids, at the
beginning and ending of the road, are placed: one for the departures and one
for arrivals. These centroids are linked to the road.
The four centroids require an O/D matrix to distribute vehicles on the road.
The vehicles are separated in cars and trucks and loaded on the network from
0:00 till 24:00. The average workday intensities were extracted from the traffic
website of the province Noord-Brabant. Intensities for Saturday and Sunday
are harder to come by, so a ratio for these days is used. This is acceptable,
because there is less congestion in the weekend and delays are lower. The
weekend adds 15% delay times.
The next step is defining scenarios. The scenarios are linked to an experiment
with their own configuration. A dynamic lane is not available in Aimsun, so this
is simulated by a 2x2 lanes road. One of the four lanes is always closed. A
transition (two lanes closed) takes up fifteen minutes.
The last part of the method is performing the simulation. Each scenario is simulated five times to increase
reliability of the simulations. These five replications are averaged.
5.1.3 Results
The total delay times for the four simulations are shown in the table below.
Table 8. Delay times on workdays
Scenario Total delay on workday
2x1 lanes 325 hours
DTF1 – rush hours 257 hours
DTF2 – optimal 214 hours
2x2 lanes 083 hours
14Assessment of Dynamic Tidal Flow Lane on Provincial Roads in the Netherlands
The results of the simulation are as expected.
• The 2x1 lane scenario has the highest delay times and the 2x2 lane scenario the lowest.
• The delay times of the DTF lane scenarios are in between. The DRM scenario, which only operates in
the rush hours, has higher delay times.
The influence of trucks on delay
Unfortunately the DTF lane scenarios still have high delay times,
Through two new experiments, the
during the rush hours, for the direction without the DRM lane. This influence of trucks on delay times is
could be caused by trucks. Most car drivers desire an estimated measured. In the first experiment only
speed of 85 km/h, but the trucks only drive at approximately 20% of the trucks was assigned, in the
75km/h. This means that vehicles behind a truck experience second no trucks are assigned.
delays. However, an experiment shows that trucks are not to
Scenario 20% trucks No trucks
blame. More information on this is available in the text-box. 2x1 lanes 278 263
Still the DTF lane scenarios provide less delay than the 2x1 lane DTF1 - rh 220 204
scenario. Especially in rush hours, the direction with the highest DTF2 - opt 182 166
intensity has much lower delay times because of the second lane. 2x2 lanes 63 56
Chart 1 shows the individual delay times for every ten minutes. It is The results show that a smaller part of
trucks does not increase the benefit in
visible to which direction the DTF lane is assigned. For the first delay times of an optimal DTF lane
configuration this happens on 09:00, the transition in the optimal compared to a 2x1 lanes road.
configuration occurs on 15:00.
Chart 1. Delay times
5.1.4 Conclusion
The results of the simulation do look very realistic. The 2x2 lane is simply the best option in case of the
N261, because the delay times are much lower. Nevertheless, the results show that DRM reduces delay
times significantly. Two external situations would positively effect the decision for a DTF lane:
• There is not a lot of space around the road, so expanding to 2x2 lanes could be problematic.
• There is a matter of high tidal flow. In the direction with only one lane during the rush hours the
intensities must not be higher than about 1000 veh/hour. Otherwise this lane causes too much
delay times.
15Assessment of Dynamic Tidal Flow Lane on Provincial Roads in the Netherlands
5.2 Delay in financial terms
For each scenario the decrease in delay times can be converted to monetary units. These benefits (the
delay time has decreased) can be compared with construction and operation costs later on.
Table 9 shows that each motive of travel has its own value of time. These values are used in calculating
delay costs. For example, in case a truck driver experiences congestion causing a delay of 2 hours, the
damage is 84.70 euro.
Table 9. Value of time
Mode One hour delay
Cars – work trips € 8.57,-
Cars – business trips € 29.67,-
Cars – other trips € 5.92,-
Trucks – freight € 42.35,-
The amount of cars and trucks are imported in the O/D matrix in Aimsun. The division of motives in car
trips are given by percentages for each hour [Thomas, 2007]. From statistics are the partitions known for
the different motives. In rush hours, these are mostly work trips. The rest of the day mostly attracts
business and other trips.
Aimsun determines the amount and the delay of vehicles for each ten minutes. The delays can be
multiplied with the amount of vehicles for the total delay. These total delays can be divided in trucks and
cars (three motives). Next, the delay is converted to hours. This delay can be multiplied with the value of
time. The sum of all the hours is the total delay cost for one day.
It is assumed that the delay in the weekend adds 15% in delay times. The costs of all days in a year are
shown in the table below.
Table 10. Total delay costs
Mode Costs for yearly delays
2x1 lanes € 1.500.000
DTF1 – rush hours € 1.250.000
DTF2 – optimal € 1.000.000
2x2 lanes € 410.000
5.3 Project in financial terms
The project is determined to last for 10 years. The main costs of road expansion can be split up in three
parts: construction costs, costs for DRM implementation and the energy consumption of DRM. Also other
costs are estimated. Maintenance costs are not taken up in the analysis, because costs are analysed for
the life cycle only. Accidental maintenance costs are included in ‘other costs’.
The construction costs are based on figures from website bouwkosten-online.nl. The costs are estimated
at € 497 per meter for expansion to a 2x2 road and € 226 per meter for a DTF lane expansion.
The costs for implementing DRM are estimated at € 650,000 per kilometre. This includes the lights, cables
and construction. This figure is retrieved from Rijkswaterstaat and based on a DRM project in Ewijk,
mentioned in the background (Chapter 2). Currently the costs are very high, because DRM is not yet
massively produced. On this moment Rijkswaterstaat (Dienst Verkeer en Scheepvaart) is working out DRM
scenarios in order to estimate future costs. Unfortunately, no figures are available yet. In this report the
16Assessment of Dynamic Tidal Flow Lane on Provincial Roads in the Netherlands
costs of DRM are used through three scenarios: € 650/m (100%), €488/m (75%) and €325/m (50%). The
system, including operation controls, is expected to last for up to 10 years [Rijkswaterstaat, 2005b]. €
25,000 per year is added for extra signs
Energy consumption is determined on the basis of the amount of lights, the energy need (Watt) and the
price of energy:
• Every five cm four lights next to each other on two lines make 160,000 lights per km.
• Energy consumption is 9 mW for each light (Appendix 5).
• The current energy tariff is € 68.42 / MWh [Endex.nl, 2008].
Thus each kilometre of DRM costs € 863 per year.
The other costs include boarding, adaptation of junctions, organization costs and accidental costs. These
are estimated at € 200,000 per year. Table 11 shows the costs on a yearly basis.
Table 11. Yearly costs
Scenario Road constr. DRM Energy Other costs Yearly costs
DRM Scenario 1 € 153.680 € 459,000 € 5,900 € 200,000 € 818,580
DRM Scenario 2 € 153.680 € 361,250 € 5,900 € 200,000 € 720,830
DRM Scenario 3 € 153.680 € 246,500 € 5,900 € 200,000 € 606,080
Expansion 2x2 € 338.096 €0 €0 € 200.000 € 538.096
5.4 Conclusions
Table 12 displays the yearly netto benefit of each scenario. The optimal DRM configuration is used for the
benefits of the DRM scenarios.
Table 12. Yearly costs and benefits
Scenario Costs Benefits Netto
DRM Scenario 1 € 819,000 € 500.000 -€ 319,000
DRM Scenario 2 € 721,000 € 500.000 -€ 221,000
DRM Scenario 3 € 606,000 € 500.000 -€ 106,000
Expansion 2x2 € 538,000 € 1.090.000 € 552,000
Unfortunately all the DRM scenarios cost more than they contribute. It is clear that a DTF lane is not an
option on the N261. The costs for implementing DRM are calculated to be on a level of 23% of today’s
prices to be cost-effective.
So why is a DTF lane no option for this road, could it be an option on other roads? That is possible, but
some conditions have to be met.
• Unless costs for DRM will not decrease dramatically to levels below 23%, benefits have to be
higher. Tidal flow conditions have to be stronger: less traffic on the calm lane and more on the
busy lane.
• Conventional expansion is less attractive with high construction costs. In the city, for example,
expanding a small road to a 2x2 road requires lots of expensive territory. Another example is a
bridge, having to broaden a bridge is extremely expansive. A DTF lane could be a real solution in
these situations.
17Assessment of Dynamic Tidal Flow Lane on Provincial Roads in the Netherlands
6 User Acceptance Assessment
The goal of this assessment is to measure the user acceptance of different signal methods. The methods
are targeted at the driver to make clear he/she has to switch to the right lane because the transition from
two lanes to one lane is about to take place.
6.1 Questionnaire
A website is constructed, on which the questionnaire was placed: www.ex-plore.nl/its2. Besides the
questionnaire, the research purposes are explained and the visitor is informed about the questionnaire.
The methods are represented by a flash animation. This movie-like image gives the respondent the feeling
that he/ she is driving in a car on the DTF middle lane. In each scenario, the driver is pointed out, with
different methods, to leave the middle lane and switch to the right lane. The following transition methods
will be investigated:
1. Matrix sign above the road with green arrow pointing to the right
2. White arrow on the road
3. Red cross on the road
4. Red blinking cross on the road
5. White blinking continuous line
Figure 6 shows a screenshot of scenario 3 in the questionnaire.
Figure 6. Scenario 3 simulated: Red cross on the road
The respondent has to assess the different methods which the nine items of the VanderLaan scale (more
on this in chapter 4). After assessing the items, the respondent has to fill in his age and whether he owns
a driving license. The respondent could also give remarks if desired.
6.2 Data processing
If the respondent submits the questionnaire, the choices of the respondent are automatically mailed. This
data is copied to Excel through the use of an automatic script (Excel macro). In Excel, the scores are linked
with the matching values (-2, -1, 0, 1, 2). The first step is now completed.
The second step is to convert the input data to a useable data which is progressed to final results. Again
an automatic script is used to generate a table with all the input data (age, driving license, scores and
remarks). The average values for the nine items are extracted and averaged over all the respondents.
These values are the scores for the transition methods. In total, there are ten scores (five methods *
(satisfying + usefulness)). These scores are calculated for the total group of respondents independent of
the age. The age could be important for the choices, so also for five age categories, the scores are
18Assessment of Dynamic Tidal Flow Lane on Provincial Roads in the Netherlands
calculated. This results in a total of 60 scores. These scores show the satisfying and usefulness for the five
transition methods dependent of age.
6.3 Respondents
There are 95 respondents who submitted useful data. Four responses were not useful, because these did
not contain scores to all items. Of these 95 respondents only three people do not own a driving license.
This is very low; it is impossible to compare people with a driving license and without one.
The figure below shows the amount of respondents in the different age categories. As expected, most
respondents have an age from 18 to 25, because a lot of colleague participated. In spite of this, there
were sufficient respondents in the age categories 26-35 and 36-45. The last two age categories have only
7 and 10 respondents. This may influence the results, because the amount is too low to have
representative results. This will be discussed in the subsection with results (6.5).
Chart 2. The amount of respondents for the different age categories
6.4 Validity
The reliability of the research depends on the respondents. If a respondent is not very serious, the results
could be negatively influenced. The VanderLaan method can measure consistency through Cronbach’s α,
this was explained in chapter 3. The VanderLaan method states that reliability is sufficiently high if
Cronbach’s α is above 0.65. The validity is measured for all 60 scores.
In the table below the reliability values for all methods and age categories are summarized.
Table 13. Reliability, by using Cronbach’s α, of the questionnaire results
Scenario Item all 18-25 26-35 36-45 46-55 56-65
Matrix signs Usefulness 0,79 0,54 0,81 0,87 0,84 0,87
Satisfying 0,68 0,62 0,74 0,75 0,32 0,74
Red cross Usefulness 0,90 0,83 0,96 0,90 0,91 0,90
Satisfying 0,80 0,69 0,87 0,78 0,79 0,86
Flashing Line Usefulness 0,81 0,81 0,83 0,80 0,89 0,77
Satisfying 0,79 0,81 0,82 0,77 0,75 0,68
Arrow Usefulness 0,86 0,55 0,84 0,90 0,87 0,95
Satisfying 0,74 0,62 0,80 0,71 0,52 0,87
Flashing red cross Usefulness 0,87 0,79 0,92 0,91 0,83 0,88
Satisfying 0,82 0,81 0,84 0,85 0,73 -0,36
19Assessment of Dynamic Tidal Flow Lane on Provincial Roads in the Netherlands
The values of the table results in the following conclusions:
• The proven reliability of all scores is the most important result. The lowest Cronbach’s α value is
0.68, which is just higher than 0.65.
• For the respondent age 18-25 (mostly students) the reliability is not proven for all ten scores. The
satisfying and usefulness values for the matrix signs (method 1) and the arrow (method 4) are not
above 0.65. The students were probably not very serious during the research.
• The fourth age category (46-55) is reasonably reliable, only the satisfaction for the matrix signs
and the usefulness for the arrows are below 0.65. The other values are at least 0.73.
• The oldest respondents (56-65) have a reliable value for nine of ten scores. The satisfying score
for the flashing red cross is very unreliable. Strangely most respondents in this age category rated
it undesirable, but pleasant and likeable. These items all belong to the satisfying scale, which
causes an unreliable value.
6.5 Results
The results of the questionnaire contain 60 scores which are discussed in this subsection. The values of
the table below represent the averages of all the average scores of each respondent for usefulness and
satisfying. The scale has a maximum value of +2.0 and a minimum value of -2.0.
Table 14. Final results of the questionnaire (green = positive, red = negative)
Scenario Item all 18-25 26-35 36-45 46-55 56-65
Matrix signs Usefulness 0,93 0,76* 1,17 1,07 0,94 0,60
Satisfying 0,53 0,48* 0,79 0,59 0,43* 0,04
Red cross Usefulness 0,52 0,59 0,46 0,40 0,50 0,83
Satisfying -0,39 -0,58 -0,49 -0,23 -0,40 0,18
Flashing Line Usefulness -0,75 -0,78 -0,74 -0,78 -0,52 -0,83
Satisfying -1,26 -1,31 -1,21 -1,39 -1,00 -1,07
Arrow Usefulness 0,71 0,84* 0,93 0,51 0,50 0,60
Satisfying 0,61 0,79* 0,71 0,37 0,43* 0,64
Flashing red cross Usefulness 0,36 0,36 0,23 0,30 0,44 0,80
Satisfying -0,94 -1,15 -1,03 -0,74 -0,73 -0,75*
Table 14 results in the following conclusions:
1. The usefulness for the matrix signs is for all age categories the highest except for the age
category 56-65. They give the highest score to the red cross and the arrow. The reaction time of
older people is lower and they want to focus themselves on the road. This could explain why this
group likes the matrix signs less.
2. The second-best scenario is the arrow on the road surface. The usefulness and satisfying of the arrow
is for all age categories positive.
3. People prefer an arrow (an instruction) in stead of a cross (a prohibition).
4. The respondents think the non-flashing cross is more useful than the flashing cross, except for the age
category 56-65. However, the satisfying is very low, so both transition methods remain bad options.
5. The flashing line has a very low satisfying and usefulness score. Many people do not understand the
flashing line and perceive it as annoying.
20Assessment of Dynamic Tidal Flow Lane on Provincial Roads in the Netherlands
6.6 Final results
The column ‘all’ in Table 14 is not very representative, because the respondents are distributed differently
over the age categories than the average group of people on the road. This is why the scores of each age
categories are multiplied with the real percentage of driven kilometres. This information is available in the
SWOV COGNOS database.
The scores for the different age categories (SWOV uses other age categories) are calculated again and
multiplied with the percentages of Error! Reference source not found. (Appendix VI). This results in the
scores which are given in Table 15.
Table 15. Scores for methods multiplied with percentages
Option Item Score
Matrix signs Usefulness 0,97
Satisfying 0,48
Red cross Usefulness 0,56
Satisfying -0,25
Flashing Line Usefulness -0,72
Satisfying -1,16
Arrow Usefulness 0,63
Satisfying 0,51
Flashing red cross Usefulness 0,46
Satisfying -0,79
It is very clear that the matrix sign has the highest usefulness score. The satisfying scale of the arrow is just
higher then the satisfying of the matrix signs. However, the scores of the different age categories should
still be taken into account.
6.7 Conclusion
The matrix sign could be sufficient, but has a low satisfying score for the respondent age 56-65. The arrow
scores overall a bit lower, but is a good alternative. Probably the combination of a matrix sign and an
arrow on the road surface results in a high usefulness and satisfying for all age categories.
21Assessment of Dynamic Tidal Flow Lane on Provincial Roads in the Netherlands
7 Risk Analysis
The RAID (Risk Analysis for ITS Deployment) scenario approach is used as guideline in this risk analysis. The
risk analysis is aimed at identifying risks and creating mitigation actions to avoid or control risks. This only
applies to risks with probability/impact values of high/medium, medium/high or high/high.
7.1 Stakeholders
In the stakeholder assessment plan, the stakeholders’ needs have been discussed. In the risk assessment
it is more relevant to look at what power stakeholders have.
7.1.1 Road operator
In this case the province is the road operator. The province has the authority to arrange (temporary)
traffic measures. The province can also give permits for traffic measures, special vehicles and cargos and
road races when necessary [brabant.regelingenbank.eu, 2002].
7.1.2 Road user
The road user actually has the power to avoid a DRM enabled road and to ignore the markings. Avoiding
the road causes an increase in travel time, which is an unusual and improbable choice. Road users could
ignore the markings because of unclear markings, creating hazardous traffic conditions. Drivers can
participate in questionnaires or simulations so that researchers can investigate the acceptability of DRM.
7.1.3 Manufacturers
Several manufacturers are involved: manufacturers of the DRM hardware (light, cables, etc.) and the DRM
software. Manufacturers’ interests lie in profit and knowledge. Suppliers and contractors play an indirect
part through the manufacturer.
7.1.4 Researchers
Researchers are required to develop knowledge about hardware and software for the implementation of
DRM. Researchers are organized in universities and public bodies like Rijkswaterstaat in the Netherlands.
Because the road operator in the Netherlands is a public body, Rijkswaterstaat plays an important role in
research. Also an institution like TNO is important.
7.1.5 Organized lobbies
Through media and procedures organized lobbies can practise quite some power against road planning.
Road user lobbies like the ANWB in the Netherlands can enlarge or decrease the social basis drastically
through the media. Environmental lobbies are notorious for frustrating procedures through lodging in
objections.
7.1.6 National road operator
The national road operator in the Netherlands is Rijkswaterstaat. Rijkswaterstaat is in charge of
constructing, managing and developing the national infrastructural networks in the Netherlands on the
road and water. This specific DRM application on the provincial roads is not within the authority of
Rijkswaterstaat, although Rijkswaterstaat could offer some support in the form of finances and
knowledge.
7.1.7 Residents alongside provincial roads
Residents do not have the means like organized lobbies have, but because of their big involvement they
can be very persisting in their actions.
22Assessment of Dynamic Tidal Flow Lane on Provincial Roads in the Netherlands
7.2 Deployment scenario
The elements composing a deployment scenario are included in table 8.
Table 16. Deployment scenarios
Geographical scope Interurban
Main trends for ITS ITS strategies focused on the provision of Telematic infrastructures to improve the
development efficiency and safety of the transport network, and on the provision of public
planning transport service
Level of public and The public sector (universities and public bodies) is leading and ruling the ITS de-
private co-operation velopment. Private stakeholders have a big part in developing the light technologies.
Estimated time 2008 – 2010: Research and Development
horizon 2011 – 2020: Low market penetration (Assessment of Dynamic Tidal Flow Lane on Provincial Roads in the Netherlands
7.3.4 Energy costs are too high
Description: During implementation the energy costs for operating the lights are much higher
than expected.
Category: Cost & Benefits
Consequences: Costs probably outrun benefits being a serious threat for continuation of the
project. Researchers would have to go back to the drawing board to look for other
less energy consuming light technologies. Another consequence is the negative
environmental one. Environmental lobbies could be seriously troublesome.
Probability: Medium, in a pilot conducted there were problems with energy use, but energy
consumption is a very predictable factor.
Level of impact: High, unexpected high operation costs are unacceptable.
Risk rating: Orange
7.3.5 Dynamic marking not clear to driver
Description: The dynamic markings are not clear for all drivers. This problem especially occurs
during the transition from two lanes to one lane and vice versa.
Category: Safety
Consequences: The markings have to be clear for all drivers, otherwise it will result is very unsafe
situations.
Probability: Medium, DRM is very new for Dutch drivers, but other traffic measures like rush hour
lanes and tidal flow lanes have showed that drivers can adjust to new traffic measures
quite easily.
Level of impact: High, unclear signs pose a threat to traffic safety.
Risk rating: Orange
7.4 Mitigation actions
Mitigation actions are formulations of strategies addressed to deal with the risks labelled with red or
orange risk rating.
7.4.1 Development runs over-budget
Strategy action: Have a strict budget control system in place.
Action by whom: Ministry of Transport and Public Works (Ministerie van V&W)
Action type: Risk avoidance
Scenario: Development
7.4.2 Lights wear too fast
Strategy action: Thorough tests should be conducted in a controlled environment. The lights can be
supplied with a test certificate only if the tests are completed successfully. The tests
are completed successfully if the pre-defined criteria have been reached.
Action by whom: The tests can be carried out by an objective test institution like the Dutch TNO. The
criteria are set by public bodies (road operator and Rijkswaterstaat) in cooperation
with TNO.
Action type: Risk avoidance
Scenario: Development
7.4.3 Junctions turn in to chaos
Strategy action: The total road section with all its junctions and other discontinuities has to be
designed to a safe integral solution.
Action by whom: Rijkswaterstaat and road operator
Action type: Risk avoidance
Scenario: Development
24Assessment of Dynamic Tidal Flow Lane on Provincial Roads in the Netherlands
7.4.4 Energy costs are too high
Strategy action: During development energy use of available light technologies should be calculated
and be considered in the decision making process. During deployment energy use
(costs) should be monitored closely. If costs are higher than pre-defined level, the road
operator can take action in time. The road operator should consider which action to
take before deployment takes place.
Action by whom: Rijkswaterstaat and road operator
Action type: Risk avoidance and controlling
Scenario: Development and deployment
7.4.5 Dynamic marking not clear to driver
Strategy action: Driver acceptance assessment, especially investigating the transition. Besides this
assessment signs should be put in place along the road to inform drivers about the
new traffic situation.
Action by whom: TNO
Action type: Risk avoidance
Scenario: Development and deployment
7.5 Recommendations
The road operator (province), Rijkswaterstaat and research institutions play a major part in controlling
and avoiding risks. This was also proven to be the case in the mitigation actions for the five most relevant
risks:
• Development runs over-budget
• Lights wear out too fast
• Chaos on junctions
• Energy costs are too high
• Dynamic markings are not clear to driver
All these five risks can probably be controlled and/or avoided if the formulated strategy actions are
adopted in development and deployment.
25You can also read