Dynamical modelling and analysis of COVID-19 in India
←
→
Page content transcription
If your browser does not render page correctly, please read the page content below
RESEARCH ARTICLES

Dynamical modelling and analysis of
COVID-19 in India
R. Gopal1, V. K. Chandrasekar1,* and M. Lakshmanan2
1
  Centre for Nonlinear Science and Engineering, School of Electrical and Electronics Engineering, SASTRA Deemed University,
Thanjavur 613 401, India
2
  Department of Nonlinear Dynamics, School of Physics, Bharathidasan University, Tiruchirappalli 620 014, India

                                                                           Much work indicates that COVID-19 could spread
We consider the pandemic spreading of COVID-19 in
India after the outbreak of the coronavirus in Wuhan                    from animals to humans (zoonotic)7. In addition, a rapid
city, China. We estimate the transmission rate of the                   increase of COVID-19 infections shows that secondary
initial infecting individuals of COVID-19 in India                      transmission can occur through human-to-human contacts
using officially reported data at the early stage of the                or through droplets transmitted by an infected person
epidemic with the help of the susceptible (S), exposed                  through coughing or sneezing4,7 or even when an infected
(E), infected (I), and removed (R) population model,                    person speaks to a non-infected one. With the above
the so-called SEIR dynamical model. Numerical ana-                      trend, this human-to-human spread of the disease is grow-
lysis and model verification are performed to calibrate                 ing significantly almost everywhere in the world and the
the system parameters with official public information                  infection is rapidly increasing in many countries through
about the number of people infected, and then to eva-                   local transmission4.
luate several COVID-19 scenarios potentially applica-
                                                                           In India, infection due to COVID-19 was first identified
ble to India. Our findings provide an estimation of the
number of infected individuals in the pandemic period                   on 2 March 2020. On 24 March 2020, the Government of
of timeline, and also demonstrate the importance of                     India announced a 21-day country-wide lockdown as a
governmental and individual efforts to control the                      preventive measure for the COVID-19 outbreak. The aim
effects and time of the pandemic-related critical situa-                of the lockdown was to slow down the spread of the
tions. We also give special emphasis to individual                      novel coronavirus, allow the Government to follow a
reactions in the containment process.                                   multi-pronged strategy to add more beds in its hospitals
                                                                        network, increase the production of the COVID-19 test
Keywords: Containment process, COVID-19 pandemic,                       kits and personal protective equipment (PPEs) for health
dynamical modelling, numerical analysis.                                workers, etc. The government frequently used various
                                                                        platforms to keep the public aware of COVID-19. In
COVID-19, a disease caused by the severe acute respiratory              India, conditions like very high population density in
syndrome coronavirus 2 (SARS-COV 2), was first identi-                  urban areas, unavailability of vaccines and inadequate
fied in December 2019 in Wuhan, the capital of Hubei,                   data about disease transmission also make it a difficult
China, and has since spread globally1. The World Health                 task to adequately fight the disease.
Organization (WHO) announced COVID-19 as an inter-                         Mathematical simulations have often been used to
national public health emergency on 30 January 2020,                    forecast the effects of various epidemics and also to test
and subsequently a pandemic on 11 March 2020 (ref. 2).                  the efficacy of different prevention approaches in reduc-
The number of patients is growing exponentially and                     ing disease burden8. Recently, with regard to the COVID-
thousands of people are losing their lives in many a coun-              19 pandemic, considerable research has been carried out
tries, almost every day due to COVID-19 (refs 3–5). The                 using actual occurrence from the impacted countries, ana-
complexity of the situation can be realized from the fact               lysing various aspects of the epidemic, as well as assess-
that as on 15 May 2020 the number of coronavirus cases                  ing the impact of preventive approaches adopted in order
worldwide has reached a staggering 4,639,427, with the                  to limit the epidemic in the countries concerned9. In
number infected people being 2,564,442 and about                        particular, various kinds of dynamical models have been
308,810 confirmed deaths have been reported due to this                 employed, essentially considering nonlinear governing
disease6. Moreover, the outbreak has also spread to more                equations. For instance, the nature of human coronavirus
than 200 countries6. (Note added in revision: As on 20                  infection and defining contact between human cells and
November 2020, the number of coronavirus cases had                      the virus have been described in Rihan et al.10. A statis-
reached as 46,403,652 with infected individuals being                   tical model for estimating virus transmission, taking into
12,079,415 and 1,211,421 confirmed death cases.)                        account a condensed version of the bats–hosts–reservoir–
                                                                        people transmission model, known as the reservoir–
*For correspondence. (e-mail: chandru25nld@gmail.com)                   people model was reported by Chen et al.11.
1342                                                                                  CURRENT SCIENCE, VOL. 120, NO. 8, 25 APRIL 2021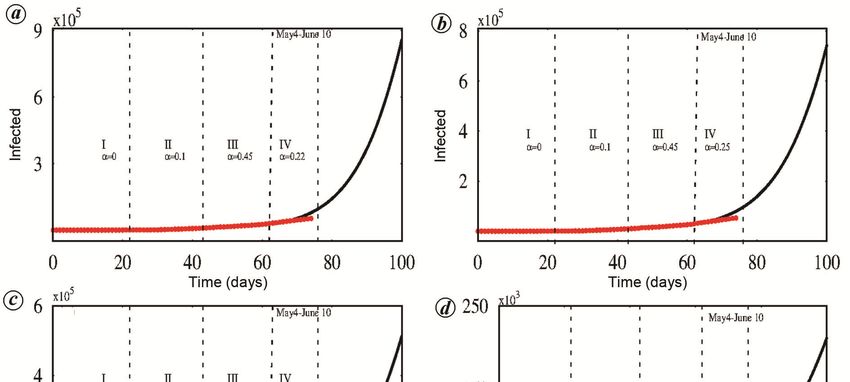
RESEARCH ARTICLES

   The susceptible–exposed–infectious–recovered (SEIR)                         SI
                                                                    E = β (t ) − σ E ,                                   (2)
model is an important tool for tackling coronavirus                            N
transmission statistical simulations. Lin et al.3 have pro-
posed a method to develop analytical models for the                 I = σ E − γ I ,                                      (3)
COVID-19 outbreak in Wuhan, taking into account
human behavioural responses and government decisions,
such as holiday extension, travel restriction, hospitaliza-         R = γ R I ,                                          (4)
tion and quarantine3. Some recent studies use numerical
simulations and provide a reliable real-time forecast of            D = dγ I − λ D,                                      (5)
COVID-19 cases in various countries with the help
of this mathematical model. For instance, Savi et al.12            C = σ E ,                                             (6)
have obtained the general transmission of the novel coro-
navirus to test various scenarios of propagation in differ-      where γ is the mean infectious period, γR the delayed
ent countries, taking into account model testing of the          removed period, which denotes the relation between the
evolution of infected populations in China, Italy, Iran and      removed and infected populations, σ the mean latent
Brazil based on government and individual reactions.             period, d denotes the proportion of severe cases and λ is
   In this study, we consider the situation in India starting    the mean duration of public reaction3,4,12.
from the initial outbreak period and fit the SEIR model to          In eqs (1)–(6), β (t) denotes the transmission rate func-
daily infected cases reported between 2 March and 15             tion which incorporates the impact of governmental
May 2020. We estimate the basic transmission rate of             action (1 – α) and individual actions which is denoted by
COVID-19 in the initial stage of the epidemic between 2          the function (1 – D/N)k (refs 3, 12). Here, the parameter k
and 24 March 2020. Further, the general propagation of           defines the intensity of individual reactions, which is
the novel coronavirus is also studied to evaluate different      measured on a scale of 0 to 105 with a normal value of
scenarios of the various propagation. In addition, the model     1117.3 obtained from previous and recent epidemic and
verification takes into consideration the evolution of the in-   pandemic studies3,13. We also assume that the effect of
fected population and simulates different scenarios based        governmental action is different during various lockdown
on the rate of transmission and the governmental and, espe-      periods. Therefore, the transmission rate β (t) is defined
cially, individual reactions. Finally, it proposes potential     as
evolution of the spread and possible mitigations, specifi-
cally emphasizing the significance of individual reactions                                         k
                                                                                        ⎛        D⎞
at the societal level during the pandemic period, which             β (t ) = β 0 (1 − α ) ⎜1 −    ⎟ .                     (7)
includes both lockdown and various unlock periods.                                      ⎝        N⎠
   Appendix 1 provides details of this study on the
number of infected individuals during the lockdown and           The value of β0 is derived by assuming that the basic
unlock periods starting from 25 March to 31 October              reproduction number is R0 = β0/γ, which measures the
2020 and further up to 27 December 2020.                         average number of new infections generated by each
                                                                 infected person. The values of the system parameters are
                                                                 mentioned in Table 1, based on the information deduced
Dynamical model
                                                                 from the literatures3,4,12,13,15.
Lin et al.3 have proposed SEIR model to explain the                 The above parameters must be modified for each
coronavirus disease3. This was inspired by the original          state/country, which is important for COVID-19 analysis.
influenza model of He et al.13,14. The SEIR model also           In general, the physical meanings of the parameters are
has two supplementary terms: D is a public perception of         based on a variety of facts, identifying which is a difficult
risk with respect to serious cases and deaths and C is the       task3. It should be also pointed out in this regard that the
number of recorded and unreported incidents. In addition,        real data have spatial aspects that are not covered by the
S is the susceptible population, E the population exposed,       above set of governing equations. Consequently, this kind
I the currently infectious population (excluding the             of study is a sort of average activity that needs careful
recovered and death cases) and R is the population               adjustment to suit real data as followed by earlier
removed which includes both cases recovered and deaths.          studies3,12.
The simplified version of the governing equations takes             In the present study, we use step-like functions to
account of the interaction between all these populations,        define certain parameters that allow for a proper repre-
and is represented by the following set of coupled non-          sentation of different scenarios, especially the rate of
linear differential equations3:                                  transmission. It is also important to remember that all
                                                                 governmental or individual decisions have a delayed
                SI                                               impact on the dynamics of the system. Further, virus
   S = − β (t ) ,                                        (1)
                N                                                mutation is an important factor related to the definition of

CURRENT SCIENCE, VOL. 120, NO. 8, 25 APRIL 2021                                                                          1343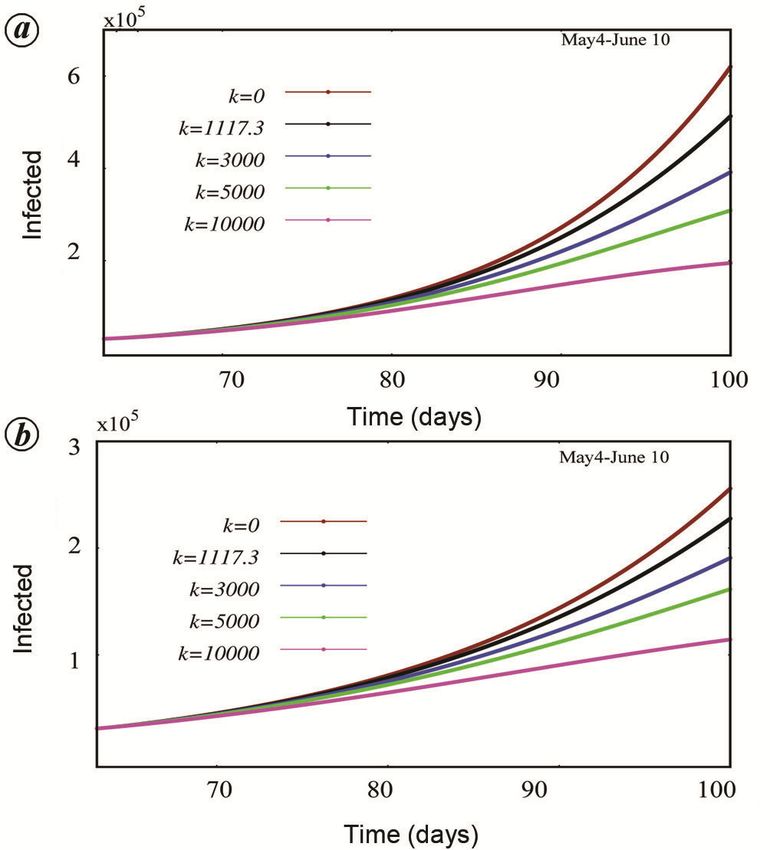
RESEARCH ARTICLES

                                  Table 1.   Summary table of the parameters discussed in eqs (1)–(7)
                     Parameter                   Description                            Value/remarks/reference
                     N0          Initial number of population                   India populations16
                     S0          Initial number of susceptible population       0.9N0 (constant)
                     E0          Exposed persons for each infected person       20I0 (assumed)
                     I0          Initial state of infected persons              3 (ref. 15)
                     α           Governmental action strength                   Varied during each lockdown period
                     k           Intensity of individual reactions              1117.3 (refs 3, 12)
                     σ–1         Mean latent period                             3 (days)
                     γ–1         Mean infectious period                         5 (days)
                     d           Proportion of severe cases                     0.2
                     λ–1         Mean duration of public reaction               11.2 (days)

COVID-19 dynamics which can affect the reaction of the               the recorded data we can match real infected individuals
system significantly; however, this is not discussed in the          (excluding quarantined people) as a function of time at
present study12. Next, let us treat the COVID-19 dynam-              the early stage of disease spreading barring the initial
ics considering two different objectives. To start with, we          quarantined people18.
identify the initial value of transmission rate with data               In order to solve the model (1), we considered the sus-
from initially infected people, and then examine various             ceptible population to be close to the overall population
scenarios for the COVID-19 situation in India using dif-             in the early stages of transmission of the disease20. Then
ferent transmission rates and governmental and individual            we can rewrite the dynamic equation of the epidemic with
action strengths.                                                    S/N ≈ 1.
                                                                        In this case, from eqs (2) and (3), the equation for the
                                                                     presently infectious population (which excludes the
Data analysis with numerical model
                                                                     recovered and death cases) becomes the second-order
                                                                     linear ordinary differential equation of damped linear
As a first phase of the established study, model verifica-
                                                                     type
tion was performed using information available from
India’s COVID-19 tracker and worldometers.info6. We
followed the SEIR implementation methodology des-                           I + (γ + σ ) I − σ ( β − γ ) I = 0.                                                  (8)
cribed for various countries by Savi et al.12. The model
employed for simulations has the total population of India           By integrating the above equation, we obtain the solution
at N ≈ 139 × 107 (ref. 16), and three infected COVID-19              as19
cases confirmed as on 2 March 2020. The initial state is
taken to be with I0 = 3 and a susceptible initial population                                 − 12 (γ +σ − (γ −σ )2 + 4σβ )t              − 12 (γ +σ + (γ −σ )2 + 4σβ )t
is assumed to be S0 = 0.9N. Another information needed                      I (t ) = I 01e                                    + I 02 e                                    ,
for the model is the number of individuals exposed to                                                                                                               (9)
each infected person. Each infected individual is believed
to have the potential to infect a further 20 individuals,            where I(0) = I01 + I02 is the initial number of infected
E0 = 20I0 (refs 3, 12). Initially, we started with the esti-         people. Now the curve is fitted with the initial real infec-
mation of the initial transmission rate.                             tious population data available in ref. 6. Further we iden-
                                                                     tify an exact fit with the curve 3e0.473t. From this we
                                                                     obtain the parameter values as I01 = 3, I02 = 0 and the ini-
Estimation of initial transmission rate                              tial value of β = 0.56. This β value can be considered as
                                                                     the initial transmission rate β0 in eq. (7). It gives the
To start with, we noted that intensified precautionary               reproduction number R0 = β0/γ = 2.8. One may note that a
measures to curb the spread of COVID-19 has been                     few recent studies suggest a reproduction rate of R0 about
carried out in India. In particular, when patients were              2.52 for the first 22 days before lockdown, and then
found at a location, the Committee of Physicians and                 identify the value of R0 to vary between 1.9 and 3.0 in
Experts checked those people who had contact with these              various places in India, due to variation of transmission
patients. Then, both the patients and the contaminated               rates15,18,20. However, in our analysis, the estimation of R0
people were quarantined in a hospital or other isolated              from the model is confirmed with real data of daily
areas. In the data published in India, in the initial few            infected individuals (excluding recovered and death
days, the active cases were automatically moved to                   cases). Figure 1 represents the curve fit of infected people
quarantined cases17. Therefore, the active cases correlate           as a function of time at the early stage of disease spread
after a few days with the omitted quarantined cases. From            in India.

1344                                                                                   CURRENT SCIENCE, VOL. 120, NO. 8, 25 APRIL 2021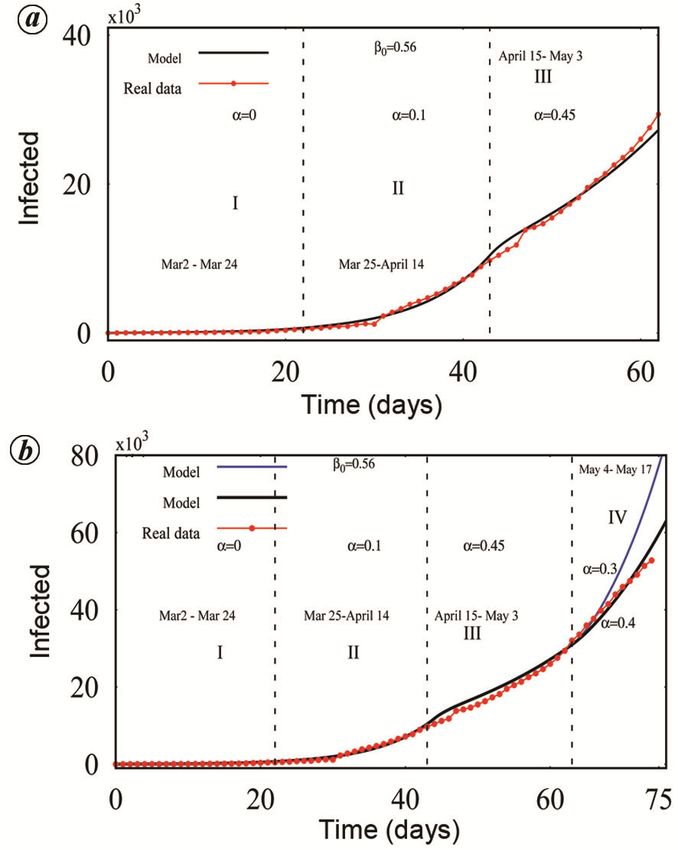
RESEARCH ARTICLES
Verification through simulations recovered and death cases), indicating a strong agreement
between simulation and actual data. The infected people
The first scenario for model verification based on the re- regions are marked as I, II, III and IV and they corres-
sults of India is presented here. It should be noted that pond to the periods of 2–24 March (before lockdown), 25
our analysis considers all infected cases in the entire March–14 April (first lockdown), 15 April–3 May
country, and it is not restricted to any specific state or (second lockdown) and 4–17 May (third lockdown)
place. Table 1 provides the parameters which are used in respectively.
the model. These should be treated as average values It is apparent that our estimation of the number of
since they are appropriate for the country as a whole. infected individuals in model eqs (1)–(7), with basic
Initially, we started with the value of transmission rate transmission rate, system parameters and different govern-
β0 = 0.56. The value attributable to governmental action mental action strengths up to the end of the second lock-
strength was also considered as different during the down period starting from the initial outbreak (2 March–3
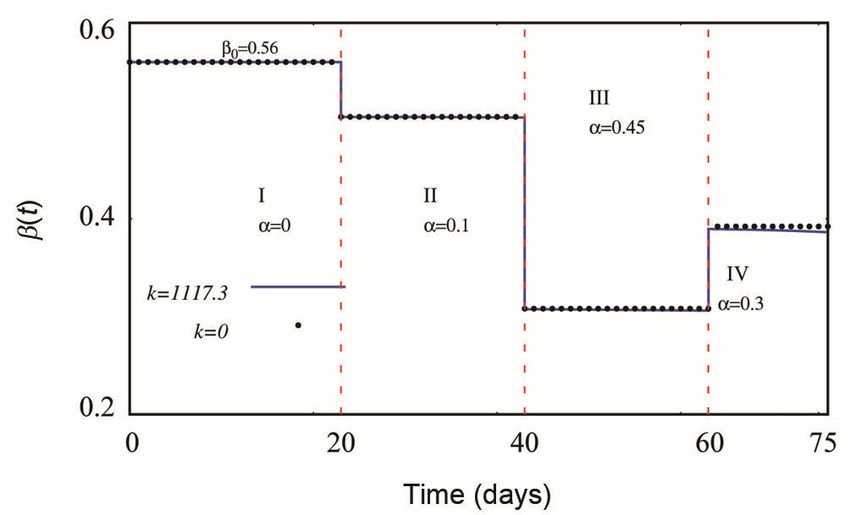
periods before and after lockdown. Figure 2 shows the May) shows good agreement with the actual data of in-
transmission rate β (t), before and after lockdown period fected individuals (Figure 3 a). This study helps predict
with respect to various governmental action strengths. newly infected individuals in the near future. For instance,
One may note that an important constraint on the parame- we have chosen low values of governmental action
ter β (t) is that this variable should be a step-like function strengths, α = 0.3 and 0.4, in the third lockdown period
with time due to the impact of governmental action (due to minimum relaxation given by the government,
strength. Therefore, using the daily COVID-19 incidence when certain activities were permitted/restricted in each
data, numerical simulation was carried out for the model zone) compared to α = 0.45 during the second lockdown
(7) with the value of β0 = 0.56. Figure 3 shows the evolu- period. Our study predicts the number of infected indi-
tion of the number of infected individuals (excluding both viduals reasonably well with the real data for α = 0.4 in the
region IV (black curve in Figure 3 b). Note that in Figure
3, we have also included the strength of individual reac-
tions at a rather low value of k = 1117.3 (see eq. (7)), but
Figure 1. The number of infected individuals (excluding the number
of initial quarantined people) after the first few days of outbreak on 2
March 2020. Data were fitted by the nonlinear least-square fit for India.
The solid black line is for fitting data and red circles denote real data of
the number of infected individuals.
Figure 3. Numerical simulation of the number of infected individuals
(excluding both recovered and dead) with initial transmission rate taken
as β0 = 0.56 and for different governmental action strengths before and
after the lockdown period. The prediction of the mathematical model
(continuous blue and black curves) compared with actual data (red dot-
Figure 2. Variation of transmission rate considered in our model eqs ted curve) for daily infections in India up to (a) 3 May 2020 and (b) 17
(1)–(6) as a function of time with the impact of α in eq. (7) with respect May 2020 is depicted. The strength of individual reactions is consi-
to initial transmission value 0.56. The continuous line is for intensity of dered as k = 1117.3 and the remaining parameters are taken from
individual reactions k = 1117.3 and the dotted line is for k = 0. Table 1.
CURRENT SCIENCE, VOL. 120, NO. 8, 25 APRIL 2021 1345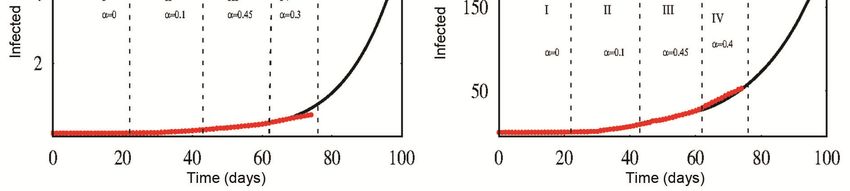
RESEARCH ARTICLES

                               Table 2.    Sample summary of actual data of COVID-19 pandemic in India and
                                          predicted infected people from the SEIR model given by eqs (1)–(7)
                                                  Number of infected people6,21
                               Date                    (Worldometer)                        SEIR model (I(t))
                               04/03/2020                         26                                29
                               10/03/2020                         58                                84
                               24/03/2020                        486                              679
                               2/04/2020                       2280                              2249
                               11/04/2020                      7189                              7103
                               14/04/2020                      9735                             10,417
                               15/04/2020                     10,440                            11,564
                               19/04/2020                     14,202                            14,660
                               23/04/2020                     17,306                            17,575
                               24/04/2020                     18,171                            18,370
                               25/04/2020                     19,519                            19,198
                               03/05/2020                     29,339                            27,261
                               10/05/2020                     43,980                            43,910
                               13/05/2020                     49,104               55,958 (α = 0.3); 46,368 (α = 0.4)
                               14/05/2020                     51,379               60,668 (α = 0.3); 49,073 (α = 0.4)
                               15/05/2020                     52,773               65,767 (α = 0.3); 51,904 (α = 0.4)

       Figure 4. Numerical simulation of the evolution of the number of infected individuals with the initial transmission rate β0 = 0.56.
       The red curve denotes actual data for daily infections (excluding recovered and death cases) in India up to 15 May 2020. Note that
       this simulation (IV) shows the rate of newly infected population after 3 May with respect to the values of governmental action
       strength in eq. (7) with (a) α = 0.22, (b) α = 0.25, (c) α = 0.3 and (d) α = 0.4. The strength of individual reactions considered is a ra-
       ther low value of k = 1117.3 and the remaining parameters are taken from Table 1.

the contribution due to this term is only minimal. Table 2                    2020. For instance 4 May 2020–10 June 2020, and
provides a sample summary of the actual infected people                       beyond (region IV, Figure 4 a–d). Strategies for preven-
in India6, and prediction of infected individuals from                        tion include mechanisms such as lockdown, information
model eqs (1)–(6).                                                            campaign by newspapers and television, adequate hand
                                                                              sanitation, social distancing, etc. which result in slowing
Role of governmental action and individual                                    down the COVID-19 transmission process. These strate-
reactions                                                                     gies of prevention as modelled in terms of the parameters
                                                                              α and k in eq. (7), imply that there will be a reduction in
We also analyse the possibility of impact of prevention                       the transmission rate β (t). Now, we start with the effi-
approaches in reducing new cases infected with COVID-                         ciency of prevention by varying governmental action
19 using the above mathematical model, after 3 May                            strength alone, keeping k at a fixed low strength

1346                                                                                        CURRENT SCIENCE, VOL. 120, NO. 8, 25 APRIL 2021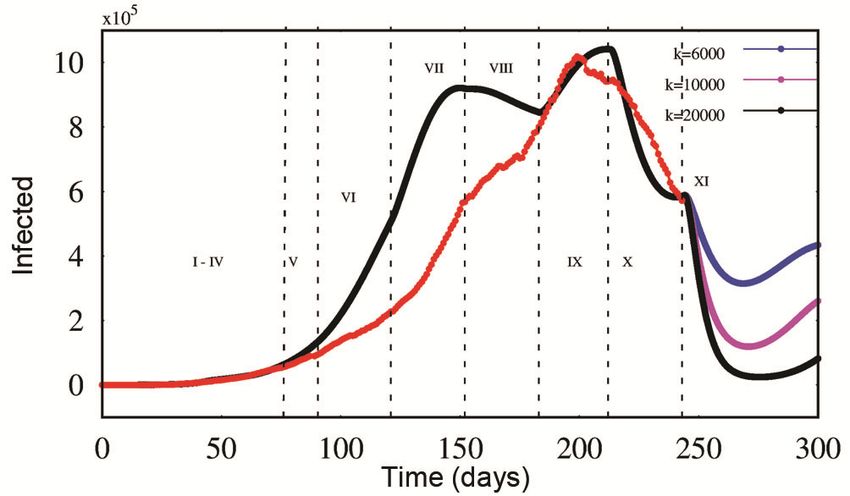
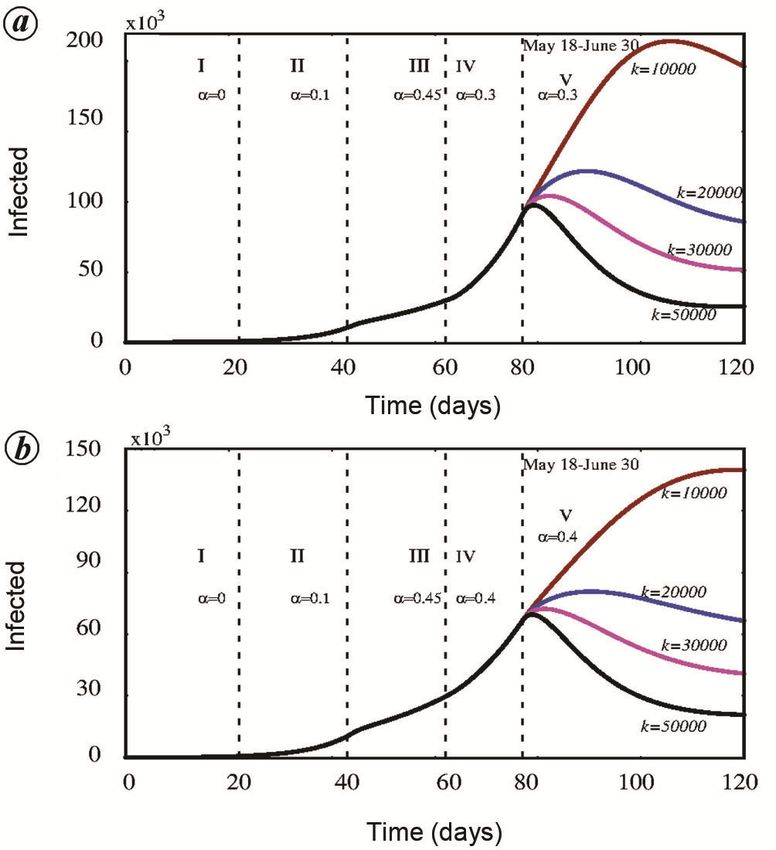
RESEARCH ARTICLES

(k = 1117.3)3. For α = 0.22 and α = 0.25, it is observed                    of intensity of individual reactions (k = 1117.3) in eq. (7).
that the number of infected individuals will peak around                    Individual reactions or behaviour can include social dis-
8 × 10⁵ and 7 × 10⁵ respectively by 10 June (Figure 4 a                     tancing, personal hygiene, healthy habits, avoiding
and b). If the strength is increased (α = 0.30), the peak of                crowded places, etc.2. It will also include alerting fellow
infected/active people cases may decrease and occurrence                    citizens to wear masks, follow personal hygiene and
of the peak is shifted down to 5 × 10⁵ on 10 June (Figure                   social distancing, political and social organizations
4 c). Now, we consider a further increased value of                         urging fellow citizens to follow social norms, and so on.
governmental action strength (α = 0.4), and the newly                       Now, we also address the importance of individual reac-
infected cases can decrease and reach around 2.5 × 10⁵ by                   tions with low value of governmental action strength
10 June (Figure 4 d).                                                       α = 0.3 and α = 0.4 (region V of Figure 5, which corres-
   Analysing the results, the present dynamical model                       ponds to the period beyond 18 May 2020). We observe
clearly shows that when the value of α is reduced, new                      from Figure 5 that the number of infected people increas-
infected cases continue to quickly increase, while a larger                 es for no action of individual response (for k = 0), while
value of α decreases the infected cases to a considerable                   the number of infected people decreases when the value
extent. However, the latter will not help in reducing the                   of individual response increases to k = 3000, 5000 and
infection to approach zero, unless perhaps α approaches a                   10,000. We also learn that individual behavioural res-
value close to unity. Moreover, it is not practical to keep                 ponses are important along with governmental action.
increasing the governmental action to a higher and higher                      In the above scenario, we further considered different
level even in the fourth lockdown period and further due                    low values of governmental action strength α in region
to the necessity of opening up the economic front for                       IV of Figure 4 a–d (3 May–10 June 2020) and various
survival of the nation. On the other hand, with relaxation                  values of intensity of individual reactions in the same
of governmental action over time, particularly in the                       region in Figure 5 a and b. The corresponding figures
fourth lockdown period and subsequent periods, the                          show that the disease continues to infect more and more
above prevention method alone will help in the eradica-                     people due to low value of governmental action strength,
tion of the disease.                                                        but it can be controlled with respect to appropriate indi-
   In Figure 4, we have shown simulations based on vari-                    vidual reactions. In order to break the chain of infection
ous governmental action strengths with fixed low value                      spread and to get more control on infected individuals,

Figure 5. Numerical simulation of the evolution of the number of            Figure 6. Numerical simulation of the evolution of the number of
infected individuals with the specific value of initial transmission rate   infected individuals for the initial transmission rate β0 = 0.56 and
β0 = 0.56, after 3 May (expanded view of IV in Figure 4 c and d) with       k = 1117.3 (I–IV). Note that this simulation shows the rate of infected
respect to different values of intensity of individual responses k in eq.   people after 17 May (V) with respect to different values of individual
(7) for different values of governmental action strength with (a) α = 0.3   reactions in eq. (7) with (a) α = 0.3 and (b) α = 0.4. The remaining
and (b) α = 0.4. The remaining parameters are taken from Table 1.           parameters are taken from Table 1.

CURRENT SCIENCE, VOL. 120, NO. 8, 25 APRIL 2021                                                                                               1347
RESEARCH ARTICLES

one may choose immediate action of the individual reac-       there can be dramatic reduction in the total number of in-
tion response after the third lockdown period, that is,       fected people. Depending upon the increased individual
range IV, and consider appropriate values of α and k in       contribution, the disease can be effectively controlled in a
the time window V in Figure 6. For α = 0.3 or 0.4 and         rather short period. It is then imperative that the society
k = 10,000 or 20,000 the newly infected cases tend to         as a whole contributes its might by simple social meas-
decrease within a few weeks, after 18 May (Figure 6 a         ures, besides appropriate governmental action. These
and b). If the individual reaction is increased further       combined efforts can help in total control of the disease
(k = 30,000 and 50,000), we see that the disease can be       in a short period in India and perhaps elsewhere as well.
effectively eradicated within 1–2 months from 18 May
2020 (Figure 6 a and b).                                      Appendix 1. Study of infected individuals during the
   Based on our analysis in Figures 4–6, we find that if      lockdown and unlock periods.
we introduce appropriate values of individual reaction
strength k, then even for low values of governmental          In order to get a clear insight on the estimation of our
action, the reduction can become substantially impressive     prediction, Figure A1 shows the rate of infected individu-
and one can approach a regime of complete control of the      als with respect to the timeline of various lockdown and
disease in a reasonably short period in the absence of        unlock periods. It shows that various intervention strate-
appropriate vaccination.                                      gies (lockdown, spreading awareness programme, public
                                                              reaction, proper hand sanitization, etc.), including meas-
                                                              ures like governmental action strength α and intensity of
Conclusion
                                                              individual reactions k play an important role in control-
                                                              ling the number of infected individuals in India.
On 3 May 2020, the total number of active infected cases
                                                                 Starting from the initial date of outbreak, we consider a
registered for COVID-19 and deceased cases in India was
                                                              period of 300 days as the timeline and study the impact of
29,339 and 1391, on 15 May it was 52,773 and 2753 and
                                                              various interventions during this period. In terms of the
on 4 November 2020 it was at 533,787 and 123,611
                                                              actual dates, we consider the time period between 2
respectively17. This rise in the active infected cases has
                                                              March and 27 December 2020.
occurred after some minimal relaxation in the govern-
                                                                 Our study shows that with comparatively low values of
ment lockdown, and several hundred new cases are being
                                                              the parameters α and k, the time of occurrence of the
reported each day from different locations across India.
                                                              peak of the outbreak occurred during the unlock period
Our study analysed the effect of lockdown days on the
                                                              4.0 (region IX in Figure A1). If the strength of the inten-
spread of COVID-19 disease in the country. Therefore,
                                                              sity of individual reactions increases further from
predictive mathematical/dynamical models can also
                                                              k = 2500 in region IX to 3500 in region X and then to
provide useful insights to strengthen our understanding of
                                                              6000 and 10,000 or even 20,000 in the region XI in the
COVID-19 transmission and control.
                                                              figure, the number of infected individuals decreases
   In this study, we considered the dynamical SEIR mod-
                                                              rather quickly and can reach a minimum at the end of
el, and estimated the initial rate of COVID-19 transmis-
sion by considering the initially infected people in India.
In addition, a verification procedure was performed with
respect to different transmission rates based on the data
available from India. Our findings also indicate that the
government and in particular individual efforts are impor-
tant in reducing infected populations and also the overall
time-period of the epidemic. In addition, such epidemic
mathematical models and their predictive simulations are
valuable resources which can be helpful for public health
planning and in governmental as well as individual acts.
Further, this study also shows that the COVID-19 pan-
demic can be suppressed by a lockdown.
   Our model and current data seem to indicate that the
confirmed infected individuals continue to grow in India      Figure A1. Numerical simulation of infected people with initial
every day, in spite of rapid response by the government       transmission β0 = 0.56. The red curve denotes actual data from refs 6,
                                                              19 for daily infections in India up to 31 October 2020. Note that the
to the pandemic through various quarantine measures,          simulation (I–XI) shows the rate of infected people in the timeline from
nationwide lockdown and risk-based zoning when the            2 March 2020 to 27 December 2020 with respect to various values of α
individual reaction rate (k) is chosen to be low. However,    and individual reactions k as given in Table A1. If the strength of the
                                                              individual reactions k is increased further (after 31 October 2020), the
we find that for appropriate increased values of individual   number of infected individuals may decrease and come to an end in a
reactions, even with low governmental action strength,        short period of time (black curve in XI).

1348                                                                       CURRENT SCIENCE, VOL. 120, NO. 8, 25 APRIL 2021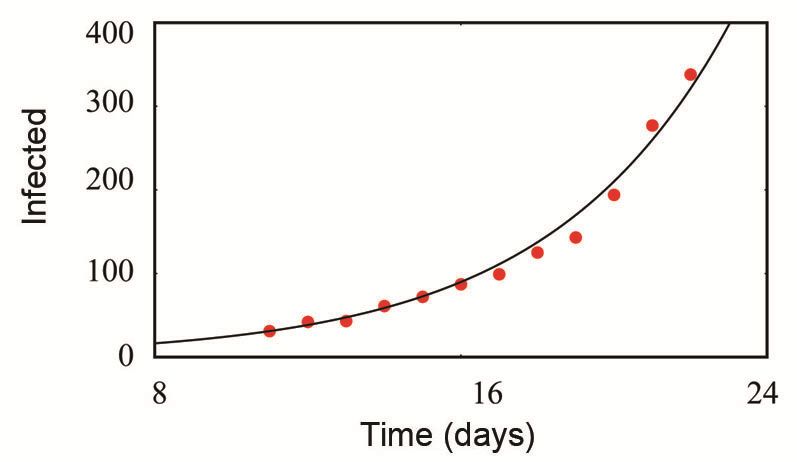
RESEARCH ARTICLES

                                 Table A1. Values of government action strength α and intensity of individual
                                 reactions k used during no lockdown (No LD), lockdown (LD) and unlock (UL)
                                                                periods in eq. (7)
                                 Phase        Timeline (2020)      Figure    Region       α Value      k Value
                                 No LD       2 March–24 March        3b             I        0.0        1117.3
                                 LD-1        25 March–14 April       3b            II        0.1        1117.3
                                 LD-2        15 April–3 May          3b           III       0.45        1117.3
                                 LD-3        4–17 May                3b           IV        0.40        1117.3
                                 LD-4        18–31 May               A1            V        0.40         2000
                                 UL-1        1–30 June               A1           VI        0.38         2100
                                 UL-2        1–31 July               A1           VII       0.30         2200
                                 UL-3        1–31 August             A1           VIII      0.25         2300
                                 UL-4        1–30 September          A1           IX        0.11         2500
                                 UL-5        1–31 October            A1            X        0.10         3500
                                 UL-6        1 November–             A1           XI        0.10     6000 (blue)
                                                                     A1           XI        0.10    10,000 (pink)
                                                                     A1           XI        0.10    20,000 (black)

December 2020. (The increased value of individual reac-                            missibility of a novel coronavirus. Infect. Dis. Poverty, 2020, 9,
tions k may be attributed to increased awareness among                             24; doi:10.1186/s40249-020-00640-3.
                                                                            12.    Savi, P. V., Savi, M. A. and Borges, B., A mathematical descrip-
people and more number of individuals following basic                              tion of the dynamics of coronavirus disease (2019): (COVID-19):
hygiene, etc.) Our results seem to agree well with the re-                         a case study of Brazil, 2020; arXiv:2004.03495v2.
cent COVID-19 data on India2,17. Our study also shows                       13.    He, D., Dushoff, J., Day, T., Ma, J. and Earn, D. J. D., Inferring
that when the value of k is decreased further in the forth-                        the causes of the three waves of the 1918 influenza pandemic in
coming period in the XI window region in Figure A1, the                            England and Wales. Proc. R. Soc. London Ser. B, 2013, 280,
                                                                                   20131345; doi:10.1098/rspb.2013.1345.
new cases tend to increase. This shows the possibility of                   14.    He, D., Ionides E. L. and King, A. A., Plug-and-play inference for
rapid increased occurrence of infected individuals (blue                           disease dynamics: measles in large and small populations as a case
and pink curves in region XI, Figure A1).                                          study. J. R. Soc. Interface, 2010, 7, 271–283; doi:10.1098/rsif.
                                                                                   2009.0151.
                                                                            15.    Das, S., Prediction of COVID-19 disease progression in India.
 1. Cohen, J. and Normile, D., New SARS like virus in China triggers               2020; arXiv:2004.031471v1.
    alarm, Science, 2020, 367, 6475.                                        16.    https://www.statisticstimes.com/demographics/population-of-india.
 2. WHO, 2020; https://www.who.int/emergencies/diseases/novel-                     php (accessed on 16 May 2020).
    coronavirus-2019/technical-guid (accessed on 16 May and 5 No-           17.    https://www.mygov.in/covid-19 (accessed on 16 May and 5 No-
    vember 2020).                                                                  vember 2020).
 3. Lin, Q. et al., A conceptual model for the coronavirus disease          18.    Chae, S. Y. et al., Estimation of infection rate and prediction of
    2019 (COVID-19) outbreak in Wuhan, China with individual reac-                 initial infected individuals of COVID-19. 2020; arxiv.org/
    tion and governmental action. Int. J. Infect. Dis., 2020, 93, 211–             pdf/2004.12665.
    216.                                                                    19.    Lakshmanan, M. and Rajasekar, S., Nonlinear dynamics: Integra-
 4. Li, Q. et al., Early transmission dynamics in Wuhan, China, of                 bility Chaos and Patterns, Springer-Verlag, Berlin, Germany,
    novel coronavirus-infected pneumonia. New Engl. J. Med., 2020,                 2003.
    382, 1199; doi:10.1056/NEJMoa2001316.                                   20.    Liu, Y., Gayle, A. A., Smith, A. W. and Rocklow, J., The repro-
 5. Ferguson, N. M. et al., Impact of non-pharmaceutical interven-                 ductive number of COVID-19 is higher compared to SARS
    tions (npis) to reduce COVID-19 mortality and healthcare                       coronovirus. J. Travel Med., 2020, 27(2), 1–4; doi:10.1093/
    demand. Imperial College COVID-19 Response Team, London,                       jtm/taaa021.
    UK, 2020; doi:10.25561/77482.                                           21.    MoHFW, Corona virus disease 2019 (COVID-19). Ministry of
 6. https://www.worldometers.info/coronavirus/country; https://www.                Health and Family Welfare, Government of India, 2020;
    covid19india.org (accessed on 16 May and 5 November 2020).                     https://www.mohfw.gov.in
 7. Rothan, H. and Byrareddy, S., The epidemiology and pathogenesis
    of coronavirus disease (COVID-19) outbreak. J. Autoimmun.,
    2020, 109, 102433; doi:10.1016/j.jaut.2020.102433.                      ACKNOWLEDGEMENTS. V.K.C. acknowledges a research project
 8. Kermack, W. O. and McKendrick, A. G., Contributions to the              sponsored by SERB-DST-MATRICS Grant No. MTR/2018/000676.
    mathematical theory of epidemics. Bull. Math. Biol., 1991, 53, 33.      M.L. thanks the Department of Science and Technology, New Delhi for
 9. arXiv.org, https://arxiv.org; bioRxiv.org, https://www.biorxiv.org.     the award of SERB Distinguished Fellowship under Grant No. SB/DF/
10. Rihan, F. A., Al-Salti, N. S. and Anwar, M. N. Y., Dynamics of          04/2017.
    coronavirus infection in human, AIP Conf. Proc., 2018, 1982,
    020009; doi:10.1063/1.5045415.                                          Received 19 May 2020; revised accepted 7 December 2020
11. Chen, T. M., Rui, J., Wang, W. P., Zhao, Z. Y., Cui, J. A. and Yin,
    L., A mathematical model for simulating the phase-based trans-          doi: 10.18520/cs/v120/i8/1342-1349

CURRENT SCIENCE, VOL. 120, NO. 8, 25 APRIL 2021                                                                                                 1349
You can also read