Dynamics of periodically driven matter waves with negative effective mass
←
→
Page content transcription
If your browser does not render page correctly, please read the page content below
Dynamics of periodically driven matter waves with negative effective mass
Matthew Mitchell,1 Andrea Di Carli,1 German Sinuco Leon,2 Arthur La Rooij,1 Stefan Kuhr,1 and Elmar Haller1
1 Department of Physics and SUPA, University of Strathclyde, Glasgow G4 0NG, United Kingdom
2 Department of Chemistry, Durham University, Durham DH1 3LE, United Kingdom
(Dated: June 3, 2021)
We experimentally study the dynamics of a weakly interacting Bose-Einstein condensate of cesium atoms in
a 1D optical lattice with a periodic driving force. The time evolution is analysed after a quench of the driving
strength which leads to an inversion of the dispersion relation in the lattice band and to a redistribution of atoms
in the 1st Brillouin zone (BZ). We use the concept of a negative effective mass and the resulting changes to
arXiv:2106.00825v1 [cond-mat.quant-gas] 1 Jun 2021
the effective trapping potential and interaction strength to explain the time evolution of wave packets with weak
repulsive interaction. In addition, the formation of stable wave packets with a negative effective mass is observed
at the center of the BZ, and we interpret these as gap solitons in a periodically driven system.
Ultracold quantum gases in optical lattices have proven to
be excellent tools for the experimental study of novel quan-
tum systems [1, 2]. In particular, optical lattices with periodic
driving forces provide detailed control of tunneling between
lattice sites and band structures with new, intriguing features
[3]. Examples are the demonstration of a dynamically driven
quantum phase transition between a bosonic Mott insulator
and a superfluid [4], kinetic frustration on a triangular lat-
tice [5], artificial magnetic fields [6–9], and topological band
structures [10–12]. The systems are commonly described by
the Floquet formalism, which maps the periodic driving to a
time-independent Hamiltonian [3, 13].
Essential for many experiments is the control of the disper-
sion relation between quasimomentum and energy in the ener-
getically lowest lattice band [14, 15]. In particular, increasing
the amplitude of the driving force can invert the dispersion
curve, turning the energetically highest states at the edge of
the 1st Brillouin zone (BZ) into the energetically lowest states
[16–18]. The resulting evolution of atoms from the center of
the BZ towards its edge is usually interpreted as a result of
energy minimization within the dispersion curve [19]. This
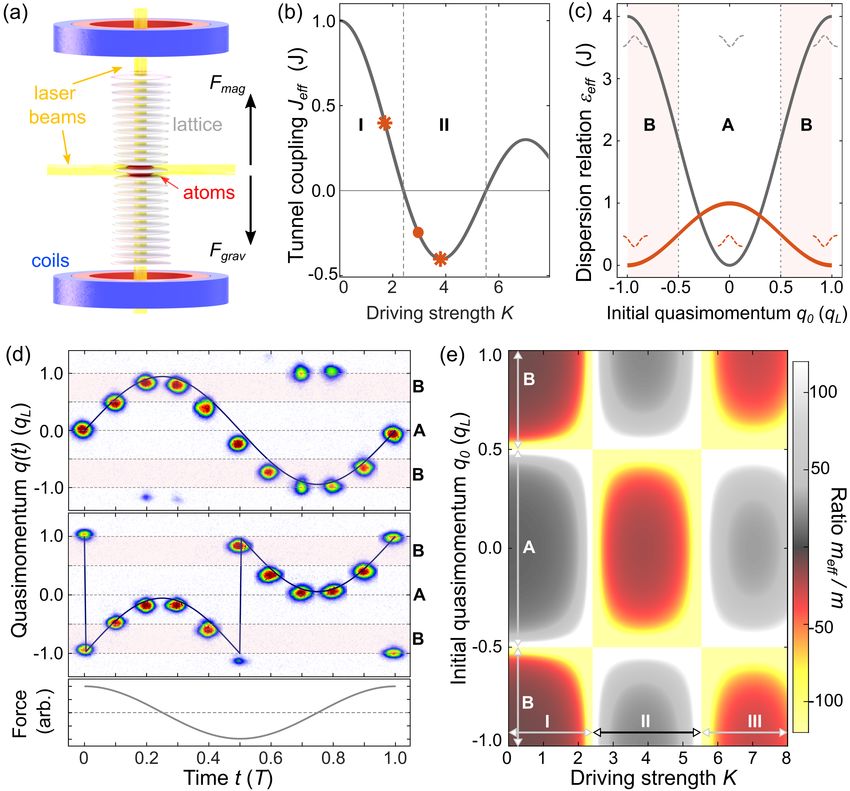
FIG. 1. Experimental setup, micromotion and effective mass. (a)
is surprising because the two states in the BZ are not con- Experimental setup. (b) Effective tunnel coupling, Jeff , as a func-
nected by a continuous change of driving strength, and other tion of driving strength K. Stars and circle indicate the parameters
mechanisms such as interactions, external forces, or cooling in Figs. 2 and 1(d), respectively. (c) Dispersion relation for K = 0
mechanisms are required for an explanation. Understanding (gray) and K = 2.97 (red). Dashed lines indicate the effective trap-
this time evolution is instrumental, e.g., for quantum simula- ping potential in regions A and B. (d) Absorption images showing
tion using ultracold atoms in driven systems, and the creation the micromotion of atoms for q0 = 0 (top) and q0 = qL (middle) with
driving force K = 2.97 and driving period T . (e) Ratio of effective
of Floquet condensates [19–21].
mass, meff (K, q0 ), to real mass, m (V = 12 Er ).
In this Letter, we experimentally study the evolution of
a weakly interacting BEC of cesium atoms in a periodi-
cally driven 1D lattice potential after a quench of the driv-
ing strength. Despite very weak interactions, which are con- when removing this trapping potential we observe the oppo-
trolled by tuning the s-wave scattering length as close to zero site effect for small atom numbers. In this case, we are able
via a magnetic Feshbach resonance, we observe the evolution to create matter-wave packets with a long-time stability at the
of atoms towards the edge of the BZ. We find that the evo- center of the BZ despite the inverted band and periodic driv-
lution time depends on the trap frequency along the lattice ing. The states show properties similar to bright matter-wave
direction, and we provide an intuitive explanation for this ef- solitons and we interpreted them as gap solitons [24, 25] with
fect by extending the concepts of group velocity and effective a negative effective mass in a periodically driven system.
mass to periodically driven systems [22]. Atoms in states with Our experimental starting point is a magnetically levitated
a negative effective mass are unstable due to an effectively BEC in a crossed-beam optical dipole trap and a vertical op-
expulsive trapping potential along the lattice direction [23], tical lattice potential at a wavelength λ = 1064 nm and lat-
which pushes them towards the edge of the BZ. Surprisingly, tice spacing dL = λ /2 [Fig. 1(a)]. Depending on the required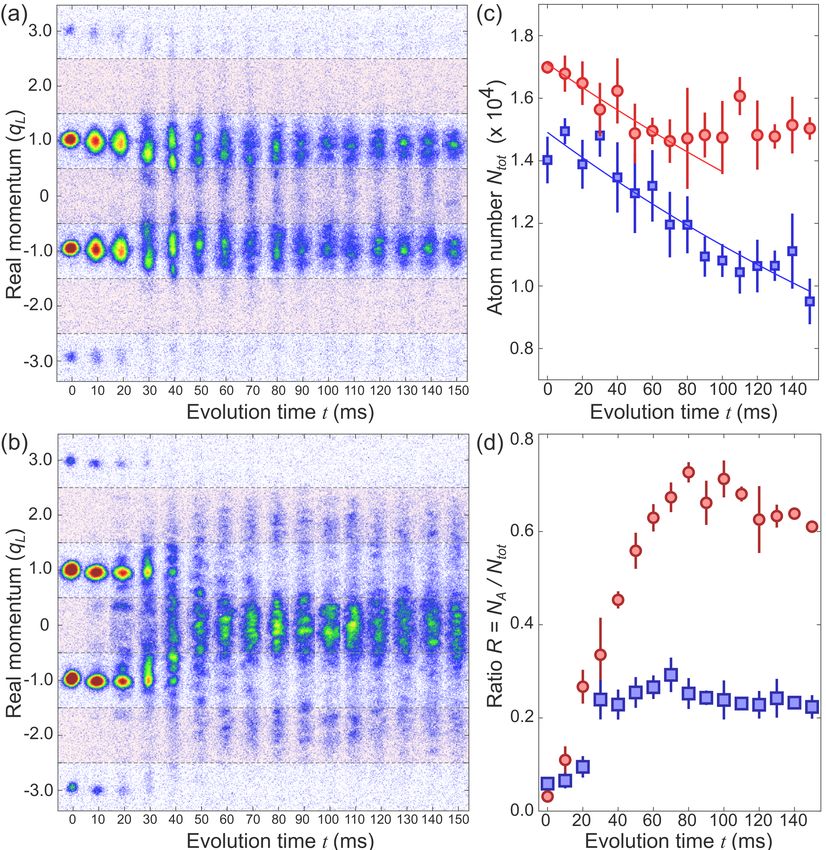
2

driving frequency, we apply the driving force, F(t), by either
modulating a vertical magnetic field gradient or by periodi-
cally shaking the position of the lattice sites with detuned laser
beam frequencies [19]. For fast driving, we avoid parametric
and interband excitations [26–29] by using shaking frequen-
cies with excitation energies in the 1st band gap of the lattice.
Further details about our setup and the parameters of our mea-
surements are presented in the Supplemental Materials [30].
   We use a semi-classical description of a wave packet in the
lowest lattice band to interpret our results. A driven wave
packet that is initially localized at a Bloch state with quasi-
momentum q0 moves through the           BZ according to the ac-
celeration theorem q(t) = q0 + 0t F(t 0 )dt 0 [22], with F(t) =
                                     R
                                                                       FIG. 2. Measurement of negative effective mass meff in a driven sys-
F0 cos(ωt), where F0 is the amplitude of the force and ω is            tem. (a) Absorption images of a wave packet, subject to a downwards
the driving frequency. We show this so-called micromotion              force, for K = 3.8 (meff < 0, jet color map) and K = 1.7 (meff > 0,
for q0 = 0 and q0 = qL = h̄π/dL [Fig. 1(d)]. Similar to Bloch          gray color map), V = 10.0(5) Er . (b) Position shift of the center of
oscillations [31], the wave packet cycles through the BZ with          the wave packet for meff < 0 (blue) and meff > 0 (gray). Lines are
Bragg scattering events at its edges. The micromotion in the           linear fits to determine the group velocity.
lowest band is well-defined by the parameters q0 and the di-
mensionless driving strength K = F0 dL /(h̄ω) [22].
   Time-averaging the energy over one period of the micro-             loading the atoms into a lattice with depth V = 10.0(5) Er ,
motion provides an effective dispersion relation [3, 13]               Er = π 2 h̄2 /(mdL2 ), the vertical trapping potential is switched
                                                                     off over 3 ms, and we start shaking the lattice with K = 1.7
                                              π                        (meff > 0) and with K = 3.8 (meff < 0) at a frequency ω =
             εeff (K, q0 ) = −2Jeff (K) cos      q0 ,          (1)
                                              qL                       2π × 1 kHz for a total time t [30, Sec. B]. A downwards force
                                                                       to accelerate the atoms is applied with a magnetic field gra-
with an effective tunneling matrix element, Jeff (K) =                 dient in the first 8 ms of t, and we monitor the subsequent
JJ0 (K), where J is the tunneling matrix element of the low-           motion of the wave packet by absorption imaging in position
est Bloch band, and J0 (K) is the zeroth order Bessel func-            space [Fig. 2]. We observe that the wave packet moves in the
tion. We label the regions with positive and negative Jeff with        direction of the force for meff > 0, but it moves upwards, op-
I and II (0 ≤ KI < 2.4 ≤ KII ≤ 5.5) in Fig. 1(b), and the re-          posite to the direction of the force, for meff < 0. The velocities
gions with quasimomenta close to the center (|q0 | < 0.5qL )           of the wave packets, +74(4) µm/s and −74(5) µm/s, are de-
and close to the edge (|q0 | ≥ 0.5qL ) of the BZ with A and            termined from linear fits of the position shifts and match the
B in Fig. 1(c). The change of sign and the resulting inver-            expected generalized group velocities ±66(7) µm/s [22, 30].
sion of εeff (K, q0 ) appear when a wave packet with q0 in re-         We employ this concept of a negative effective mass in the
gion A spends more time during the micromotion in region               following to explain the observed time evolution of the driven
B than in region A [top of Fig. 1(d)]. The argument of εeff is         wave packet.
the initial quasimomentum q0 at the start of a driving period
                                                                          We first demonstrate the stability of the ground states for K
T = 2π/ω, and experimental measurements need to probe the
                                                                       in regions I and II. The momentum distribution of the ground
system stroboscopically at integer multiples of T .
                                                                       state in region I is centered at q0 = 0, and we use a station-
   In analogy to non-driven lattice systems, we use the effec-
                                                                       ary wave packet to study the ground state for K = 1.96. In
tive dispersion relation to define the effective inertial mass,
                                                                       region II, the ground state is centered at q0 = qL , and we ac-
meff , of a wave packet
                                                                       celerate the wave packet with a magnetic field gradient to the
      meff (K, q0 ) = ∂q20 εeff (K, q0 )
                                       −1                            edge of the BZ before driving with K = 2.97 [30]. The driv-
                                                                       ing force is applied by shaking the lattice (V = 12.0(5) Er ,
                     "             2                  #−1
                                                                       ω = 2π × 1 kHz), while keeping the vertical trapping fre-

                                     dL           π
                    = 2Jeff (K)             cos      q0      .   (2)   quency ωz = 2π × 8.2(1) Hz unchanged. We measure the
                                     h̄           qL
                                                                       real momentum distribution instead of the quasimomentum to
The effective mass determines the spreading of the wave                avoid difficulties when band mapping in a shaking lattice [30,
packet [32, 33] and its response to an external force [23]. Pe-        Sec. A]. No significant change of the momentum distribution
riodic driving always increases |meff | and it inverts the signs       is observed over 600 ms, except for a loss of 25% of the atoms
of meff in region II [Fig. 1(e)].                                      [Figs. 3(a) and 3(b)].
   The increase of |meff (K, 0)| in a driven system was ob-               The time evolution of the state with q0 = 0 changes drasti-
served in the context of dynamic localization of matter waves          cally when we increase K to cross into region II. For Jeff ≈ 0,
[16]. Here, we demonstrate the sign change of meff by study-           the strong suppression of tunneling leads to dynamic local-
ing the response of a wave packet to a weak force. After               ization in position space [16–18]. In addition, we observe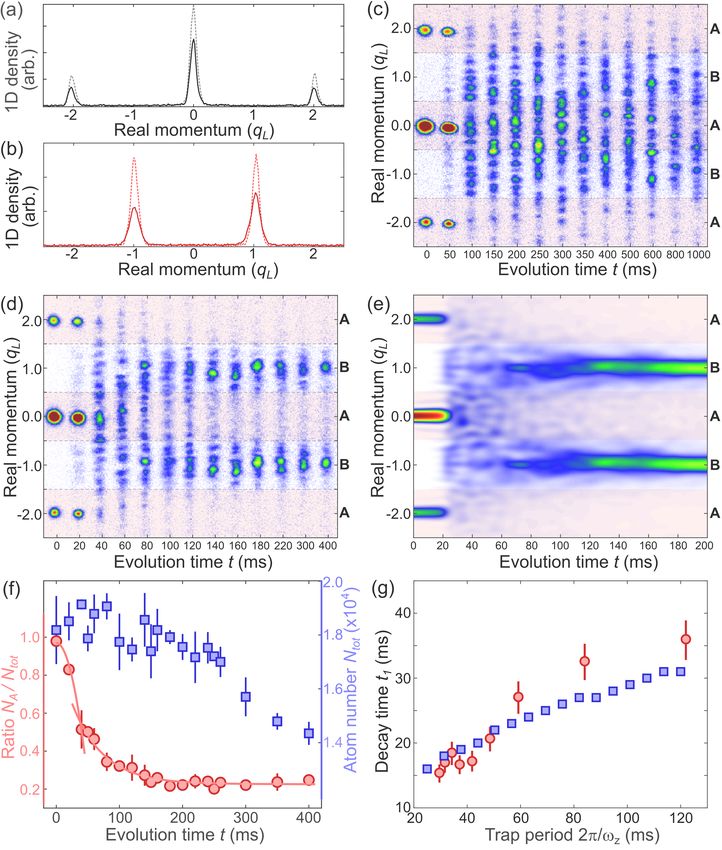
3

                                                                         from q0 = 0 towards the state q0 = qL [Fig. 1(d)]. While it
                                                                         is experimentally straightforward to enforce this change with
                                                                         external forces, the mechanism is unclear for periodic driv-
                                                                         ing without net momentum transfer. We exclude instabilities,
                                                                         relaxation and energy minimization in the band as explana-
                                                                         tions by demonstrating the stability of wave packets without
                                                                         driving for weak interactions [30, Sec. C]. For a quantitative
                                                                         analysis of the time evolution, we measure the ratio between
                                                                         the number of atoms in region A and the total atom number,
                                                                         R(t) = NA (t)/Ntot (t). R(t) decreases from close to 1 (all atoms
                                                                         in region A) to values between 0.5 (uniform distribution) and
                                                                         0.2 (localization in region B) [Fig. 3(f)].
                                                                            The concept of an effective mass provides an intuitive ex-
                                                                         planation for the initial dynamics of the wave packet. Quench-
                                                                         ing the driving strength from K = 0 to region II switches meff
                                                                         for the q0 = 0 state from positive to negative, with important
                                                                         consequences for the time evolution. The evolution of a wave
                                                                         packet with meff < 0 is identical to a wave packet with positive
                                                                         effective mass but with sign changes of the external potential
                                                                         and the interactions [23, 37]. Driving with K in region II effec-
                                                                         tively inverts the trapping potential for states with q0 in region
                                                                         A. Atoms in those states are no longer trapped by the external
                                                                         potential but accelerated away from the trap center. Atoms in
                                                                         states in region B, however, are trapped due to their positive
                                                                         effective mass [38].
                                                                            To simulate the complete dynamics, we numerically inte-
FIG. 3. Time evolution of the wave packet. (a) Momentum distribu-
                                                                         grate the discrete nonlinear Schrödinger equation for renor-
tions of ground states for t = 0 (dashed lines) and t = 600 ms (solid
lines) for K = 1.96, q0 = 0 and (b) for K = 2.97, q0 = qL . (c) Time     malized lattice parameters
evolution in momentum space with meff < 0 for suppressed tunnel-                             ih̄∂t ψ = (1 − iΛ)Heff ψ,                 (3)
ing Jeff = −0.01J (K = 2.43) and (d) for Jeff = −0.34J (K = 3.26).
Red patches indicated the regions A. (e) Numerical simulation with       with an effective Hamiltonian Heff in the tight-binding approx-
experimental parameters of (d). (f) Evolution of Ntot and ratio R for    imation [30, Sec. E], a wave function ψ, and a phenomenolog-
the measurement in (d). Solid lines are parabolic and exponential fits
                                                                         ical damping coefficient Λ [39, 40]. The simulation shows two
[30, Sec. D]. (g) Decay time t1 for increasing trap periods in experi-
ment (red circles) and simulation (blue squares).                        stages in the time evolution [Fig. 3(e)], i.e. the initial spread-
                                                                         ing and fragmentation of the wave packet, and the subsequent
                                                                         slow localization of the wave packet in region B. For weak
                                                                         interactions, the initial spreading is dominated by the trapping
the formation and spreading of a pattern of density peaks in             potential, which accelerates the atoms and causes a rapid re-
the momentum distribution [Fig. 3(c)]. Without tunneling, the            duction of R(t). The duration t1 for R(t) to drop to 0.7 in-
system consists of an array of independent BECs, each expe-              creases with the trap period 2π/ωz [Fig. 3(g)]. We find good
riencing a different time evolution of its phase. The interfer-          agreement between simulation and experiment when we add
ence pattern that forms after releasing those BECs form the              small atom number fluctuations to the initial state to simulate
lattice creates the momentum distribution, which can show                finite temperature and residual non-adiabaticity during lattice
revivals and temporal Talbot effects, depending on the time              loading [30, Sec. E].
evolution of the phases [34]. Such interference patterns have               The second stage in the time evolution is controlled by the
been demonstrated for matter waves without driving [35, 36],             damping parameter Λ, which simulates energy and atom loss.
and we believe that the density peaks in our measurement are             Without damping, the matter waves continue to oscillate in
formed by a similar mechanism in a driven system. The pat-               momentum space, while damping leads to the localization in
terns are fluctuating for experimental runs with identical con-          region B [30, Fig. S4]. We determine the 1/e-decay time of R
trol parameters, likely from increased technical noise due to            during the second stage with an exponential fit and find good
the driving force, hence we show averaged images in Fig. 3               agreement between experiment and simulation for Λ = 0.0225
(see [30, Sec. D] for images without averaging).                         [30, Fig. S5]. We believe that the energy removal in the ex-
   For stronger tunneling, Jeff = −0.34 J (K = 3.26), we ob-             periment is caused by atom loss. Without periodic driving,
serve that atoms in region A disappear or move to region B               we observe a larger loss of atoms in unstable regions of the
at the edge of the BZ [Fig. 3(d)]. This is intriguing, because           BZ than in stable regions [30, Fig. S1(c)], which can reduce
such a time evolution requires a change of the micromotion               the energy of the system. However, with periodic driving we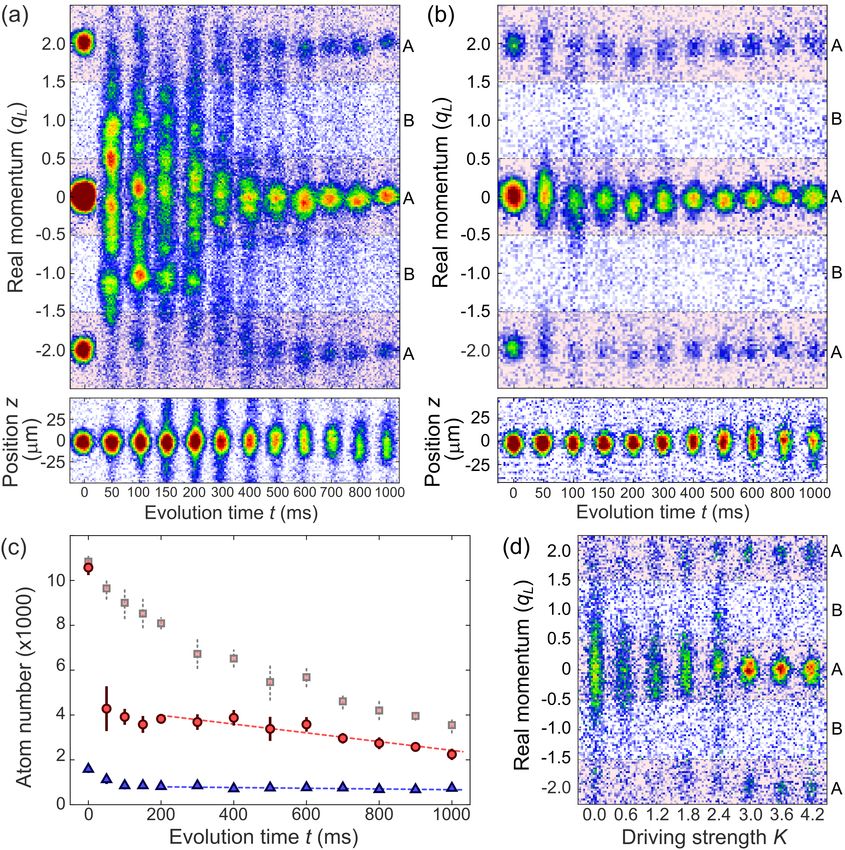
4

observe a continuous loss, which is independent of the ini-
tial state of the atoms [30, Fig. S3]. This loss might mask
other state-dependent loss features that cause the damping [30,
Sec. E].
    Another consequence of a negative effective mass is an ef-
fective sign change of the interaction strength [23, 37]. For
K in region II, a repulsively interacting wave packet with q0
in region A shows the same time evolution as a wave packet
with attractive interaction and effective mass |meff |. States in
region A are predicted to be unstable, e.g., due to dynamical
instabilities [28, 37, 41, 42], leading to a fast depopulation of
the states for strong interactions [19]. However, we observe a
different behaviour for weakly interacting atoms, which form
stable states in region A. We prepare a wave packet with ap-
proximately 11,000 atoms at as = 5.6 a0 , remove the verti-
cal trapping potential in 1 ms, and study the dispersion of the
wave packet for driving strength K = 4.2 [Fig. 4(a)]. The wave
packet is initially unstable and spreads over the BZ within
the first 200 ms while shedding atoms along the lattice di-
rection. This leads to a rapid reduction of the atom number
in region A and a continuous loss of the total atom number
[Fig. 4(c)]. After 400 ms, a localized wave packet forms at
q0 = 0 that is stable for the remaining observation time. The       FIG. 4. Matter-wave gap solitons. (a) Evolution of wave packet
initial spread is reduced when we lower the atom number to          in momentum space (top) and position space (bottom) for a total
1,600 [Fig. 4(b)], creating a wave packet that is stable both       initial atom number of 11, 000 and (b) of 1, 600 (V = 12.0(5) Er ,
                                                                    as = 5 a0 ,K = 4.2). (c) Atom number in region A for 11, 000 (red
in momentum and position space for the observation time of
                                                                    circles) and 1,600 (blue triangles) initial atoms. Gray squares pro-
1 s. The wave packet is almost dispersionless with a width of       vide Ntot for Ntot (0) = 11, 000. (d) Momentum distribution after
σ = 10(3) µm at t = 1 s and a dispersion of 2.8(7) µm/s [30,        500 ms of driving with for variable driving strength, Ntot (0) = 2, 000
Sec. F].                                                            (V = 12.0(5) Er , as = 3 a0 ). All measurements are performed with-
    We interpret the stable wave packets as matter-wave gap         out vertical trapping potential.
solitons in a periodically driven system. Gap solitons are
bright, non-dispersive wave packets with a total energy within
the band gap [24, 43, 44]. They have been experimentally            the BZ on a time scale that is set by the trapping potential
demonstrated for ultracold atoms in non-driven systems close        along the lattice direction. We explain this effect by an in-
to the edge of the band in region B where the wave packet has       version of the trapping potential due to the negative effective
a negative effective mass [25], and they were predicted for         mass and by energy removal due to atom loss. Third, a soliton-
driven systems in numerical simulations [45–47]. Controlling        like wave packet that is localized in position and momentum
meff through periodic driving allows us to create gap solitons      space forms for negative effective mass and weak interactions.
in other momentum states, in particular at q0 = 0 for a driving     We interpret the almost dispersionless wave packet as a gap
strength in region II. The observed solitons are larger than ex-    soliton for a periodically driven system. The driving provides
pected [30, Sec. F], which might be due to our limited imaging      great stability and control over motional states of the gap soli-
resolution, a small thermal background, or residual excitations     ton, with new experimental opportunities for metrology and
of the soliton [48]. We demonstrate the dependence of the gap       matter-wave quantum optics [49].
solitons on the driving strength K by measuring the spread of
the wave packet in momentum space after a driving duration            We acknowledge support by the EPSRC through a New
of 500 ms [Fig. 4(d)]. The wave packet disperses in region I        Investigator Grant (EP/T027789/1), the Programme Grant
(K < 2.4) and remains stable in region II, which indicates that     DesOEQ (EP/P009565/1), the Quantum Technology Hub in
it is indeed the change of signs of effective mass and effective    Quantum Computing and Simulation (EP/T001062/1) and the
interactions that provide stability.                                Programme Grant QSUM (EP/P01058X/1).
    In summary, we observe three characteristic patterns in the
time evolution of a wave packet with driving strength K in re-
gion II and negative effective mass. First, for a strong suppres-
sion of tunneling with Jeff ≈ 0, the momentum profile shows          [1] M. Lewenstein, A. Sanpera, V. Ahufinger, B. Damski,
a multitude of transient patterns which result from the phase            A. Sen(De), and U. Sen, Ultracold atomic gases in optical lat-
evolution of decoupled wave packets. Second, for sufficiently            tices: mimicking condensed matter physics and beyond, Adv.
strong tunneling, the wave packet accumulates at the edge of             Phys. 56, 243 (2007).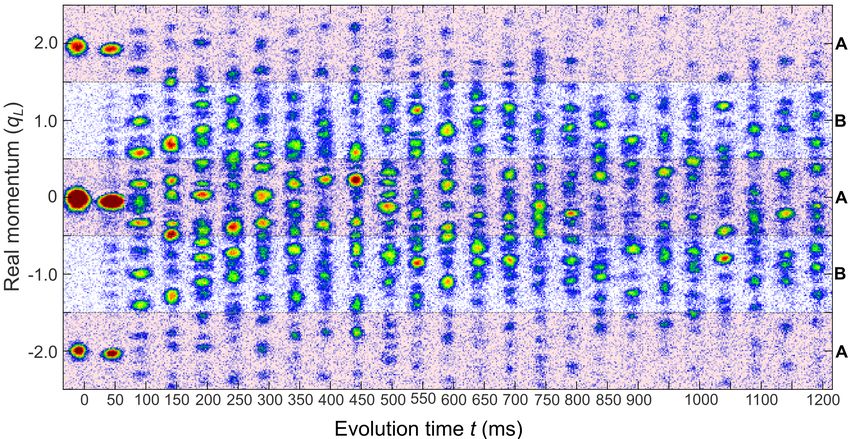
5

 [2] C. Gross and I. Bloch, Quantum simulations with ultracold                Rep. 9, 17614 (2019).
     atoms in optical lattices, Science 357, 995 (2017).                 [22] S. Arlinghaus and M. Holthaus, Generalized acceleration theo-
 [3] A. Eckardt, Colloquium: Atomic quantum gases in periodically             rem for spatiotemporal Bloch waves, Phys. Rev. B 84, 054301
     driven optical lattices, Rev. Mod. Phys. 89, 011004 (2017).              (2011).
 [4] A. Zenesini, H. Lignier, D. Ciampini, O. Morsch, and E. Ari-        [23] H. Pu, L. O. Baksmaty, W. Zhang, N. P. Bigelow, and
     mondo, Coherent Control of Dressed Matter Waves, Phys. Rev.              P. Meystre, Effective-mass analysis of Bose-Einstein conden-
     Lett. 102, 100403 (2009).                                                sates in optical lattices: Stabilization and levitation, Phys. Rev.
 [5] J. Struck, C. Ölschläger, R. Le Targat, P. Soltan-Panahi,              A 67, 043605 (2003).
     A. Eckardt, M. Lewenstein, P. Windpassinger, and K. Seng-           [24] K. M. Hilligsøe, M. K. Oberthaler, and K.-P. Marzlin, Stability
     stock, Quantum Simulation of Frustrated Classical Magnetism              of gap solitons in a Bose-Einstein condensate, Phys. Rev. A 66,
     in Triangular Optical Lattices, Science 333, 996 (2011).                 063605 (2002).
 [6] M. Aidelsburger, M. Atala, S. Nascimbène, S. Trotzky, Y.-A.        [25] B. Eiermann, T. Anker, M. Albiez, M. Taglieber, P. Treutlein,
     Chen, and I. Bloch, Experimental Realization of Strong Effec-            K.-P. Marzlin, and M. K. Oberthaler, Bright Bose-Einstein Gap
     tive Magnetic Fields in an Optical Lattice, Phys. Rev. Lett. 107,        Solitons of Atoms with Repulsive Interaction, Phys. Rev. Lett.
     255301 (2011).                                                           92, 230401 (2004).
 [7] J. Struck, C. Ölschläger, M. Weinberg, P. Hauke, J. Si-           [26] M. Weinberg, C. Ölschläger, C. Sträter, S. Prelle, A. Eckardt,
     monet, A. Eckardt, M. Lewenstein, K. Sengstock, and P. Wind-             K. Sengstock, and J. Simonet, Multiphoton interband excita-
     passinger, Tunable Gauge Potential for Neutral and Spinless              tions of quantum gases in driven optical lattices, Phys. Rev. A
     Particles in Driven Optical Lattices, Phys. Rev. Lett. 108,              92, 043621 (2015).
     225304 (2012).                                                      [27] M. Reitter, J. Näger, K. Wintersperger, C. Sträter, I. Bloch,
 [8] C. V. Parker, L. C. Ha, and C. Chin, Direct observation of ef-           A. Eckardt, and U. Schneider, Interaction Dependent Heating
     fective ferromagnetic domains of cold atoms in a shaken optical          and Atom Loss in a Periodically Driven Optical Lattice, Phys.
     lattice, Nat. Phys. 9, 769 (2013).                                       Rev. Lett. 119, 200402 (2017).
 [9] N. Goldman, G. Juzeliūnas, P. Öhberg, and I. B. Spielman,         [28] S. Lellouch, M. Bukov, E. Demler, and N. Goldman, Parametric
     Light-induced gauge fields for ultracold atoms, Rep. Prog.               Instability Rates in Periodically Driven Band Systems, Phys.
     Phys. 77, 126401 (2014).                                                 Rev. X 7, 021015 (2017).
[10] G. Jotzu, M. Messer, R. Desbuquois, M. Lebrat, T. Uehlinger,        [29] K. Wintersperger, M. Bukov, J. Näger, S. Lellouch, E. Demler,
     D. Greif, and T. Esslinger, Experimental realization of the topo-        U. Schneider, I. Bloch, N. Goldman, and M. Aidelsburger, Para-
     logical Haldane model with ultracold fermions, Nature 515, 237           metric instabilities of interacting bosons in periodically-driven
     (2014).                                                                  1D optical lattices, Phys. Rev. X 10, 011030 (2020).
[11] N. Fläschner, B. S. Rem, M. Tarnowski, D. Vogel, D.-S. Luh-        [30] See Supplemental Material for additional information.
     mann, K. Sengstock, and C. Weitenberg, Experimental recon-          [31] M. Ben Dahan, E. Peik, J. Reichel, Y. Castin, and C. Salomon,
     struction of the Berry curvature in a Floquet Bloch band, Sci-           Bloch Oscillations of Atoms in an Optical Potential, Phys. Rev.
     ence 352, 1091 (2016).                                                   Lett. 76, 4508 (1996).
[12] K. Wintersperger, C. Braun, F. N. Ünal, A. Eckardt, M. D. Lib-     [32] O. Morsch and M. K. Oberthaler, Dynamics of Bose-Einstein
     erto, N. Goldman, I. Bloch, and M. Aidelsburger, Realization of          condensates in optical lattices, Rev. Mod. Phys. 78, 179 (2006).
     an anomalous Floquet topological system with ultracold atoms,       [33] M. A. Khamehchi, K. Hossain, M. E. Mossman, Y. Zhang,
     Nat. Phys. 16, 1058 (2020).                                              T. Busch, M. M. Forbes, and P. Engels, Negative-Mass Hydro-
[13] M. Holthaus, Floquet engineering with quasienergy bands of               dynamics in a Spin-Orbit–coupled Bose-Einstein Condensate,
     periodically driven optical lattices, J. Phys. B At. Mol. Opt.           Phys. Rev. Lett. 118, 155301 (2017).
     Phys. 49, 013001 (2016).                                            [34] A. E. Kaplan, I. Marzoli, W. E. Lamb, and W. P. Schleich, Mul-
[14] D. H. Dunlap and V. M. Kenkre, Dynamic localization of a                 timode interference: Highly regular pattern formation in quan-
     charged particle moving under the influence of an electric field,        tum wave-packet evolution, Phys. Rev. A 61, 032101 (2000).
     Phys. Rev. B 34, 3625 (1986).                                       [35] M. Gustavsson, E. Haller, M. J. Mark, J. G. Danzl, R. Hart,
[15] M. Holthaus, Collapse of minibands in far-infrared irradiated            A. J. Daley, and H.-C. Nägerl, Interference of interacting matter
     superlattices, Phys. Rev. Lett. 69, 351 (1992).                          waves, New J. Phys. 12, 065029 (2010).
[16] H. Lignier, C. Sias, D. Ciampini, Y. Singh, A. Zenesini,            [36] M. J. Mark, E. Haller, J. G. Danzl, K. Lauber, M. Gustavsson,
     O. Morsch, and E. Arimondo, Dynamical Control of Matter-                 and H.-C. Nägerl, Demonstration of the temporal matter-wave
     Wave Tunneling in Periodic Potentials, Phys. Rev. Lett. 99,              Talbot effect for trapped matter waves, New J. Phys. 13, 085008
     220403 (2007).                                                           (2011).
[17] A. Eckardt, M. Holthaus, H. Lignier, A. Zenesini, D. Ciampini,      [37] C. E. Creffield, Instability and control of a periodically driven
     O. Morsch, and E. Arimondo, Exploring dynamic localization               Bose-Einstein condensate, Phys. Rev. A 79, 063612 (2009).
     with a Bose-Einstein condensate, Phys. Rev. A 79, 013611            [38] N. Tsuji, T. Oka, P. Werner, and H. Aoki, Dynamical Band Flip-
     (2009).                                                                  ping in Fermionic Lattice Systems: An ac-Field-Driven Change
[18] C. E. Creffield, F. Sols, D. Ciampini, O. Morsch, and E. Ari-            of the Interaction from Repulsive to Attractive, Phys. Rev. Lett.
     mondo, Expansion of matter waves in static and driven periodic           106, 236401 (2011).
     potentials, Phys. Rev. A 82, 035601 (2010).                         [39] S. Choi, S. A. Morgan, and K. Burnett, Phenomenological
[19] E. Arimondo, D. Ciampini, A. Eckardt, M. Holthaus, and                   damping in trapped atomic Bose-Einstein condensates, Phys.
     O. Morsch, Kilohertz-Driven Bose–Einstein Condensates in                 Rev. A 57, 4057 (1998).
     Optical Lattices, in Adv. At. Mol. Opt. Phys., Vol. 61 (2012)       [40] A. Rançon and K. Levin, Equilibrating dynamics in quenched
     pp. 515–547.                                                             Bose gases: Characterizing multiple time regimes, Phys. Rev.
[20] C. Heinisch and M. Holthaus, Adiabatic preparation of Floquet            A 90, 021602(R) (2014).
     condensates, J. Mod. Opt. 63, 1768 (2016).                          [41] B. Wu and Q. Niu, Landau and dynamical instabilities of the su-
[21] O. R. Diermann and M. Holthaus, Floquet-state cooling, Sci.              perflow of Bose-Einstein condensates in optical lattices, Phys.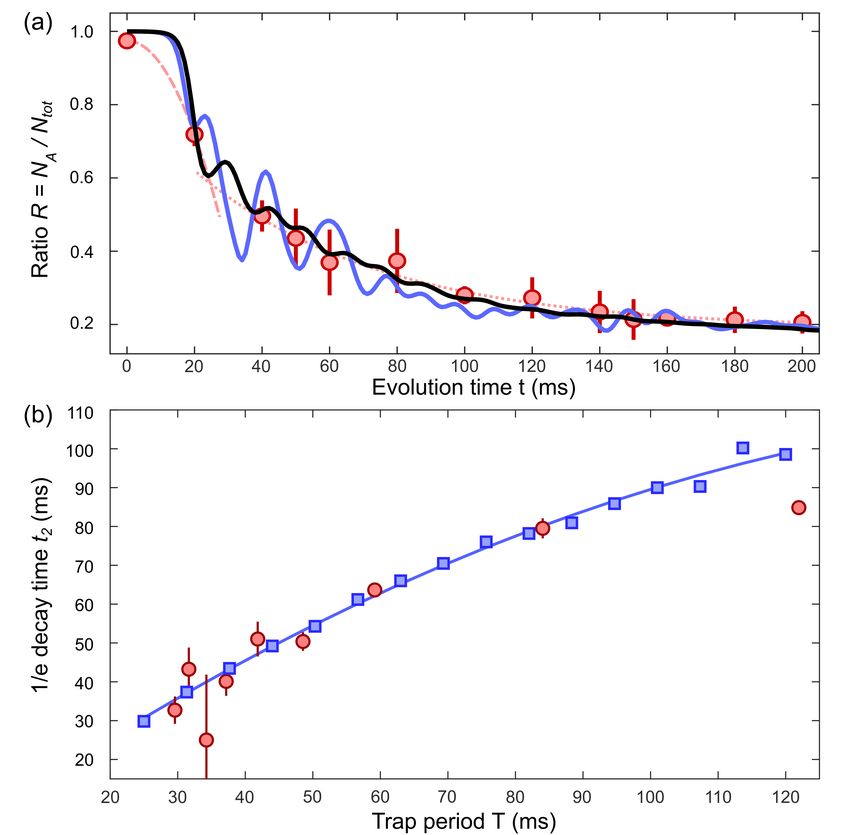
6

     Rev. A 64, 061603(R) (2001).
[42] L. Fallani, L. De Sarlo, J. E. Lye, M. Modugno, R. Saers,
     C. Fort, and M. Inguscio, Observation of Dynamical Instability
     for a Bose-Einstein Condensate in a Moving 1D Optical Lattice,
     Phys. Rev. Lett. 93, 140406 (2004).
[43] S. K. Adhikari and B. A. Malomed, Gap solitons in a model of
     a superfluid fermion gas in optical lattices, Phys. D Nonlinear
     Phenom. 238, 1402 (2009).
[44] P. Kizin, D. Zezyulin, and G. Alfimov, Oscillatory instabilities
     of gap solitons in a repulsive Bose–Einstein condensate, Phys.
     D Nonlinear Phenom. 337, 58 (2016).
[45] V. V. Konotop and M. Salerno, Modulational instability in
     Bose-Einstein condensates in optical lattices, Phys. Rev. A 65,
     021602(R) (2002).
[46] B. J. Da̧browska, E. A. Ostrovskaya, and Y. S. Kivshar,
     Instability-induced localization of matter waves in moving op-
     tical lattices, Phys. Rev. A 73, 033603 (2006).
[47] E. Michon, C. Cabrera-Gutiérrez, A. Fortun, M. Berger, M. Ar-
     nal, V. Brunaud, J. Billy, C. Petitjean, P. Schlagheck, and
     D. Guéry-Odelin, Phase transition kinetics for a Bose Einstein
     condensate in a periodically driven band system, New J. Phys.
     20, 053035 (2018).
[48] A. Di Carli, C. D. Colquhoun, G. Henderson, S. Flannigan, G.-
     L. Oppo, A. J. Daley, S. Kuhr, and E. Haller, Excitation Modes
     of Bright Matter-Wave Solitons, Phys. Rev. Lett. 123, 123602
     (2019).
[49] H. Sakaguchi and B. A. Malomed, Interactions of solitons with
     positive and negative masses: Shuttle motion and coaccelera-
     tion, Phys. Rev. E 99, 022216 (2019).
[50] A. D. Carli, C. D. Colquhoun, S. Kuhr, and E. Haller, Inter-
     ferometric measurement of micro- g acceleration with levitated
     atoms, New J. Phys. 21, 053028 (2019).
[51] A. Di Carli, G. Henderson, S. Flannigan, C. D. Colquhoun,
     M. Mitchell, G.-L. Oppo, A. J. Daley, S. Kuhr, and E. Haller,
     Collisionally Inhomogeneous Bose-Einstein Condensates with
     a Linear Interaction Gradient, Phys. Rev. Lett. 125, 183602
     (2020).
[52] E. Haller, R. Hart, M. J. Mark, J. G. Danzl, L. Reichsöllner, and
     H.-C. Nägerl, Inducing Transport in a Dissipation-Free Lattice
     with Super Bloch Oscillations, Phys. Rev. Lett. 104, 200403
     (2010).
[53] A. I. Yakimenko, K. O. Isaieva, S. I. Vilchinskii, and
     M. Weyrauch, Stability of persistent currents in spinor Bose-
     Einstein condensates, Phys. Rev. A 88, 051602 (2013).
[54] A. Smerzi and A. Trombettoni, Nonlinear tight-binding approx-
     imation for Bose-Einstein condensates in a lattice, Phys. Rev. A
     68, 023613 (2003).
7
SUPPLEMENTAL MATERIAL
A. Experimental setup
Our experimental setup consists of a crossed dipole trap
with vertical and horizontal laser beams at a wavelength of
λ = 1064 nm [Fig. 1(a)]. A vertical magnetic field gradient
is used to levitate the atoms against gravity, and a homoge-
neous magnetic field allows us to tune the s-wave scattering
length as with a magnetic Feshbach resonance [50, 51]. To
study weakly interacting atoms, we create a BEC with ap-
proximately 2 × 10⁵ atoms in state F = 3, mF = 3 at as =
210 a0 . We reduce the atom number to 1 × 10⁵ − 4 × 10⁴ by
changing the levitating field gradient over 3 s which tilts the
vertical trapping potential and removes atoms from the trap
[48]. Before loading the atoms into a vertical lattice (depth
V = 10 − 12 Er , Er = π 2 h̄2 /(2mdL2 ), where m is the mass of
a cesium atom, and dL = λ /2 = 532 nm is the lattice spac-
ing), we adjust the power in the horizontal beam to provide
the desired density of the BEC with typical trap frequencies
ωz between 2π × 8 Hz and 2π × 34 Hz. The radial frequency
of the vertical beam is ωρ = 2π × 12(1) Hz, and the s-wave
scattering length as is set to values between 3 a0 and 15 a0 , FIG. S1. Time evolution of matter waves in a non-driven lattice
depending on the measurement. system. (a) Evolution without the vertical confinement by the hor-
izontal laser beam. (b) Evolution with the horizontal laser beam and
We create the driving force, F(t), by either modulating the ωz = 2π × 16.9(5) Hz. The images are averaged over typically 3 rep-
electrical current that generates the vertical magnetic field gra- etitions. Red patches indicate regions with momentum |q| < 0.5 and
dient, or by periodically shifting the position of the lattice 1.5 < |q| < 2.5. (c) Atom number for (a) blue and for (b) red. (d)
sites [19, 52]. The vertical lattice is formed by two counter- Relative atom number in center of BZ for (a) blue and for (b) red.
propagating laser beams with independently controllable fre-
quency shifts, created by acousto-optical modulators. A fre-
quency difference ∆ν between the beams moves the lattice tice beams instantly to detect the real momentum distribution
with a velocity ∆νdL . We create the periodic driving force of the atoms after expansion.
within the reference frame of the lattice by modulating ∆ν
with a sinusoidal function. Alternatively, driving the atoms
with a time-varying magnetic field gradient allows us to di- B. Negative effective mass
rectly measure the micromotion of the atoms in the lab frame
with a modulation frequency ω = 2π × 50 Hz [Fig. 1(d)]. For The measurement in Fig. 2 demonstrates the response of
this method, the modulation frequency is limited by the induc- wave packets with positive and negative effective masses to
tance of the magnetic field coils to ω < 2π × 300 Hz. In all an external force. We use a BEC with approximately 2,600
other measurement [Figs. 2-4], we use the frequency shift of atoms, as = 15 a0 , and ωz = 2π × 8.2(1) Hz. After loading
the laser beams to drive the system with ω = 2π × 1 kHz. The the atoms into a lattice with V = 10.0(5) Er , in 150 ms, we
single photon excitation energy for this frequency is within switch off the horizontal laser beam in 3 ms, setting ωz close to
the band gap for a lattice depth V = 12 Er , with band width zero. We estimate the residual vertical trapping frequency due
≈ 2π × 100 Hz and band gap ≈ 2π × 8 kHz. to lattice and vertical laser beams to be below 2π × 0.05 Hz.
The atoms are detected using absorption imaging, either af- The driving force is generated by shaking the lattice with
ter a short time-of-flight of 1 ms to allow our magnetic fields ω = 2π × 1 kHz, starting at time t = 0. The driving strengths
to decay [Figs. 2(a), 4(a) bottom, and 4(b) bottom], or af- K = 1.7 and K = 3.8 correspond to positive and negative ef-
ter a levitated free expansion [40 ms in Figs. 1(d), 3(c), 3(d), fective masses with similar absolute values |meff /m| ≈ 13 for
30 ms in 4(a) top, and 20 ms in Figs. 4(b) top, 4(d)]. We em- q0 = 0.
ploy band mapping with a ramp down of the lattice intensities We apply a downwards force with our magnetic gradient
over 2 ms to demonstrate the micromotion in quasimomentum over the first 8 ms of t. The duration and value of the force
space for low driving frequencies in Fig. 1(d). However, band- are adjusted experimentally to accelerate the wave packet to a
mapping by ramping off the lattice intensity is ill-defined for quasimomentum q0 ≈ 0.4 qL for K = 1.7. We continue driv-
fast driving frequencies [Figs. 2-4] when ramp duration and ing the system for a variable hold time 20 ms ≤ t ≤ 180 ms
driving period are comparable. Instead, we switch off the lat- while measuring the displacement of the wave packet in posi-8
S1(b) are averaged over typically 3 repetitions to account for
pattern fluctuations.
The initial loss of atoms is similar for measurements with
and without external trap. However, the loss slows once the
atoms reach the stable region A [Fig. S1(c), red circles], and
it continues for atoms staying in region B [Fig. S1(c), blue
squares]. We observe that R(t) increases when atoms move
from region B into region A [Fig. S1(d)].
D. Driven time evolution with meff < 0
FIG. S2. Time evolution of a wave packet for meff < 0, K = 2.43, For the measurements presented in Fig. 3, we prepare
with 20, 000 atoms, V = 12.0(5) Er and as = 4 a0 identical to the
a BEC with approximately 20, 000 − 30, 000 atoms in the
parameters used in Fig. 3(c). Here, we use a single image per time
step, without averaging. crossed-beam dipole trap. The lattice depth is V = 12.0(5) Er
and the modulation frequency is ω = 2π × 1 kHz. The dis-
tribution in momentum space shows patterns of density peaks
tion space with absorption images. The center z0 of the wave which spread within the first 150 ms over the BZ. The patterns
packet is determined with a Gaussian fit of the vertical density are fluctuating for experimental runs with identical control pa-
profiles. The images in Fig. 2(a) are averaged over three rep- rameters and we show averaged images in Fig. 3 to indicate
etitions, and the error bars in Fig. 2(b) indicate the standard the variations. Images without averaging are provided for ref-
deviation of z0 for the repetitions. erence in Fig. S2.
In analogy to non-driven systems, we use the derivative We vary the longitudinal trapping frequency ωz = 2π × 8 −
of the effective dispersion relation to calculate the effective 34 Hz [Fig. 3(g)] and detect the atom distribution in real mo-
group velocity [22] mentum space after 40 ms of levitated expansion and 1 ms of
free fall. For the scan of the trap frequency, we use a driving
dL π strength of K = 2.97, as = 7 a0 and ωρ = 2π × 16(1) Hz. For
vg (K, q0 ) = ∂q0 εeff (K, q0 ) = 2Jeff (K) sin q0 ,
h̄ qL measurements in Figs. 3(c) and 3(d), we use driving strengths
of K = 2.43 and K = 3.26, respectively, and as = 4 a0 , ωρ =
which yields group velocities of ±66(7) µm/s for the para- 2π × 16(1) Hz, ωz = 2π × 11.9(6) Hz.
meters of our measurement. To model the time evolution, we define the atom number
ratio R(t) = NA (t)/Ntot (t), where NA (t) is the atom number in
region A and Ntot is the total atom number. The decay of R(t)
C. Non-driven time evolution with meff < 0 shows two stages: a fast initial drop and a slow exponential
decay. For the initial drop, we use the function R(t) = A −Bt 2 ,
We perform an additional measurement without periodic with free parameters A, B, to interpolate the experimental data
driving to find out if a wave packet minimizes its band energy points, and we determine the duration t1 with R(t1 ) = 0.7
for our interaction parameters. The wave packet is initially [Figs. 3 and S5(a)]. These values of t1 are shown in Fig. 3(g),
prepared at q = qL and we study its evolution with and without with the error bars indicating the duration for R to drop to 0.65
an external trapping potential. Without an external trap, we do and 0.75. For the slow exponential decay during the second
not observe an occupation of states close to the center of the stage, we use the fit function A exp(−Bt) +C with fit parame-
BZ, which would indicate a minimization of the band energy. ters A, B,C. The 1/e-decay times t2 in Fig. S5(b) are given by
The distribution broadens and fragments in momentum space, 1/B.
but it remains in region B [Fig. S1(a)]. In the presence of an We determine the atom number loss during the time evolu-
external trap, however, the atoms move into region A within a tion for wave packets initially prepared at q0 = 0 and q0 = qL .
time interval of 70 ms which is comparable to the trap period Wave packets with q0 = 0 have an excess energy 4Jeff ≈
of ≈ 60 ms [Fig. S1(b)]. We conclude that, for weakly inter- 2π h̄ × 20 Hz compared to final states with q0 = qL , and we be-
acting atoms, we do not observe energy minimization in the lieve that the energy is removed through loss of atoms during
lattice band, but energy minimization in the effective trapping the time evolution. The measured exponential lifetimes are
potential. 1.9(1) s (q0 = 0) and 1.8(3) s, (q0 = qL ), and > 30 s without a
In detail, a BEC with approximately 16,000 atoms at as = driving force (K = 3.26, V = 12.0(5) Er , ωz = 2π × 8.2(1) Hz,
4 a0 is prepared in the crossed-beam dipole trap with ωz = and as = 8 a0 ) ) [Fig. S3]. We observe an increase of atom loss
2π × 16.9(5) Hz and the vertical lattice V = 12.0(5) Er . We due to the driving force, but no significant difference between
ramp down the horizontal dipole beam in 3 ms and increase wave packets that evolve from the center of the BZ to the edge,
the magnetic levitation field for 3 ms to accelerate the wave and wave packets that already start at the edge. We conclude
packet to a quasimomentum of qL . Images in Figs. S1(a) and that energy gain and atom loss due to the inverted dispersion9
FIG. S3. Atom loss with evolution time for Ntot (0) ≈ 15, 000 atoms,
V = 12 Er and as = 8 a0 . Red circles: no driving, K = 0, q0 = 0. Blue
squares: K = 3.26, q0 = 0. Green triangles: K = 3.26, q0 = qL .
relation is negligible compared to heating and atom loss due
FIG. S4. Simulation of the time evolution of a wave packet using
to the periodic driving force.
Eq. (4) with N = 24, 000, as = 4.0 a0 , ωz = 2π × 29.2 Hz, ωρ =
2π × 16 Hz, V = 12 Er . The driving frequency is ω = 2π × 1 kHz
and the driving strength is K = 3.26. (a) No damping, Λ = 0. (b)
E. Damped non-linear Schrödinger equation With damping, Λ = 0.0225. (c) Single realization and (d) an average
over 32 realizations with damping and atom number fluctuations.
We use a damped 1D Gross-Pitaevskii equation to model
the time evolution of the condensate following the quench of 2
the shaking [39]: and the mean field interaction 4π h̄mas N |ψ(~r,t)|2 , the factoriza-
tion Eq. (5) leads to the mean-field Hamiltonian [54]:
ih̄∂t ψ = (1 − iΛ)Heff ψ, (4) n
with the complex vector ψ whose elements are the ampli- Heff = ∑ ε j ψ ∗j ψ j − J0 (K) J +j ψ ∗
j ψ j+1 + J − ∗
j ψ j ψ j−1
j
tudes of the condensate wave function at each lattice site. The
+g|ψ j |2 − χ |ψ j |2 ψ j (ψ ∗j+1 + ψ ∗j−1 ) + c.c. ,
non-linear effective Hamiltonian, Heff , and details of ψ are
explained below. The parameter Λ in Eq. (4) introduces a dis- (6)
sipation process that, heuristically, explains the loss of energy
after quenching the driving. The dissipative model Eq. (4) has where J0 (K) is the zero-order Bessel function of the first
been employed to study non-equilibrium processes in BECs, kind and:
such as the stability of topological excitations [53] and the dy- √
h̄ωz ωz d 2 2 1
h̄ωρ π
namics following a quench [40]. In our case, Eq. (4) with a εj = j + +
2 ω̃z ã2z 2 2
constant and spatial-independent Λ explains qualitatively our 2 2
√
ã2z
observations. ± mωz dL π 2
Jj = J + j ∓ j+ 2 +
We apply the tight-binding approximation to derive the 1D 2 2dL
effective Hamiltonian, Heff [54]. With this approach, the dL2
h̄ωρ π
condensate wave function is modelled as a superpositions of exp − 2
2 4ãz
Gaussians centred at each node, j, of the optical lattice:
1 ãz 4π h̄2 as N
" # g=
mω̄ 3/4 (z − jdL )2 ρ2 (2π)3/2 a2ρ
m
ψ(~r,t) =
h̄ ∑ ψ j (t) exp − ã2z exp − 2 ,
aρ 4π h̄2 a N π 3/2 mω̄ 3 7d 2
j s
(5) χ= exp − L2 .
m 2 h̄ 8ãz
where where ψ j is the complex amplitude of the wave func-
tion at lattice site j,pdL is the periodicity of the lattice, aρ = The spatial dependence of the energy shift, ε j , and the tun-
nelling rate, J ±
j , reflect the lattice-symmetry breaking effects
p
h̄/mωρ and ãz = h̄/mω̃z are the radial and axial Gaussian
widths with trap frequencies ωρ and ω̃z at the center of the of the trap.
nodes of the optical lattice, respectively. ω̄ = (ω̃z ωρ2 )1/3 is the In the non-dissipative case (Λ = 0), we observe that the ini-
geometrical average of the trapping frequencies at each lattice tial state, centered around q0 = 0, evolves towards the edge
site. The wave function Eq. (5) is normalized, ∑ j ψ j = 1.
2 of the BZ as in the experiment. In this case, the central
Including the harmonic trapping potential region and the edges of the BZ become equally populated
and the atoms never localize in region B [Fig. S4(a)]. Set-
1 ting Λ > 0, we observe a significant change of the dynamics
V (ρ, z) = m(ωρ2 ρ 2 + ωz2 z2 )
2 [Fig. S4(b)]. The recurrences of the wave function disappear10
defining a fast time scale that is dominated by the trap period.
We compare the duration t1 with R(t1 ) = 0.7 in simulation and
experiment and find good agreement [Fig. 3(g)].
The second stage of the time evolution follows an exponen-
tial decay that depends on Λ and on the trap period. The values
of Λ = 0.0225 and of ∆ψ = 0.0005 are chosen to match the
experimental data. We find good agreement of the 1/e-decay
time t2 between the simulation and the experimental data for
varying trap periods [Fig. S5(b)]. The damping parameter Λ
is constant in the simulation, but it might decrease in the ex-
periment for atoms in stable states at the edge of the BZ. We
speculate that deviations between experiment and simulation
in Figs. 3(g) and S5(b) are caused by state-dependent damping
mechanisms in the experiment.
F. Gap solitons with periodic driving
For the measurements presented in Fig. 4, we prepare BECs
with approximately 11, 000 and 1, 600 atoms a 1D lattice
FIG. S5. (a) Comparison of the decay of the number of atoms in with V = 12.0(5) Er , ωz = 2π × 23.9(4) Hz, and as = 5.6 a0 .
region A, R = NA /Ntot , as a function of time. The red circles are The radial trap frequency of the vertical laser beam is 2π ×
experimental measurements with as = 7.0 a0 , ωz = 2π × 20.6(6) Hz, 12(1) Hz. We remove the horizontal laser beam in 1 ms to al-
ωρ = 2π × 16(1) Hz, V0 = 12.0(5) Er and K = 2.97. The red dot- low for a vertical expansion, and shake the lattice for the evo-
ted (dashed) line fits the late (early) decay of R(t) to an exponential
lution time t with ω = 2π × 1 kHz and K = 4.2. Figures 4(a)
(quadratic) function, defining a slow (fast) times scale [Sec. D and
E]. The blue and black lines are numerical results of a single run and and 4(b) show the momentum distribution of the evolving
of an average over 32 realizations of the atom number fluctuations, wave packet. The images are averaged over typically 4 rep-
respectively. (b) Comparison of the experimental (red circles) and etitions.
numerical (blue squares) 1/e-decay times during the second stage We measure the spread of the wave packets in positions
of the time evolution for varying trap period. The numerical re- space [Fig. S6], using the expected density profile, n(z), for
sults are obtained using the experimental parameters and Λ = 0.0225, a gap soliton [47]
∆ψ = 0.0005 and N = 24, 000. The line is a quadratic fit to the sim-
ulation data to guide the eye. z
n(z) = n0 sech2
σ
(due to the loss of energy) which leads to, after a transition as a fit function. Here, n0 is the peak 1D density and σ is
period, the settling of the wave function at the edge of the the width of the soliton. The width σ increases slowly with
BZ (q0 = qL ). For our experimental parameters, a value of 12.7(6) µm/s for N0 = 11, 000, and the wave packet is almost
Λ = 0.0225 provides a time evolution that is similar to our ex- dispersionless with 2.8(7) µm/s for N0 = 1, 600. For N0 =
perimental measurements, except for a time delay of the initial 1, 600 and t = 1 s, we measure a width σ = 10(3) µm and a
spreading of the wave packet. We reduce this initial time delay peak density n0 ≈ 20 atoms/µm. The predicted width of the
by adding small atom-number fluctuations to the initial state gap soliton is
[47]. The fluctuations are implemented by shifting the ground s
state wave function at each lattice site by a random real num- −2Jeff (K)dL
σ= = 4(1) µm,
ber from a uniform distribution centred at zero and with am- Un0
plitude ∆ψ = 0.0005. Results of a typical single run and after
taking the average over several realisations with randomized where U is the on-site interaction strength [47]. The predicted
noise are shown in Figs. S4(c) and S4(d), respectively. value is below our resolution limit (≈ 7 µm for distinguishable
Our numerical results show that the trajectory of the frac- objects) and smaller than our measured value. We believe that
tion R(t) of the cloud in region A has two time scales, as the deviation is caused by a broadening due to our imaging
shown in Fig. S5(a) for a representative set of parameters. Ini- resolution, by a small thermal background, and by residual
tially, the transition from R = 1 to R ≈ 0.7 occurs quickly excitations of the soliton [48].11 FIG. S6. Time evolution of gap solitons. Gaussian 1/e-width of the wave packet in position space in Figs. 4(a) and 4(b) for Ntot (0) = 11, 000 (red circles) and 1,600 (blue triangles), V = 12.0(5) Er , as = 5.6 a0 , K = 4.2. Lines are linear fits with gradients of 12.7(6) µm/s (red line) and 2.8(7) µm/s (blue line).
You can also read